The document summarizes key concepts about international portfolio investments from Chapter 15:
- International investments can increase profits and reduce risk through diversification since returns between countries are only moderately correlated. An example shows a US investor who invests equally in assets from their home country (X) and a foreign country (Y) achieves lower overall risk through diversification.
- While international diversification offers benefits, many investors exhibit "home bias" by disproportionately investing in their home country rather than globally. Barriers like taxes, costs and regulations contribute to home bias.
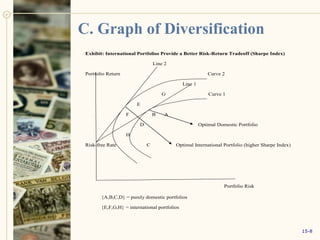
- Graphically, portfolios that include international assets (lines E-H) offer a better risk-return tradeoff compared to purely domestic portfolios