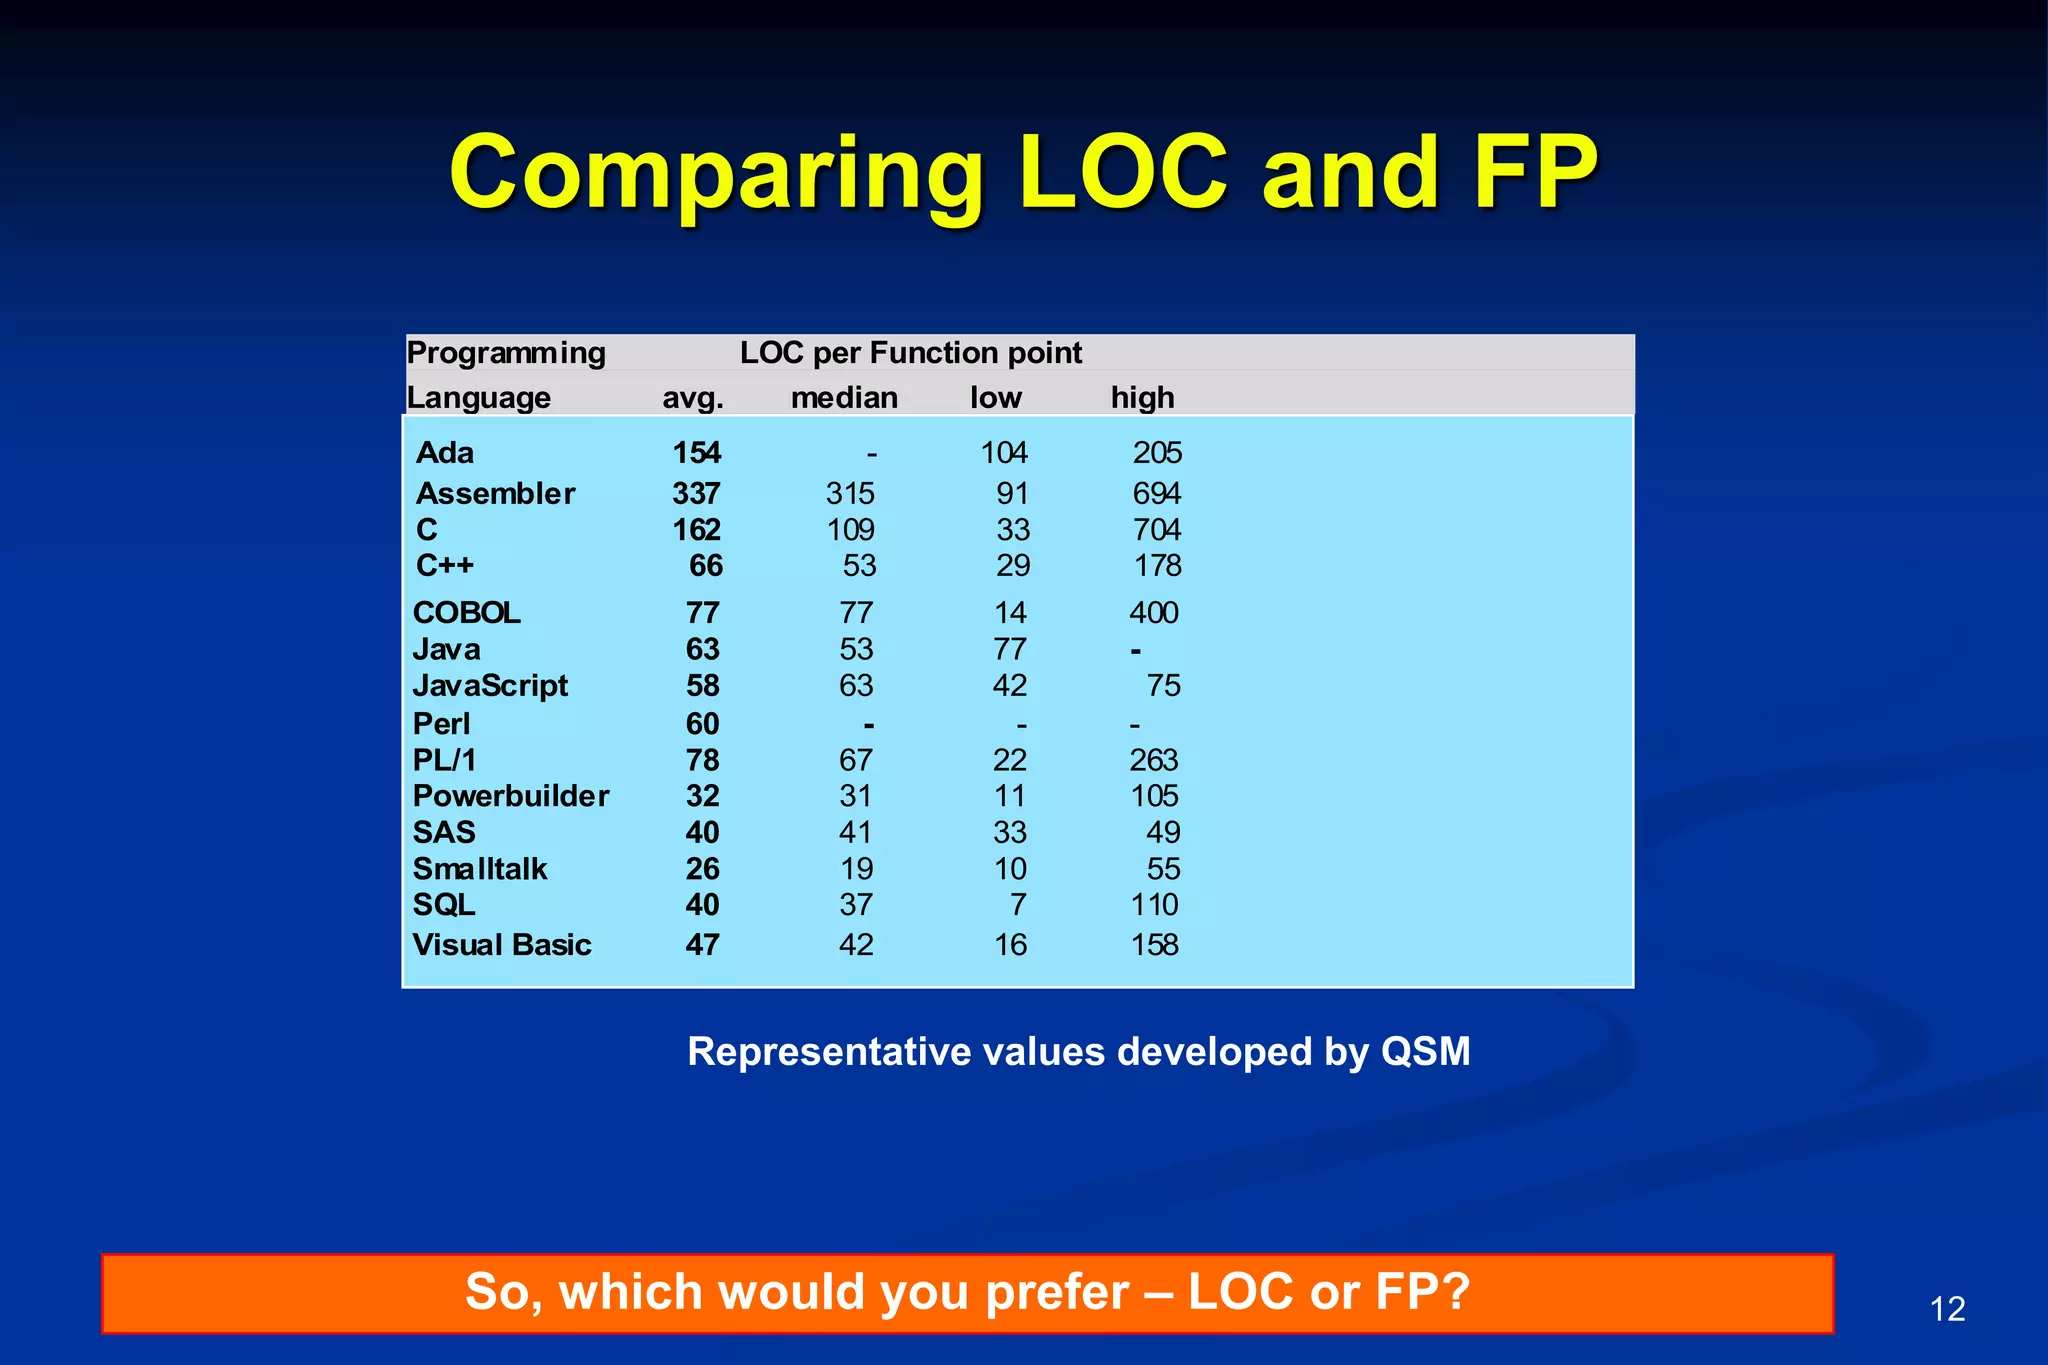
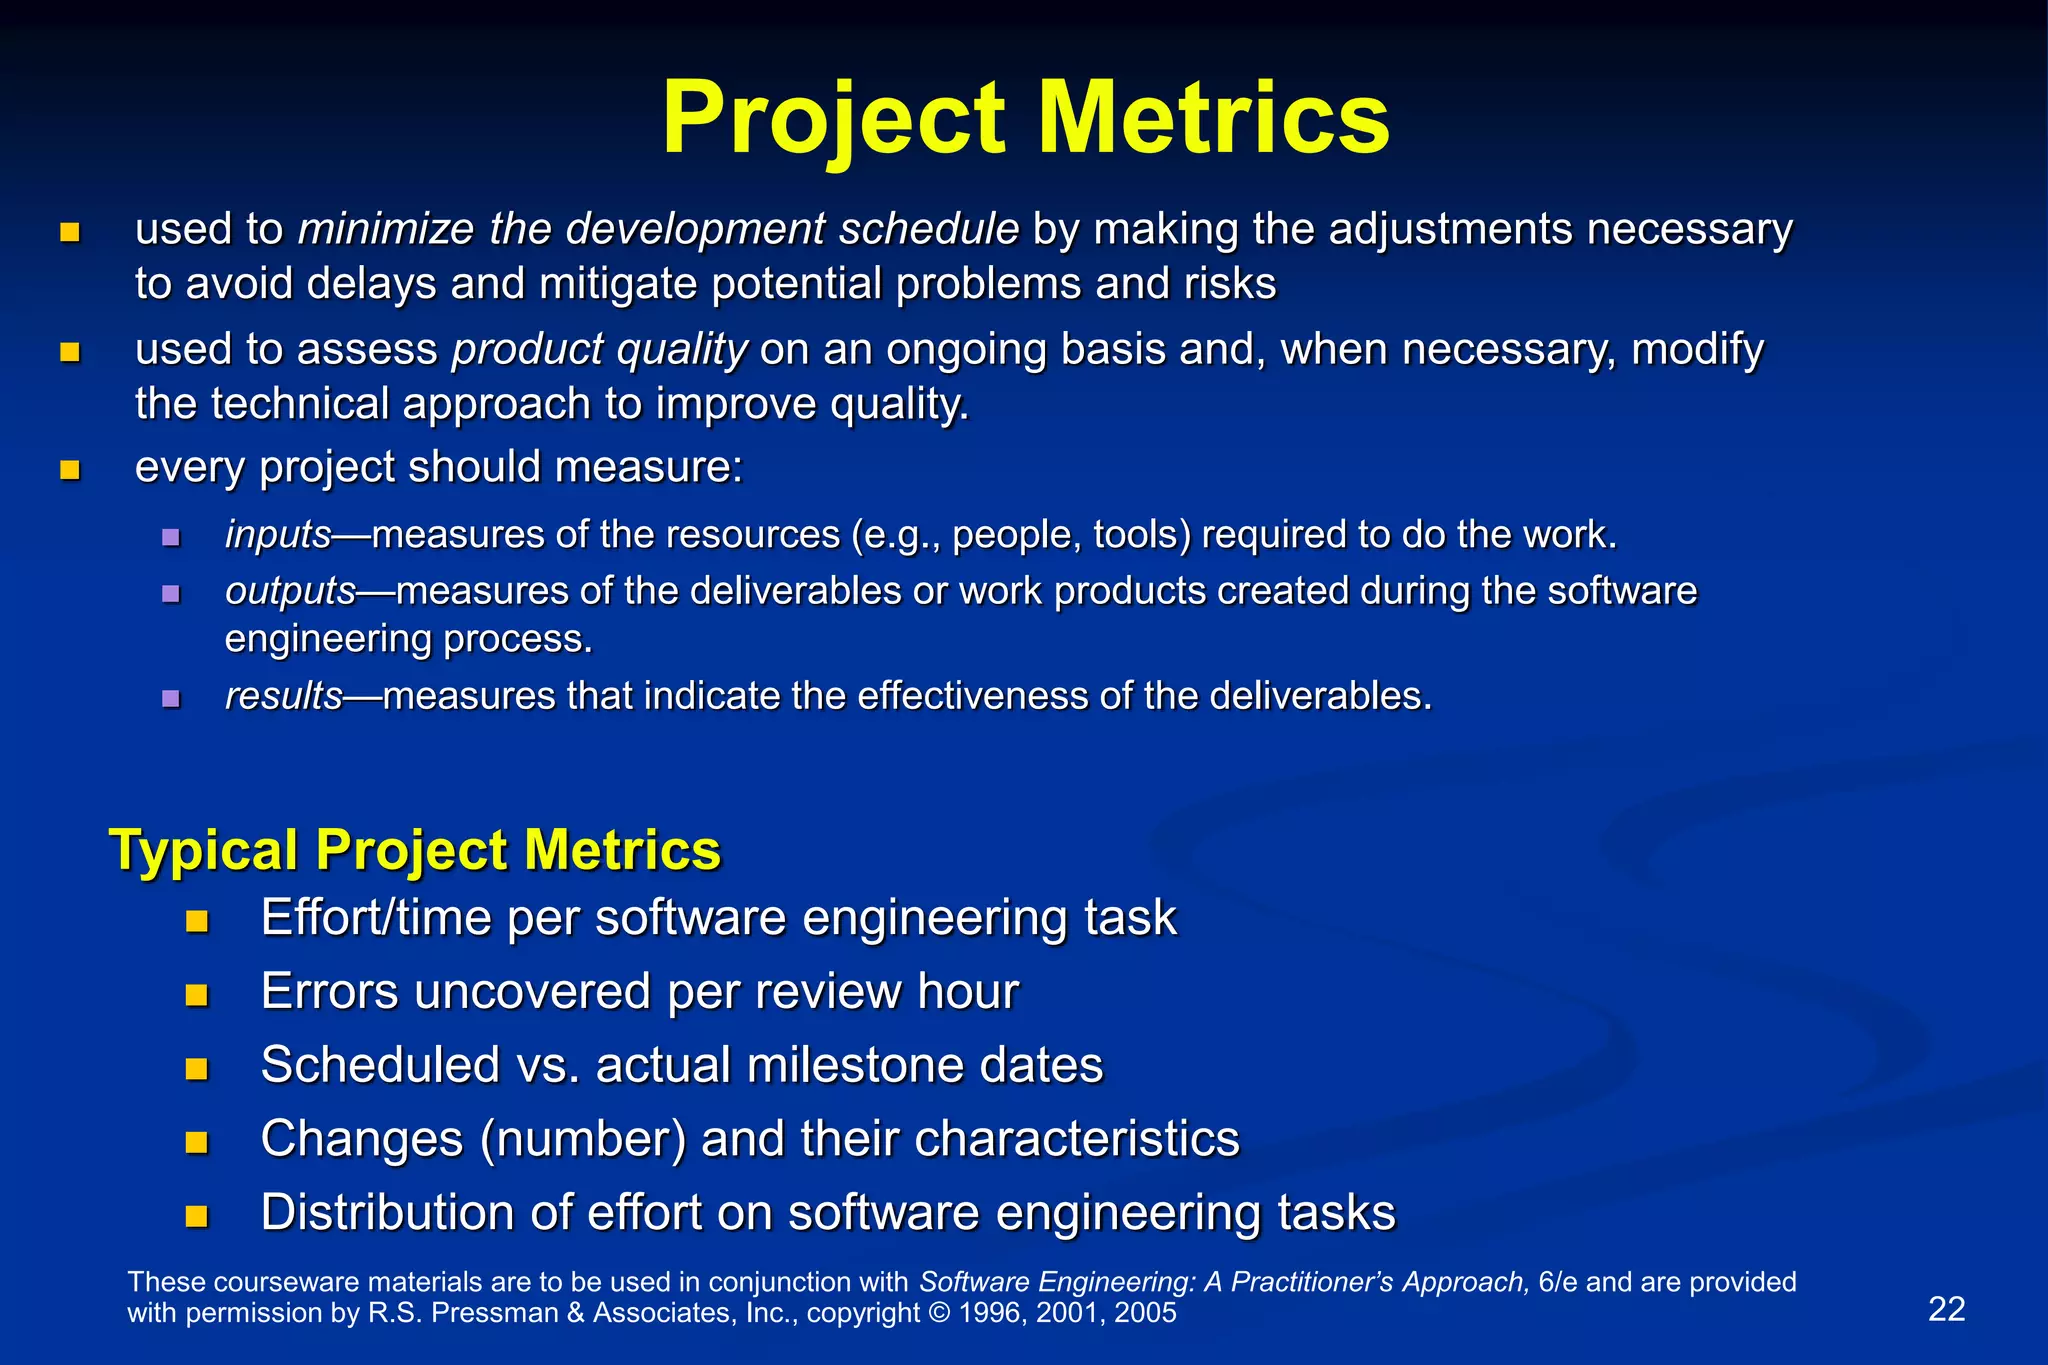
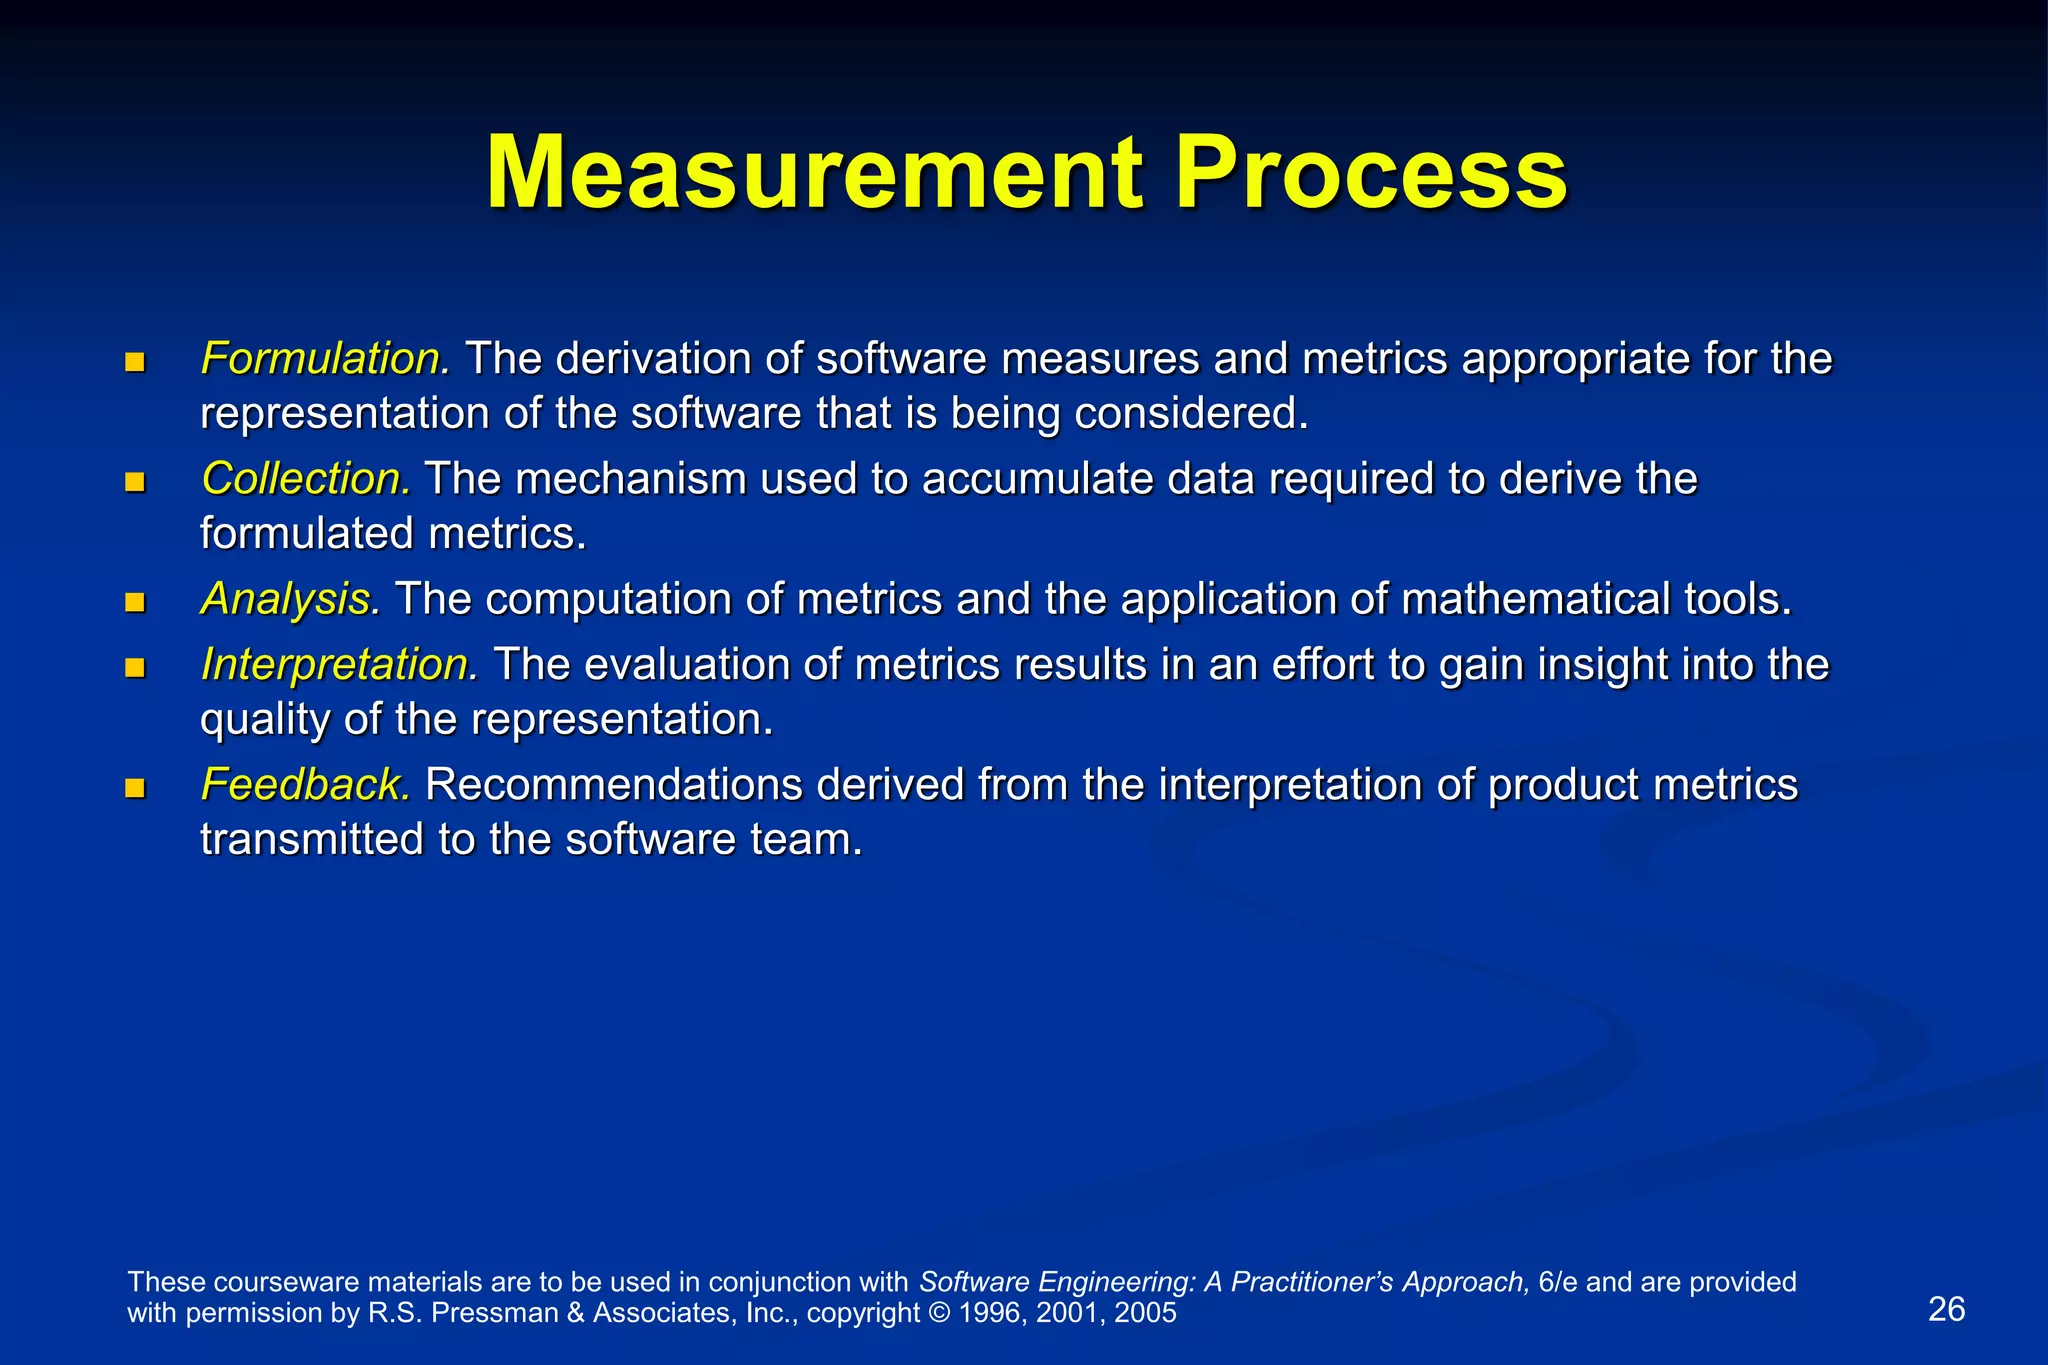
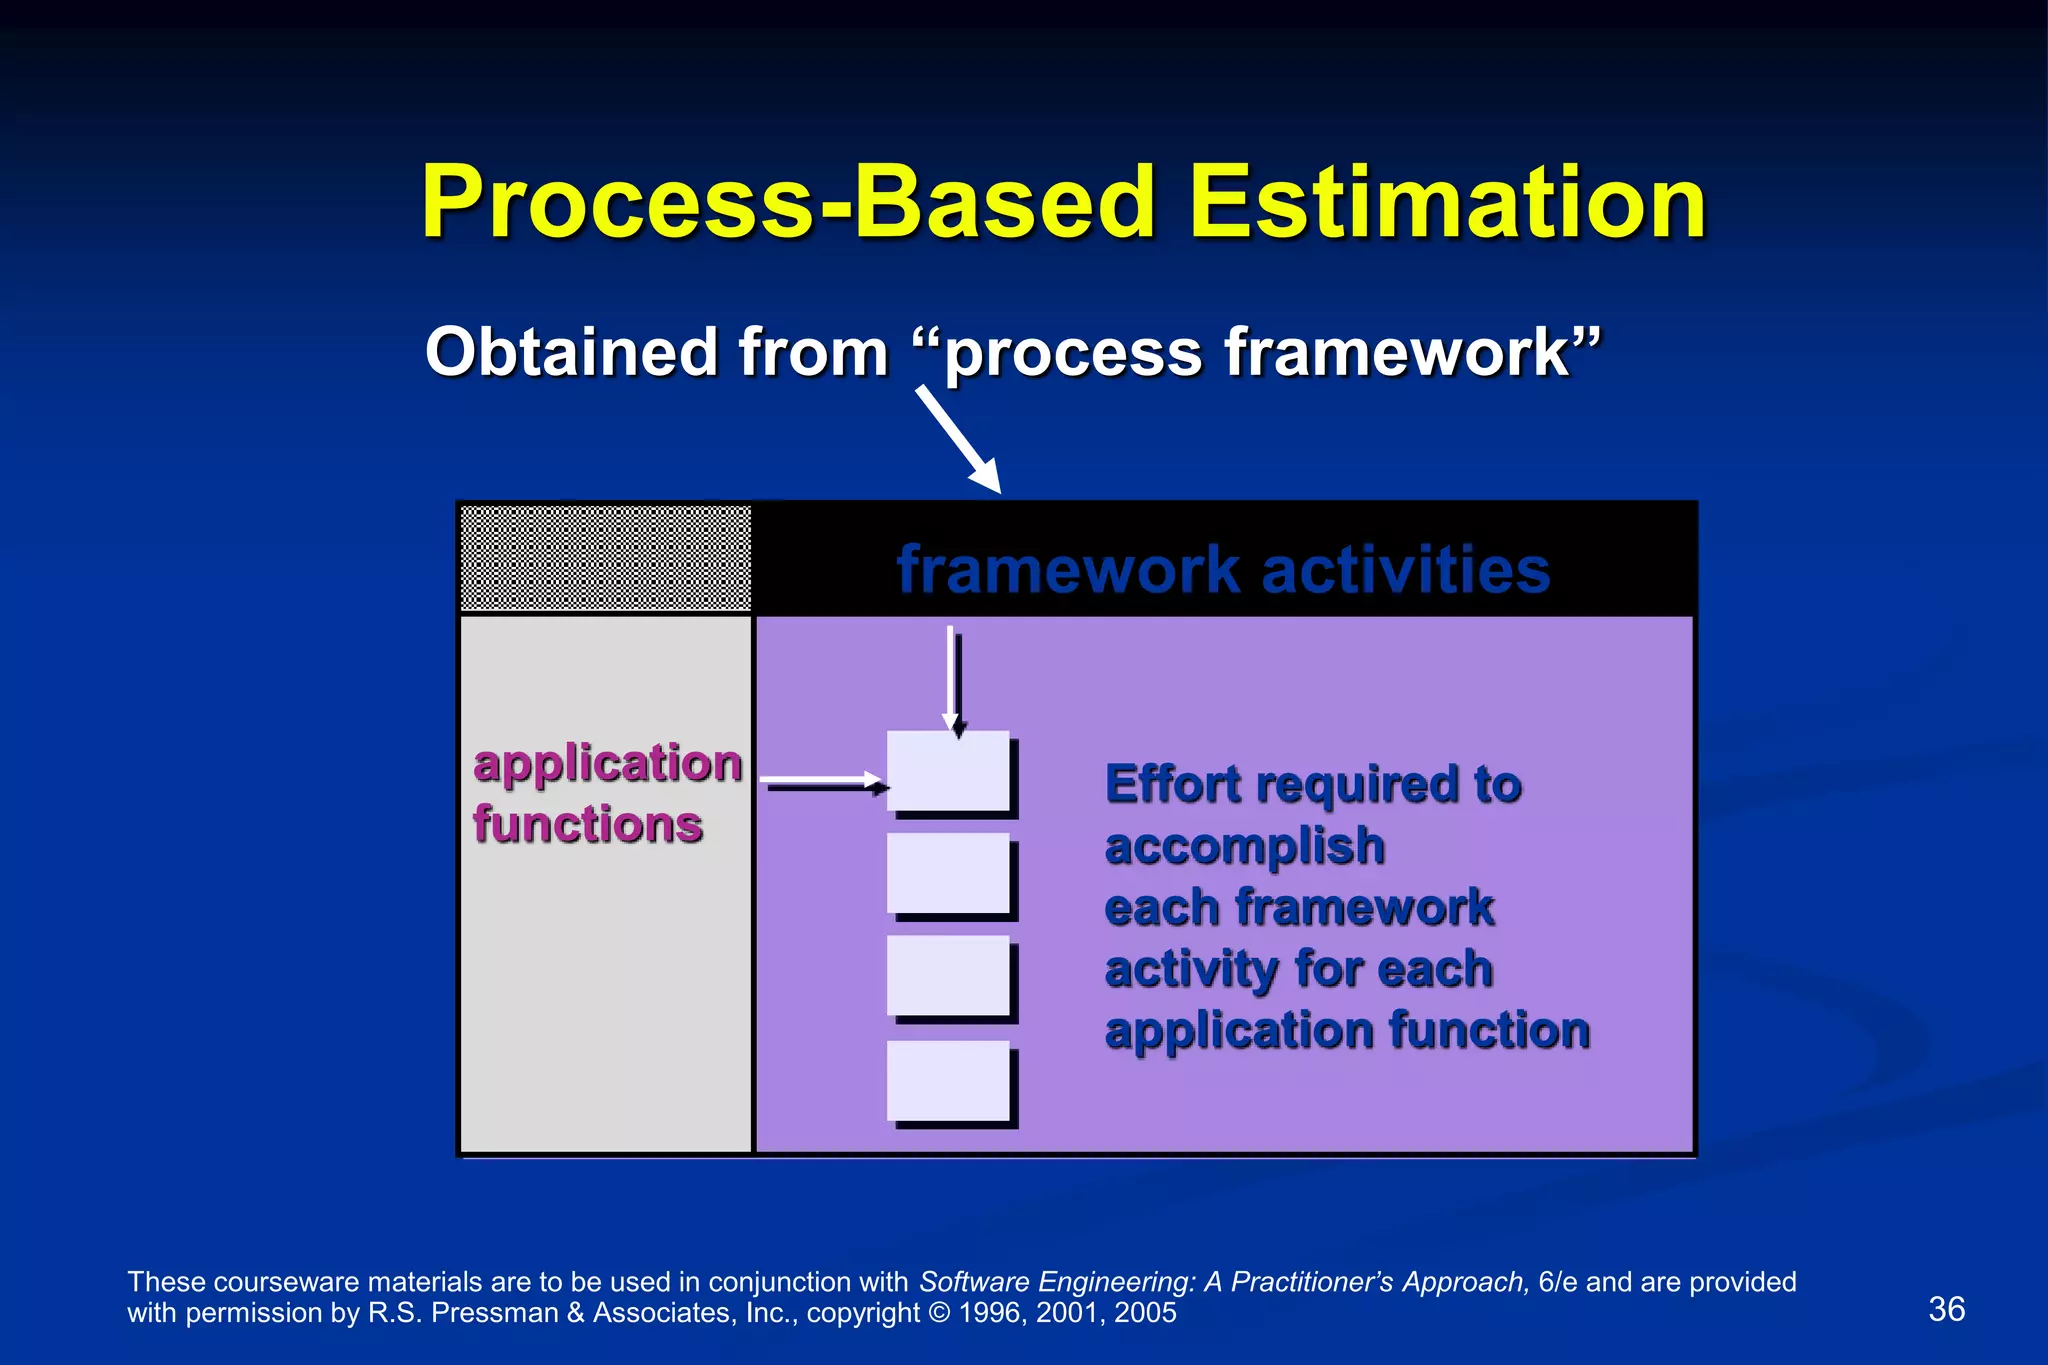
The document discusses metrics and measurement concepts related to software engineering processes, products, and projects. It includes definitions of measures, metrics, size-oriented metrics, function-oriented metrics, function point analysis, lines of code estimation, use case estimation, the make-buy decision, class-oriented metrics, measurement principles, and process measurement. Examples are provided for many of these concepts.
![These courseware materials are to be used in conjunction with Software Engineering: A Practitioner’s Approach, 6/e and are provided
with permission by R.S. Pressman & Associates, Inc., copyright © 1996, 2001, 2005 1
Process, Product and Project Metrics
Product Metrics for Software
Estimation for Software Projects
based on
Chapter 15
Chapter 22
Chapter 23
Software Engineering: A Practitioner’s Approach, 6/e
copyright © 1996, 2001, 2005
R.S. Pressman & Associates, Inc.
For University Use Only
May be reproduced ONLY for student use at the university level
when used in conjunction with Software Engineering: A Practitioner's Approach.
Any other reproduction or use is expressly prohibited.
San Diego International Airport – Access Control System:
System transactions—over 250000 per. day.
Average processing time—less than 15. seconds.
Reliability—99.99%.
System capability—upgradeable and. expandable ...
[www.biometric.org]](https://image.slidesharecdn.com/ch15-22-231-230719063209-466ef180/75/Ch15-22-23-1-ppt-1-2048.jpg)
![These courseware materials are to be used in conjunction with Software Engineering: A Practitioner’s Approach, 6/e and are provided
with permission by R.S. Pressman & Associates, Inc., copyright © 1996, 2001, 2005 4
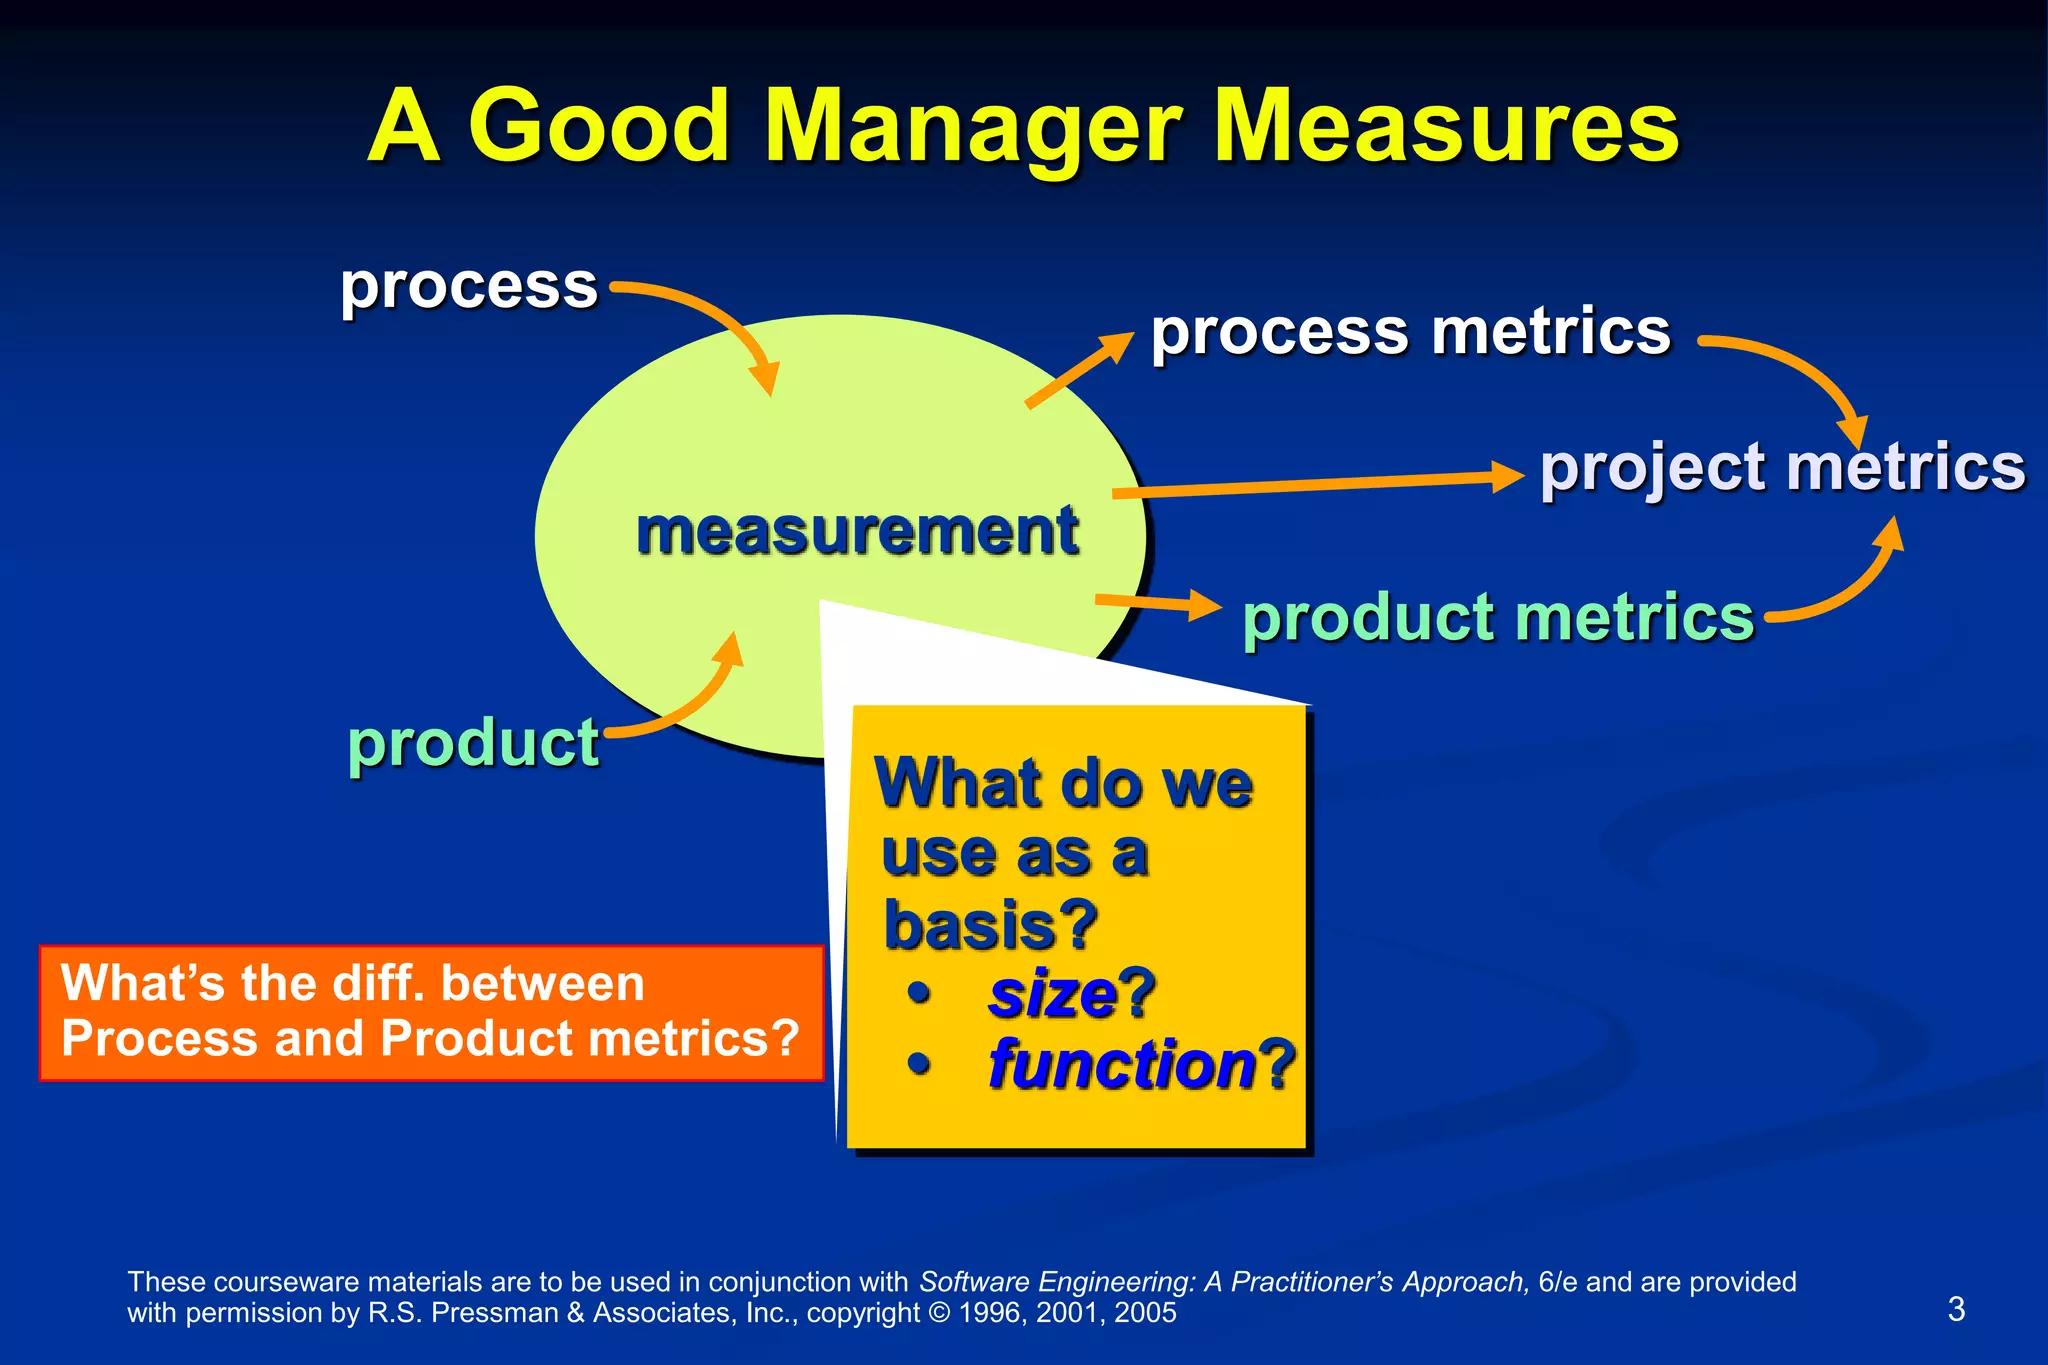
Measures, Metrics
A measure provides a quantitative indication of the extent, amount,
dimension, capacity, or size of some attribute of a product or process
The IEEE glossary defines a metric as “a quantitative measure of the
degree to which a system, component, or process possesses a given
attribute.”
Software measurement
(Sommerville; http://www.utdallas.edu/~chung/SE3354Honors/IEEInaugural.pdf)
• Measurement of products or systems is absolutely fundamental to
the engineering process.
• I am convinced that measurement as practised in other engineering
disciplines is IMPOSSIBLE for software engineering
Can you quantify user-friendliness, security, evolvability, …?
Not everything that can be counted counts, and not everything that counts can be counted.
[Albert Einstein]](https://image.slidesharecdn.com/ch15-22-231-230719063209-466ef180/75/Ch15-22-23-1-ppt-4-2048.jpg)


![These courseware materials are to be used in conjunction with Software Engineering: A Practitioner’s Approach, 6/e and are provided
with permission by R.S. Pressman & Associates, Inc., copyright © 1996, 2001, 2005 7
Function-Based Metrics
The function point metric (FP), first proposed by Albrecht [ALB79], can be used
effectively(?) as a means for measuring the functionality
delivered by a system.
FPs are derived using an empirical relationship based on
countable (direct) measures of software's information domain
and assessments of software complexity
Information domain values are defined in the following
manner:](https://image.slidesharecdn.com/ch15-22-231-230719063209-466ef180/75/Ch15-22-23-1-ppt-7-2048.jpg)


![These courseware materials are to be used in conjunction with Software Engineering: A Practitioner’s Approach, 6/e and are provided
with permission by R.S. Pressman & Associates, Inc., copyright © 1996, 2001, 2005 11
Example: FP Approach
FPestimated = count-total * [0.65 + 0.01 * Sum (Fi)] --- p442 adjustment factors
= 320 * [0.65 + 0.01 * 52] = 374
Historical data:
• organizational average productivity = 6.5 FP/pm.
• labor rate = $8000 pm, cost per FP = ?.
Based on the FP estimate and the historical productivity data,
• total estimated project cost = 374/6.5 * 8000 = $461,000
• estimated effort = 374/6.5 = 58 person-months.
Information
Domain Value Count simple average complex
Weighting factor
External Inputs ( EIs)
External Outputs ( EOs)
External Inquiries ( EQs)
Internal Logical Files ( ILFs)
External Interface Files ( EIFs)
3 4 6
4 5 7
3 4 6
7 10 15
5 7 10
=
=
=
=
=
Count total
3
3
3
3
3
See safehome example
x
x
x
x
x
320
(e.g., factor in reliability, performance, reusability, complexity, …)
A CAD application](https://image.slidesharecdn.com/ch15-22-231-230719063209-466ef180/75/Ch15-22-23-1-ppt-11-2048.jpg)

![These courseware materials are to be used in conjunction with Software Engineering: A Practitioner’s Approach, 6/e and are provided
with permission by R.S. Pressman & Associates, Inc., copyright © 1996, 2001, 2005 15
Class-Oriented Metrics
methods per class
depth of the inheritance tree
number of children
coupling between object classes
Proposed by Chidamber and Kemerer:
class size
number of operations overridden by a subclass
number of operations added by a subclass
Proposed by Lorenz and Kidd [LOR94]:
average number of parameters per operation
Can you depict these in UML?](https://image.slidesharecdn.com/ch15-22-231-230719063209-466ef180/75/Ch15-22-23-1-ppt-15-2048.jpg)
![These courseware materials are to be used in conjunction with Software Engineering: A Practitioner’s Approach, 6/e and are provided
with permission by R.S. Pressman & Associates, Inc., copyright © 1996, 2001, 2005 16
Measurement Principles
The objectives of measurement should be established before data collection begins;
Each technical metric should be defined in an unambiguous manner;
Metrics should be derived based on a theory that is valid for the domain of application
Metrics should be tailored to best accommodate specific products and processes
[BAS84]
How do you define technical metric unambiguously?](https://image.slidesharecdn.com/ch15-22-231-230719063209-466ef180/75/Ch15-22-23-1-ppt-16-2048.jpg)


![These courseware materials are to be used in conjunction with Software Engineering: A Practitioner’s Approach, 6/e and are provided
with permission by R.S. Pressman & Associates, Inc., copyright © 1996, 2001, 2005 43
Metrics for OO Design
Whitmire [WHI97] describes nine distinct and measurable characteristics of an OO design:
Size
Size is defined in terms of four views: population, volume, length, and functionality
Complexity
How classes of an OO design are interrelated to one another
Coupling
The physical connections between elements of the OO design
Sufficiency
“the degree to which an abstraction possesses the features required of it, or the degree to which a design
component possesses features in its abstraction, from the point of view of the current application.”
Completeness
An indirect implication about the degree to which the abstraction or design component can be reused
Cohesion
The degree to which all operations working together to achieve a single, well-defined purpose
Primitiveness
Applied to both operations and classes, the degree to which an operation is atomic
Similarity
The degree to which two or more classes are similar in terms of their structure, function, behavior,
or purpose
Volatility
Measures the likelihood that a change will occur](https://image.slidesharecdn.com/ch15-22-231-230719063209-466ef180/75/Ch15-22-23-1-ppt-43-2048.jpg)


![These courseware materials are to be used in conjunction with Software Engineering: A Practitioner’s Approach, 6/e and are provided
with permission by R.S. Pressman & Associates, Inc., copyright © 1996, 2001, 2005 46
The Software Equation
A dynamic multivariable model
E = [LOC x B0.333/P]3 x (1/t4)
where
E = effort in person-months or person-years
t = project duration in months or years
B = “special skills factor”
P = “productivity parameter” (typical value for developing real-time embedded sw = 2000;
telecom = 10000; business application = 28000)
“derived from productivity data collected for over 4000
contemporary software projects”](https://image.slidesharecdn.com/ch15-22-231-230719063209-466ef180/75/Ch15-22-23-1-ppt-46-2048.jpg)