Download to read offline


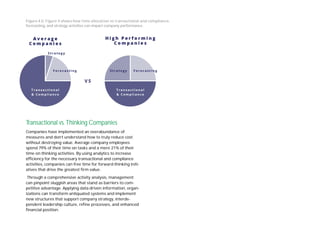


![Attracting people into the industry
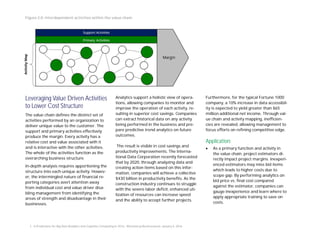
One of the most consistent and prevalent factors affecting the construction indus-
try today is the availability of skilled labor. In an industry based on cyclical work,
finding young skilled labor has becoming an increasing issue as evidenced by Fig-
ure 5. Based on BOL census data, the average age of a construction worker has
increased from 36 years in 1985 to 43 years in 2015 with the average age of 45+
currently accounting for 44% of the labor market, compared to just 27% 30 years
ago.1
In order to attract millennials, coined the “digital generation,” construction compa-
nies must be able to technologically compete with peers. According to a study
from the CMO Council and Executive Networks, 61% of companies have begun to
implement modern brand platforms to attract millennials including interactive and
real-time recruiting tactics.2
In addition to branding, companies are implementing
digital technology and analytics into their operations, capitalizing on millennial’s
new and broad skill set.3
Millennials are 2.5 times more likely to be early adopters
of technology than older generations. As millennials seek and rely on technology,
offering a culture of analytics will attract and retain more laborers.4
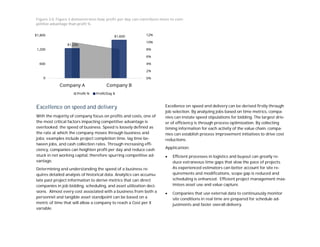
Turning Around a Labor Force
The construction industry not only struggles to attract and
retain skilled workers, but also to manage productivity lev-
els of its current labor force. As demonstrated in Figure 6,
construction labor productivity has lagged significantly
compared to non-farm business labor productivity as re-
sult of lagging adoption of technology and analytics.
Though approximately 73% of companies will have invest-
ed in big data analytics by the end of 2016, a mere 6% of
construction professionals were familiar with the concept
of big data.5
The key to success lies not only in the indus-
try’s ability to recruit new workers, but also to heighten
the efficiency of current resources.
1. US. Bureau of Labor Statistics, Nonfarm Business Sector: Real Output Per Hour of All Persons [OPHNFB], retrieved from FRED, Federal Reserve Bank of St. Louis; https://fred.stlouisfed.org/series/OPHNFB,
June 21, 2016.
2. Lauren Brousell, “Attracting Millennials Starts with Digital Tech,” CIO, July 2, 2015.
3. Shaping the Future of Construction: A Breakthrough in Mindset and Technology,” World Economic Forum, May 2016.
4. “The Millennial Generation Research Review,,” U.S. Chamber of Commerce Foundation, 2009.
5. “Sage Construction and Real Estate: Information Technology Trends,” Sage, 2015.
Figure 6.0: U.S. Labor Productivity Index
Figure 5.0: The increase in average age of construction
employees over the last 30 years.](https://image.slidesharecdn.com/05fb6d7b-d12c-43e4-a412-6741d074fa0b-160707220453/85/CG-1595-Analytic-Brochure-Final-12-320.jpg)

![Looking Ahead
In the years to come, investing in analytics will become less
of an option and more of a pre-requisite to gaining a com-
petitive advantage. As profit erosion threatens construc-
tion, companies must begin to address internal challenges,
namely the lack of innovation and delayed adoption, re-
sulting in production decline, lack of recruiting appeal, and
process inefficiency.
Through alignment of strategy and analytics, companies
can optimize operations. By reviving the traditional busi-
ness model, construction companies will become more
forward-looking, adaptive, and competitive. According to
the World Economic Forum, “The [construction] industry is
ripe for and capable of transformation.”1
It is now up to the
leaders to initiate the positive change for lasting impact.
1. . “Shaping the Future of Construction: A Breakthrough in Mindset and Technology,” World Economic Forum, May 2016.](https://image.slidesharecdn.com/05fb6d7b-d12c-43e4-a412-6741d074fa0b-160707220453/85/CG-1595-Analytic-Brochure-Final-14-320.jpg)


The document discusses how construction companies can leverage analytics to gain competitive advantage in the growing construction industry. It argues that analytics can help companies optimize their market focus and position, lower costs by analyzing activities in their value chain, and improve speed and delivery. Companies that adopt analytics will be well positioned to capture more profitable market share and revenue as the construction industry expands in value.


