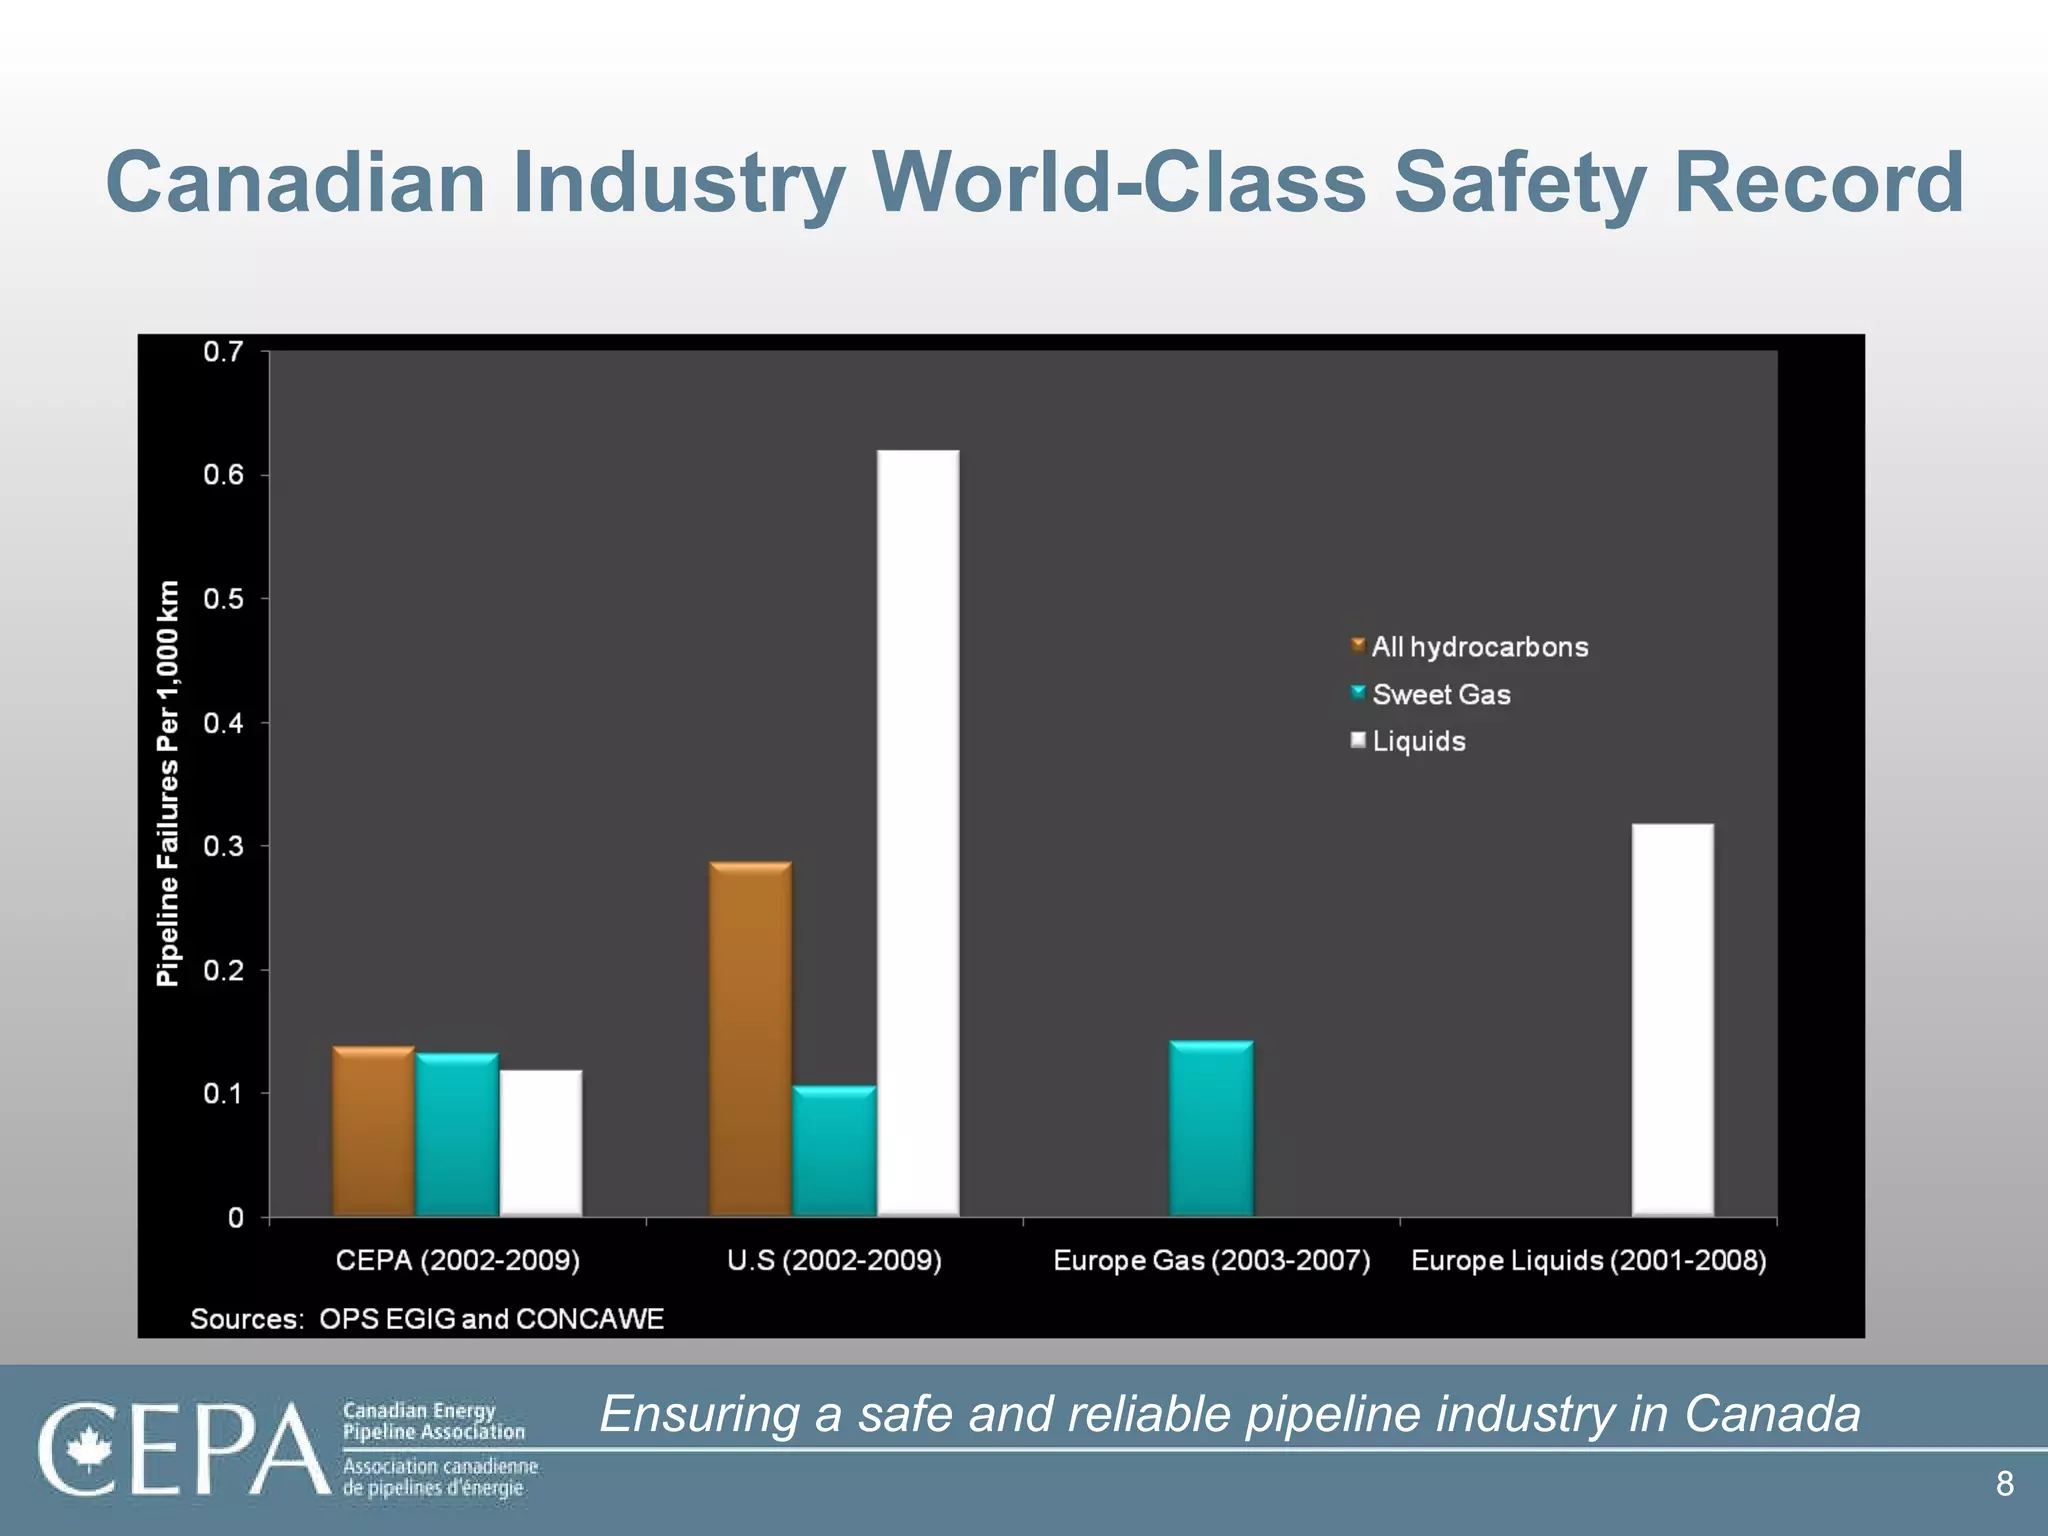
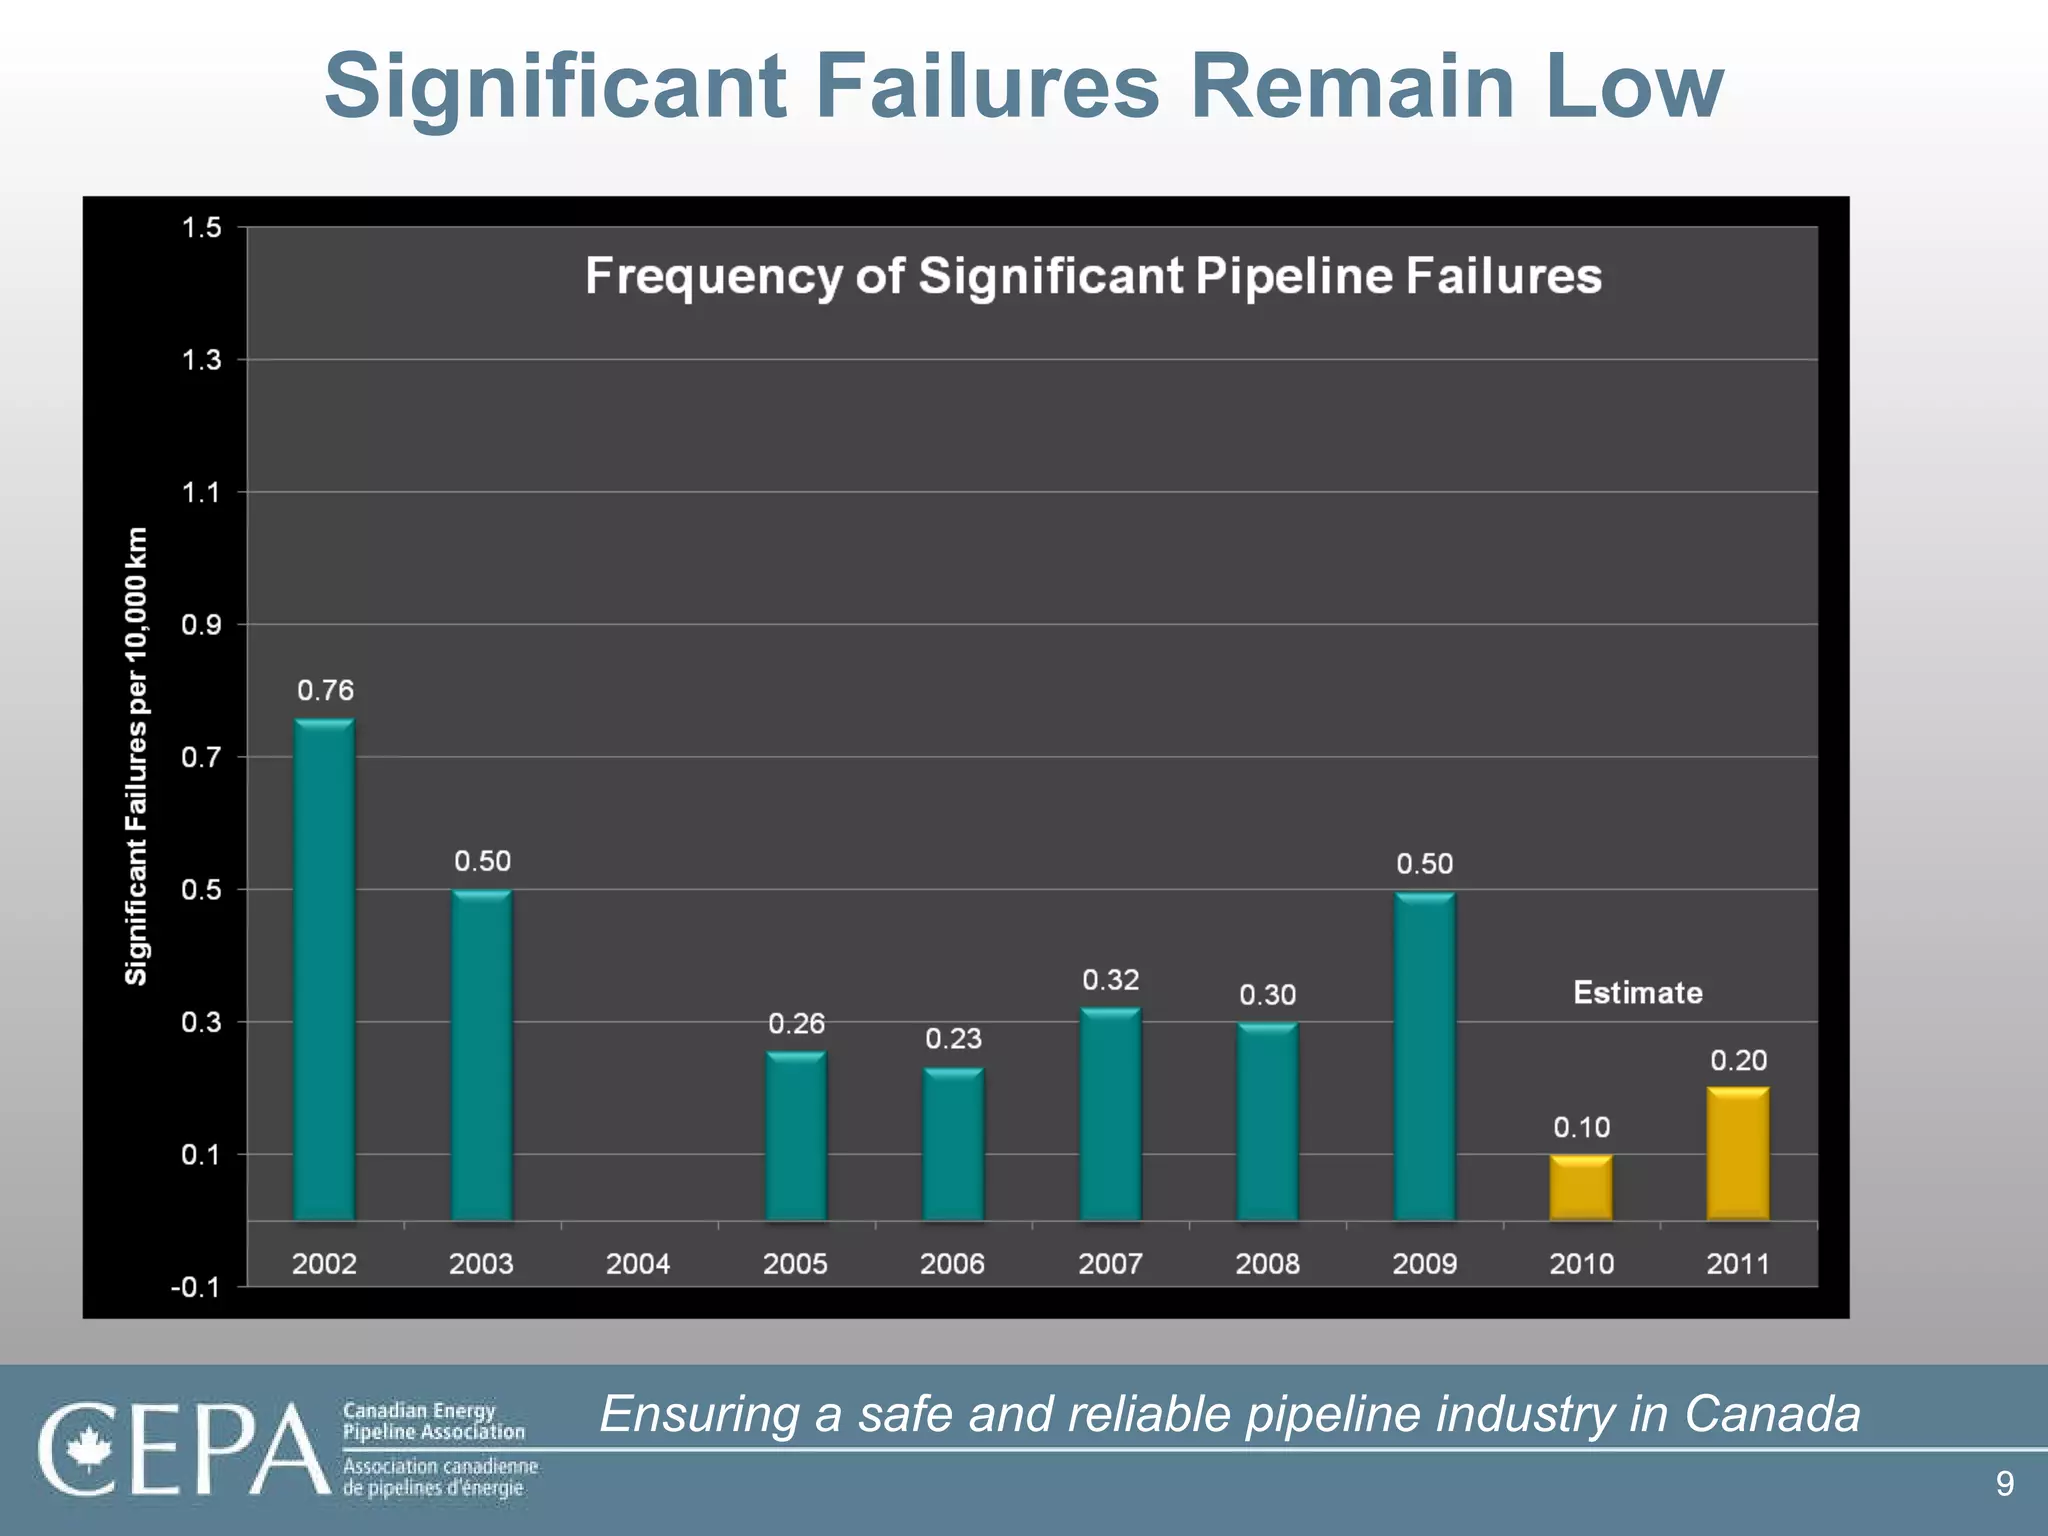
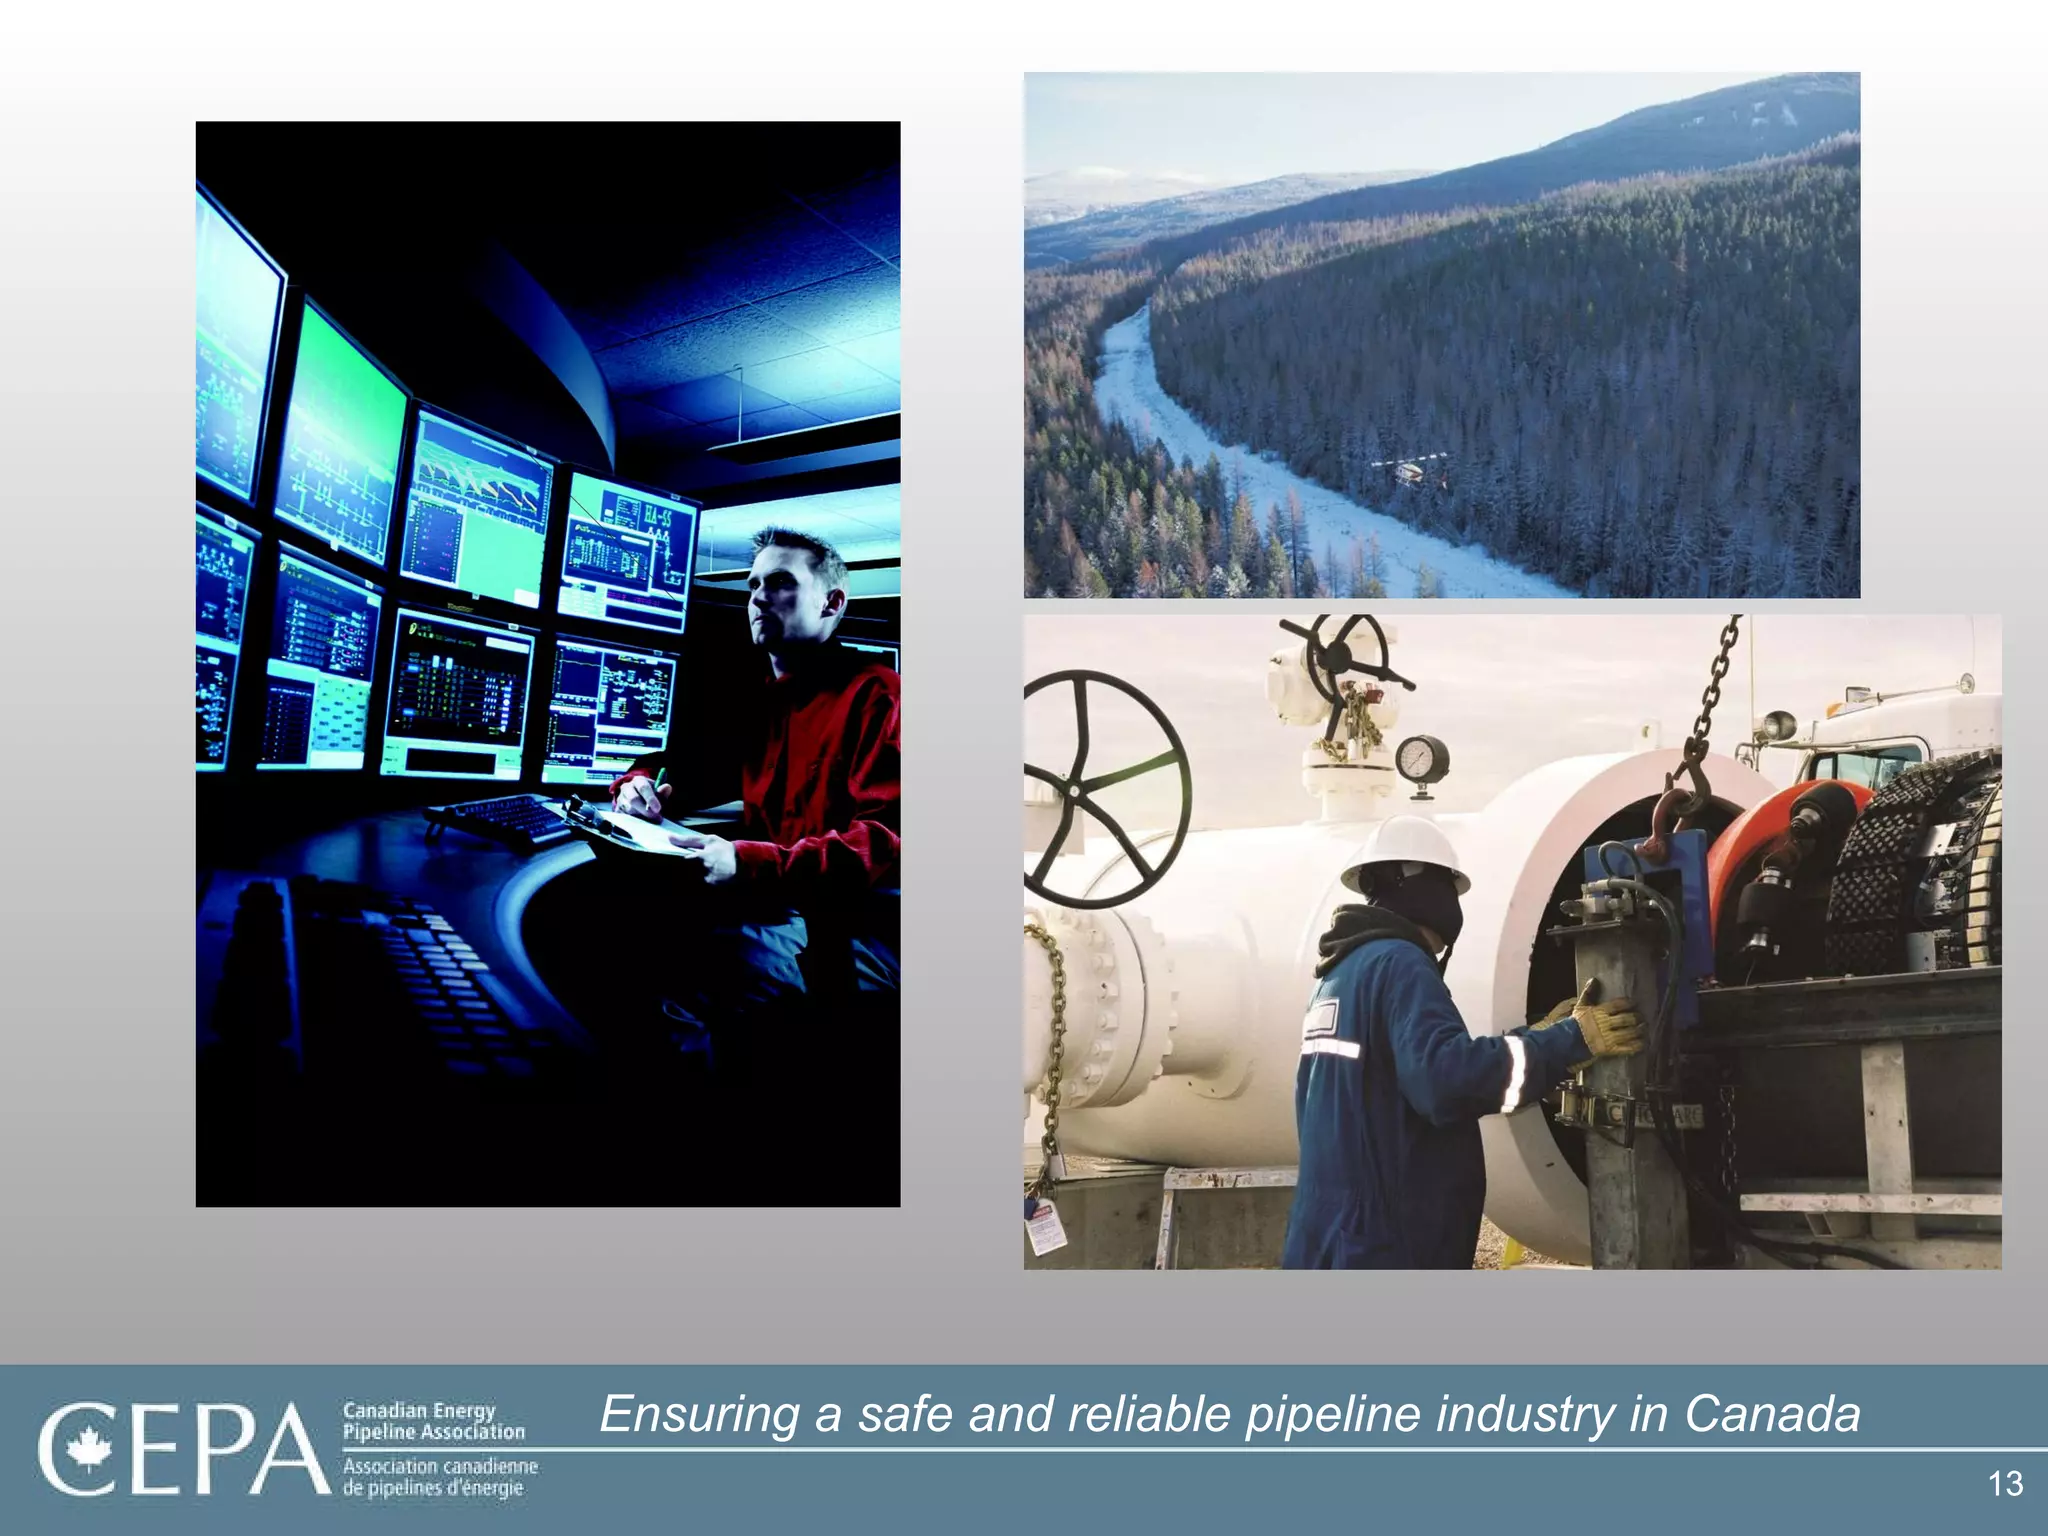
21. 2009 Canadian Crude Oil and Equivalent Supply and Disposition (Thousand Barrels/Day) 78.6 218.9 PADD II PADD III PADD V PADD IV PADD I 30.2 1945.4 2,725.8 23.9 1.9 276.7 15.0 1167.3 252.8 51.5 68.6 372.9 365.4 106.2 47.7 417.0 179.2 BC AB SK MB ON Norman Wells Hibernia/Terra Nova Sable Canadian Production Source: NEB, EIA 3,214 622 3,672 8,440 1,723 2,696.4 Delivery of Canadian Production 809 Imports into Canada 2,034 Canadian Refining Capacity 432.7 QC NB/NL/NS/PE 503.8 536.4 476.7 128.3 450.3 66.6 Legend 91.8 31.4 13.8 Source: NEB October 2010 40.2
22. Pipelines: Delivering a Safe Source of Energy to the United States Source: US Dept. of Energy
23. Source: NEB 2009 Canadian Natural Gas Disposition – Distribution by Market (Billion Cubic Feet/Day) 14.8 Canadian Production 1.8 Delivery of Canadian Production 1.9 Imports into Canada Legend HENRY HUB October 2010 AECO HUB Prudhoe Bay Anchorage Norman Wells Whitehorse Prince Rupert Kitimat Prince George Taylor Rainbow Lake Zama Fort McMurray Lloydminster Edmonton Hardisty Sundre Kerrobert Cutbank Great Falls Kamloops Vancouver Anacortes Olympia Portland Seattle Spokane Empress Regina Winnipeg Cromer Gretna Mandan Clearbrook Thunder Bay Superior St. Paul Lockport Chicago Moosonee Timmins Sudbury North Bay Ottawa Montreal Quebec City St. John Halifax Port Hawkesbury St. John ’ s Portland Boston Philadelphia Warren Oakville Sarnia Nanticoke Detroit Toledo Canton Lima Catlettsburg Memphis Patoka Robinson Wood River McPherson El Dorado Ponca City Cushing Borger Tulsa Coffeyville Wynnewood Colorado City Tyler El Dorado New Orleans St. James Corpus Christi Three Rivers Freeport Houston Port Arthur Lake Charles Longview Big Spring Artesia El Paso Billings Casper Salt Lake City Sinclair Cheyenne Denver Guernsey/ Ft. Laramie Long Beach Los Angeles Torrance Bakersfield Santa Maria Avon San Francisco Sunray Western Canada 14.8 Total Canadian Consumption 7.8 East Coast Offshore 0.4 Imports From US 1.9 0.8 1.8 1.3 1.5 0.5 Oil Sands 1.2 1.3 1.0 0.2 Other US Export Points 0.6
30. For more information please contact: Philippe Reicher Vice President, Communications & Stakeholder Relations Canadian Energy Pipeline Association Suite 1860, 205 - 5th Avenue S.W. Calgary, Alberta T2P 2V7 Tel: (403) 221-8778 www.cepa.com
Editor's Notes
This chart shows CEPA’s eight year average failure rate (per 1,000 km pipeline) compared to that in the US and Europe Clearly the safety-record of the Canadian pipeline industry compares very favourably to that in other jurisdictions For the eight year period (02-09), the number of pipeline failures in Canada was 52% lower than it was in the US This chart shows all failures – if we were to look at significant failures only, CEPA failure rate was 69.7% lower than in the US (CEPA 0.036 vs. OPS 0.119 ) BACKGROUND INFORMATION CEPA Significant Criteria Caused serious injury or fatality Caused a liquid release > 50 US barrels Produced unintentional ignition or fire Occurred as a rupture OPS Criteria 2) HVL release of 5 barrels or other liquid release of 50 barrels
DEFINITION OF FAILURES Caused serious injury or fatality Caused a liquid release of greater than 8m 3 (50 barrels) produced unintentional ignition or fire Occurred as a rupture
Safety culture Intentional, passionate and committed Examples of Alliance and Spectra
Three most common causes of pipeline failures metal loss (corrosion) (32%) Cracking (24%) Manufacturing, Material, Construction (16%) 65% of external interference are caused by third parties In US third party interference accounts for 16% of incidents but 31% of fatalities
Strong, transparent regulations and continuously improving
LNG export project not shown because not a member company initiative