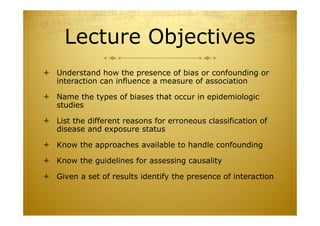
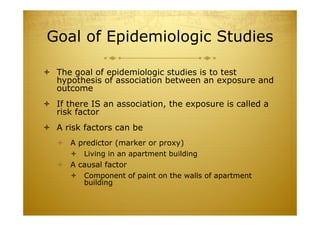
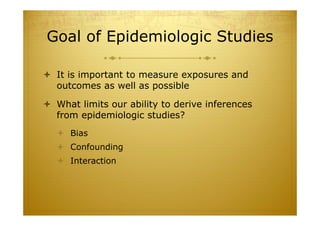
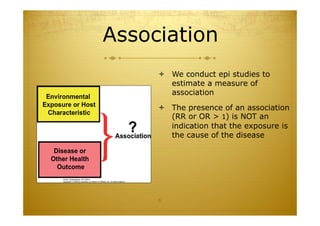
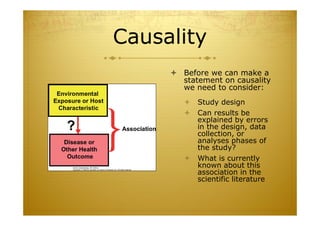
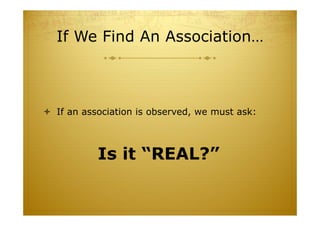
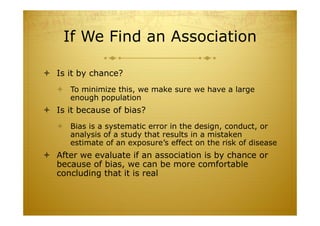
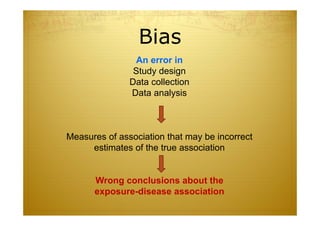
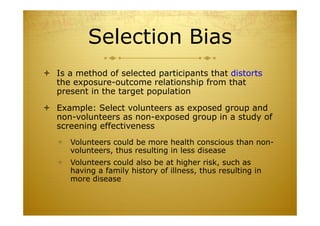
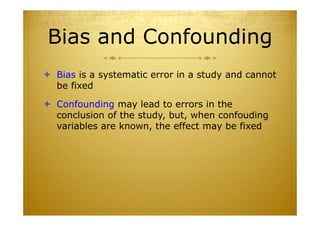
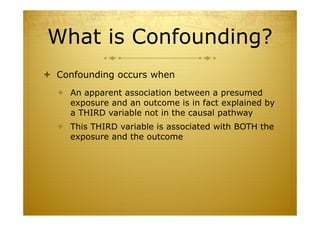
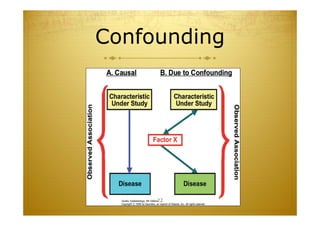
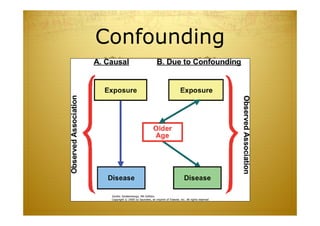
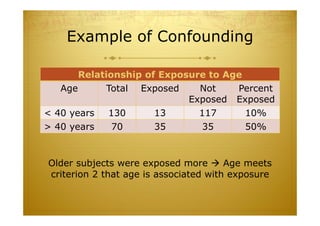
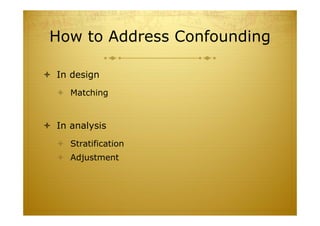
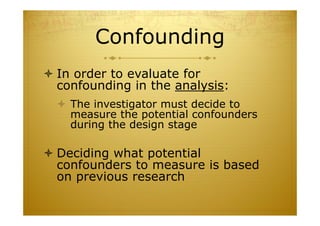
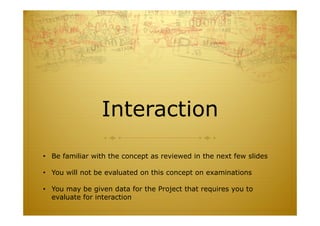
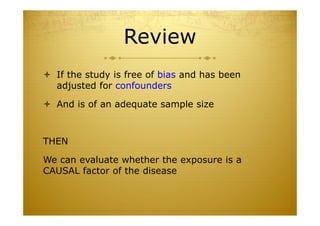
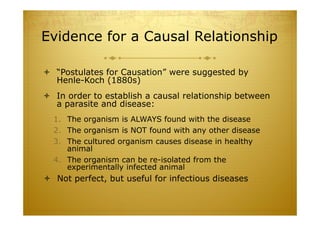
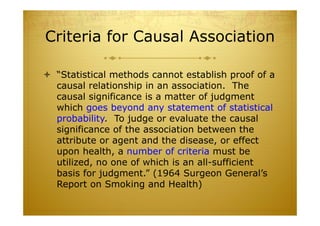
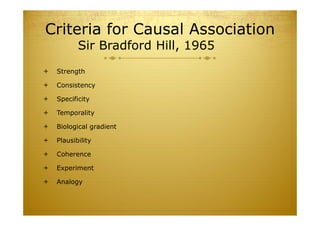
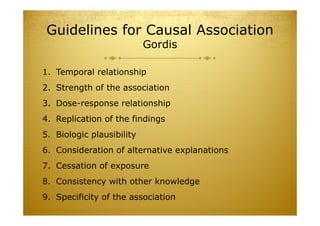
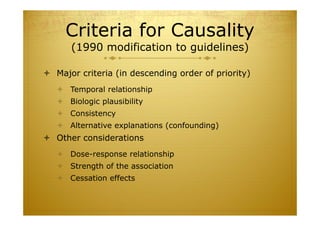
Causal Inference
Readings
 4th Edition
 Chapter 14, pp. 227-245
 Chapter 15, pp. 247-256 (not
responsible for section on Interaction)
 5th Edition
 Chapters 14, pp. 243-260
 Chapter 15, pp. 262-270 (not
responsible for section on Interaction)
Lecture Objectives
 Understand how the presence of bias or confounding or
interaction can influence a measure of association
 Name the types of biases that occur in epidemiologic
studies
 List the different reasons for erroneous classification of
disease and exposure status
 Know the approaches available to handle confounding
 Know the guidelines for assessing causality
 Given a set of results identify the presence of interaction
Goal of Epidemiologic Studies
 The goal of epidemiologic studies is to test
hypothesis of association between an exposure and
outcome
 If there IS an association, the exposure is called a
risk factor
 A risk factors can be
 A predictor (marker or proxy)
 Living in an apartment building
 A causal factor
 Component of paint on the walls of apartment
building
Goal of Epidemiologic Studies
 It is important to measure exposures and
outcomes as well as possible
 What limits our ability to derive inferences
from epidemiologic studies?
 Bias
 Confounding
 Interaction
Association
 We conduct epi studies to
estimate a measure of
association
 The presence of an association
(RR or OR > 1) is NOT an
indication that the exposure is
the cause of the disease
6
Causality
 Before we can make a
statement on causality
we need to consider:
 Study design
 Can results be
explained by errors
in the design, data
collection, or
analyses phases of
the study?
 What is currently
known about this
association in the
scientific literature
How Epidemiologic
Studies Fit In
Often begin with clinical
observations
Examine routinely available data
to identify statistical associations
Carry out new studies to demonstrate
specific associations and derive causal
inferences
Types of study design
Results of a randomized
trial are less likely to be
explained by errors than
those from a cohort or
case-control study
Not always possible,
however, to do a
randomized trial or even a
cohort study
Strongest evidence will be
from study design that
minimizes most errors9
Ecological Studies
 Unit of analysis is population or group, rather than
individual
 Example
 Level of flouride in water supply and dental caries by
city
 Study of dietary consumption of fiber and heart
disease by country
 Useful to give us idea of what is happening at a
population level, but cannot make conclusions
regarding individuals
Ecologic studies
 Easy and cheap (if data is available)
 Big problem is that we may ascribe to
members of a group characteristics
that they do not possess – ecologic
fallacy
 Useful to develop hypothesis but
never to address causality
If We Find An Association…
 If an association is observed, we must ask:
Is it “REAL?”
If We Find an Association
 Is it by chance?
 To minimize this, we make sure we have a large
enough population
 Is it because of bias?
 Bias is a systematic error in the design, conduct, or
analysis of a study that results in a mistaken
estimate of an exposure’s effect on the risk of disease
 After we evaluate if an association is by chance or
because of bias, we can be more comfortable
concluding that it is real
Bias
An error in
Study design
Data collection
Data analysis
Measures of association that may be incorrect
estimates of the true association
Wrong conclusions about the
exposure-disease association
Selection Bias
 Is a method of selected participants that distorts
the exposure-outcome relationship from that
present in the target population
 Example: Select volunteers as exposed group and
non-volunteers as non-exposed group in a study of
screening effectiveness
 Volunteers could be more health conscious than non-
volunteers, thus resulting in less disease
 Volunteers could also be at higher risk, such as
having a family history of illness, thus resulting in
more disease
Controlling Selection Bias
 Define criteria of selection of disease and non-
diseased participants independent of exposures
in a case-control study
 Define criteria of selection of exposed and non-
exposed participants independent of disease
outcomes in a cohort study
 Use randomized clinical trials
Information Bias
 Occurs when information is collected differently
between two groups, leading to an error in the
conclusion of the association
 Examples
 Interviewer knows the status of subjects before
the interview and probes cases and controls
differently about their exposures
 Subjects may recall past exposures better or in
more detail if he or she has the disease
Types of information bias
 Recall bias: People with a health condition
would be more likely to remember an exposure
 Interviewer bias: Interviewer who is aware of
case (or exposure) status may let expectations
influence how vigorously s/he probes for
information
 Surveillance bias: Occurs when one group is
followed more closely than another group
Controlling Information Bias
 Have a standardized protocol for data collection
 Make sure sources and methods for data
collection are similar for all study groups
 Make sure interviewers are NOT aware of
exposure/disease status
 Determine strategy to evaluate information
bias
Bias and Confounding
 Bias is a systematic error in a study and cannot
be fixed
 Confounding may lead to errors in the
conclusion of the study, but, when confouding
variables are known, the effect may be fixed
What is Confounding?
 Confounding occurs when
 An apparent association between a presumed
exposure and an outcome is in fact explained by
a THIRD variable not in the causal pathway
 This THIRD variable is associated with BOTH the
exposure and the outcome
Confounding
22
Confounding
Example of Confounding
(from Chapter 15)
 Study of 100 cases and 100 controls in an
unmatched case-control study
 30% of cases and 18% of the controls were
exposed
 Measure of association = Odds ratio = 1.95
 Could age be a confounder?
Example of Confounding
Exposed Cases Controls
Yes 30 18
No 70 82
Total 100 100
Odds Ratio = 30 x 82 = 1.95
70 x 18
Example of Confounding
 If age is a confounder, then
 Age must be a risk factor for the disease
AND
 Age must be associated with the exposure
AND
 Age must NOT be in the causal pathway
Example of Confounding
Distribution of Cases and Controls by Age
Age Cases Controls
< 40 years 50 80
> 40 years 50 20
Total 100 100
Cases were older  Age meets criterion 1 that is
that age is a risk factor for the disease
Example of Confounding
Older subjects were exposed more  Age meets
criterion 2 that age is associated with exposure
Relationship of Exposure to Age
Age Total Exposed Not
Exposed
Percent
Exposed
< 40 years 130 13 117 10%
> 40 years 70 35 35 50%
We conclude that age is a
confounder
How to Address Confounding
 In design
 Matching
 In analysis
 Stratification
 Adjustment
Confounding
 In order to evaluate for
confounding in the analysis:
 The investigator must decide to
measure the potential confounders
during the design stage
 Deciding what potential
confounders to measure is based
on previous research
Interaction
• Be familiar with the concept as reviewed in the next few slides
• You will not be evaluated on this concept on examinations
• You may be given data for the Project that requires you to
evaluate for interaction
What is Interaction?
 Interaction involves two risk factors
 If the effect of one risk factor is the same
within strata defined by the other risk factor,
then there is no interaction
 When the effect of one risk factor is different
within strata defined by the other, then there is
interaction
 Also known as effect modification
 Is there an association?
 If so, is it due to confounding?
 Is there an association equally strong in strata
formed on the basis of a third variable
Is there Interaction?
NO YES
Interaction
Present
Interaction
Not Present
Risks of Liver Cancer for
Persons Exposed to Aflatoxin or
Chronic Hepatitis B Infection
Aflatoxin
Negative
Aflatoxin
Positive
Hepatitis B Negative 1.0 3.4
Hepatitis B Positive 7.3 59.4
• Hepatitis infection increases risk to 7.3
• Aflatoxin exposure only increases risk to 3.4
• If BOTH, your risk is 59.4 which is more than the combination of
the two effects (either adding them or multiplying them)
Confounding versus Interaction
 Confounding is a nuisance
 It is a distortion of exposure groups
 We generally wish to tease out confounding
effects
 Effect modification is of interest
 If the effect of the exposure is different
between two groups, then it is of interest to
report this information rather than teasing it
out
Review
 If the study is free of bias and has been
adjusted for confounders
 And is of an adequate sample size
THEN
We can evaluate whether the exposure is a
CAUSAL factor of the disease
Evidence for a Causal Relationship
 “Postulates for Causation” were suggested by
Henle-Koch (1880s)
 In order to establish a causal relationship between
a parasite and disease:
1. The organism is ALWAYS found with the disease
2. The organism is NOT found with any other disease
3. The cultured organism causes disease in healthy
animal
4. The organism can be re-isolated from the
experimentally infected animal
 Not perfect, but useful for infectious diseases
Criteria for Causal Association
 “Statistical methods cannot establish proof of a
causal relationship in an association. The
causal significance is a matter of judgment
which goes beyond any statement of statistical
probability. To judge or evaluate the causal
significance of the association between the
attribute or agent and the disease, or effect
upon health, a number of criteria must be
utilized, no one of which is an all-sufficient
basis for judgment.” (1964 Surgeon General’s
Report on Smoking and Health)
Criteria for Causal Association
Sir Bradford Hill, 1965
 Strength
 Consistency
 Specificity
 Temporality
 Biological gradient
 Plausibility
 Coherence
 Experiment
 Analogy
Guidelines for Causal Association
Gordis
1. Temporal relationship
2. Strength of the association
3. Dose-response relationship
4. Replication of the findings
5. Biologic plausibility
6. Consideration of alternative explanations
7. Cessation of exposure
8. Consistency with other knowledge
9. Specificity of the association
See book for more details and
examples of each of these
guidelines
Criteria for Causality
(1990 modification to guidelines)
 Major criteria (in descending order of priority)
 Temporal relationship
 Biologic plausibility
 Consistency
 Alternative explanations (confounding)
 Other considerations
 Dose-response relationship
 Strength of the association
 Cessation effects
Use of Guidelines
 There is a great deal of judgment used in
determining causality
 Also, there is always going to be new evidence
that accumulates to support or dispute our
current understanding

Causal Inference PowerPoint

  • 1.
  • 2.
    Readings  4th Edition Chapter 14, pp. 227-245  Chapter 15, pp. 247-256 (not responsible for section on Interaction)  5th Edition  Chapters 14, pp. 243-260  Chapter 15, pp. 262-270 (not responsible for section on Interaction)
  • 3.
    Lecture Objectives  Understandhow the presence of bias or confounding or interaction can influence a measure of association  Name the types of biases that occur in epidemiologic studies  List the different reasons for erroneous classification of disease and exposure status  Know the approaches available to handle confounding  Know the guidelines for assessing causality  Given a set of results identify the presence of interaction
  • 4.
    Goal of EpidemiologicStudies  The goal of epidemiologic studies is to test hypothesis of association between an exposure and outcome  If there IS an association, the exposure is called a risk factor  A risk factors can be  A predictor (marker or proxy)  Living in an apartment building  A causal factor  Component of paint on the walls of apartment building
  • 5.
    Goal of EpidemiologicStudies  It is important to measure exposures and outcomes as well as possible  What limits our ability to derive inferences from epidemiologic studies?  Bias  Confounding  Interaction
  • 6.
    Association  We conductepi studies to estimate a measure of association  The presence of an association (RR or OR > 1) is NOT an indication that the exposure is the cause of the disease 6
  • 7.
    Causality  Before wecan make a statement on causality we need to consider:  Study design  Can results be explained by errors in the design, data collection, or analyses phases of the study?  What is currently known about this association in the scientific literature
  • 8.
    How Epidemiologic Studies FitIn Often begin with clinical observations Examine routinely available data to identify statistical associations Carry out new studies to demonstrate specific associations and derive causal inferences
  • 9.
    Types of studydesign Results of a randomized trial are less likely to be explained by errors than those from a cohort or case-control study Not always possible, however, to do a randomized trial or even a cohort study Strongest evidence will be from study design that minimizes most errors9
  • 10.
    Ecological Studies  Unitof analysis is population or group, rather than individual  Example  Level of flouride in water supply and dental caries by city  Study of dietary consumption of fiber and heart disease by country  Useful to give us idea of what is happening at a population level, but cannot make conclusions regarding individuals
  • 11.
    Ecologic studies  Easyand cheap (if data is available)  Big problem is that we may ascribe to members of a group characteristics that they do not possess – ecologic fallacy  Useful to develop hypothesis but never to address causality
  • 12.
    If We FindAn Association…  If an association is observed, we must ask: Is it “REAL?”
  • 13.
    If We Findan Association  Is it by chance?  To minimize this, we make sure we have a large enough population  Is it because of bias?  Bias is a systematic error in the design, conduct, or analysis of a study that results in a mistaken estimate of an exposure’s effect on the risk of disease  After we evaluate if an association is by chance or because of bias, we can be more comfortable concluding that it is real
  • 14.
    Bias An error in Studydesign Data collection Data analysis Measures of association that may be incorrect estimates of the true association Wrong conclusions about the exposure-disease association
  • 15.
    Selection Bias  Isa method of selected participants that distorts the exposure-outcome relationship from that present in the target population  Example: Select volunteers as exposed group and non-volunteers as non-exposed group in a study of screening effectiveness  Volunteers could be more health conscious than non- volunteers, thus resulting in less disease  Volunteers could also be at higher risk, such as having a family history of illness, thus resulting in more disease
  • 16.
    Controlling Selection Bias Define criteria of selection of disease and non- diseased participants independent of exposures in a case-control study  Define criteria of selection of exposed and non- exposed participants independent of disease outcomes in a cohort study  Use randomized clinical trials
  • 17.
    Information Bias  Occurswhen information is collected differently between two groups, leading to an error in the conclusion of the association  Examples  Interviewer knows the status of subjects before the interview and probes cases and controls differently about their exposures  Subjects may recall past exposures better or in more detail if he or she has the disease
  • 18.
    Types of informationbias  Recall bias: People with a health condition would be more likely to remember an exposure  Interviewer bias: Interviewer who is aware of case (or exposure) status may let expectations influence how vigorously s/he probes for information  Surveillance bias: Occurs when one group is followed more closely than another group
  • 19.
    Controlling Information Bias Have a standardized protocol for data collection  Make sure sources and methods for data collection are similar for all study groups  Make sure interviewers are NOT aware of exposure/disease status  Determine strategy to evaluate information bias
  • 20.
    Bias and Confounding Bias is a systematic error in a study and cannot be fixed  Confounding may lead to errors in the conclusion of the study, but, when confouding variables are known, the effect may be fixed
  • 21.
    What is Confounding? Confounding occurs when  An apparent association between a presumed exposure and an outcome is in fact explained by a THIRD variable not in the causal pathway  This THIRD variable is associated with BOTH the exposure and the outcome
  • 22.
  • 23.
  • 24.
    Example of Confounding (fromChapter 15)  Study of 100 cases and 100 controls in an unmatched case-control study  30% of cases and 18% of the controls were exposed  Measure of association = Odds ratio = 1.95  Could age be a confounder?
  • 25.
    Example of Confounding ExposedCases Controls Yes 30 18 No 70 82 Total 100 100 Odds Ratio = 30 x 82 = 1.95 70 x 18
  • 26.
    Example of Confounding If age is a confounder, then  Age must be a risk factor for the disease AND  Age must be associated with the exposure AND  Age must NOT be in the causal pathway
  • 27.
    Example of Confounding Distributionof Cases and Controls by Age Age Cases Controls < 40 years 50 80 > 40 years 50 20 Total 100 100 Cases were older  Age meets criterion 1 that is that age is a risk factor for the disease
  • 28.
    Example of Confounding Oldersubjects were exposed more  Age meets criterion 2 that age is associated with exposure Relationship of Exposure to Age Age Total Exposed Not Exposed Percent Exposed < 40 years 130 13 117 10% > 40 years 70 35 35 50%
  • 29.
    We conclude thatage is a confounder
  • 30.
    How to AddressConfounding  In design  Matching  In analysis  Stratification  Adjustment
  • 31.
    Confounding  In orderto evaluate for confounding in the analysis:  The investigator must decide to measure the potential confounders during the design stage  Deciding what potential confounders to measure is based on previous research
  • 32.
    Interaction • Be familiarwith the concept as reviewed in the next few slides • You will not be evaluated on this concept on examinations • You may be given data for the Project that requires you to evaluate for interaction
  • 33.
    What is Interaction? Interaction involves two risk factors  If the effect of one risk factor is the same within strata defined by the other risk factor, then there is no interaction  When the effect of one risk factor is different within strata defined by the other, then there is interaction  Also known as effect modification
  • 34.
     Is therean association?  If so, is it due to confounding?  Is there an association equally strong in strata formed on the basis of a third variable Is there Interaction? NO YES Interaction Present Interaction Not Present
  • 35.
    Risks of LiverCancer for Persons Exposed to Aflatoxin or Chronic Hepatitis B Infection Aflatoxin Negative Aflatoxin Positive Hepatitis B Negative 1.0 3.4 Hepatitis B Positive 7.3 59.4 • Hepatitis infection increases risk to 7.3 • Aflatoxin exposure only increases risk to 3.4 • If BOTH, your risk is 59.4 which is more than the combination of the two effects (either adding them or multiplying them)
  • 36.
    Confounding versus Interaction Confounding is a nuisance  It is a distortion of exposure groups  We generally wish to tease out confounding effects  Effect modification is of interest  If the effect of the exposure is different between two groups, then it is of interest to report this information rather than teasing it out
  • 37.
    Review  If thestudy is free of bias and has been adjusted for confounders  And is of an adequate sample size THEN We can evaluate whether the exposure is a CAUSAL factor of the disease
  • 38.
    Evidence for aCausal Relationship  “Postulates for Causation” were suggested by Henle-Koch (1880s)  In order to establish a causal relationship between a parasite and disease: 1. The organism is ALWAYS found with the disease 2. The organism is NOT found with any other disease 3. The cultured organism causes disease in healthy animal 4. The organism can be re-isolated from the experimentally infected animal  Not perfect, but useful for infectious diseases
  • 39.
    Criteria for CausalAssociation  “Statistical methods cannot establish proof of a causal relationship in an association. The causal significance is a matter of judgment which goes beyond any statement of statistical probability. To judge or evaluate the causal significance of the association between the attribute or agent and the disease, or effect upon health, a number of criteria must be utilized, no one of which is an all-sufficient basis for judgment.” (1964 Surgeon General’s Report on Smoking and Health)
  • 40.
    Criteria for CausalAssociation Sir Bradford Hill, 1965  Strength  Consistency  Specificity  Temporality  Biological gradient  Plausibility  Coherence  Experiment  Analogy
  • 41.
    Guidelines for CausalAssociation Gordis 1. Temporal relationship 2. Strength of the association 3. Dose-response relationship 4. Replication of the findings 5. Biologic plausibility 6. Consideration of alternative explanations 7. Cessation of exposure 8. Consistency with other knowledge 9. Specificity of the association
  • 42.
    See book formore details and examples of each of these guidelines
  • 43.
    Criteria for Causality (1990modification to guidelines)  Major criteria (in descending order of priority)  Temporal relationship  Biologic plausibility  Consistency  Alternative explanations (confounding)  Other considerations  Dose-response relationship  Strength of the association  Cessation effects
  • 44.
    Use of Guidelines There is a great deal of judgment used in determining causality  Also, there is always going to be new evidence that accumulates to support or dispute our current understanding