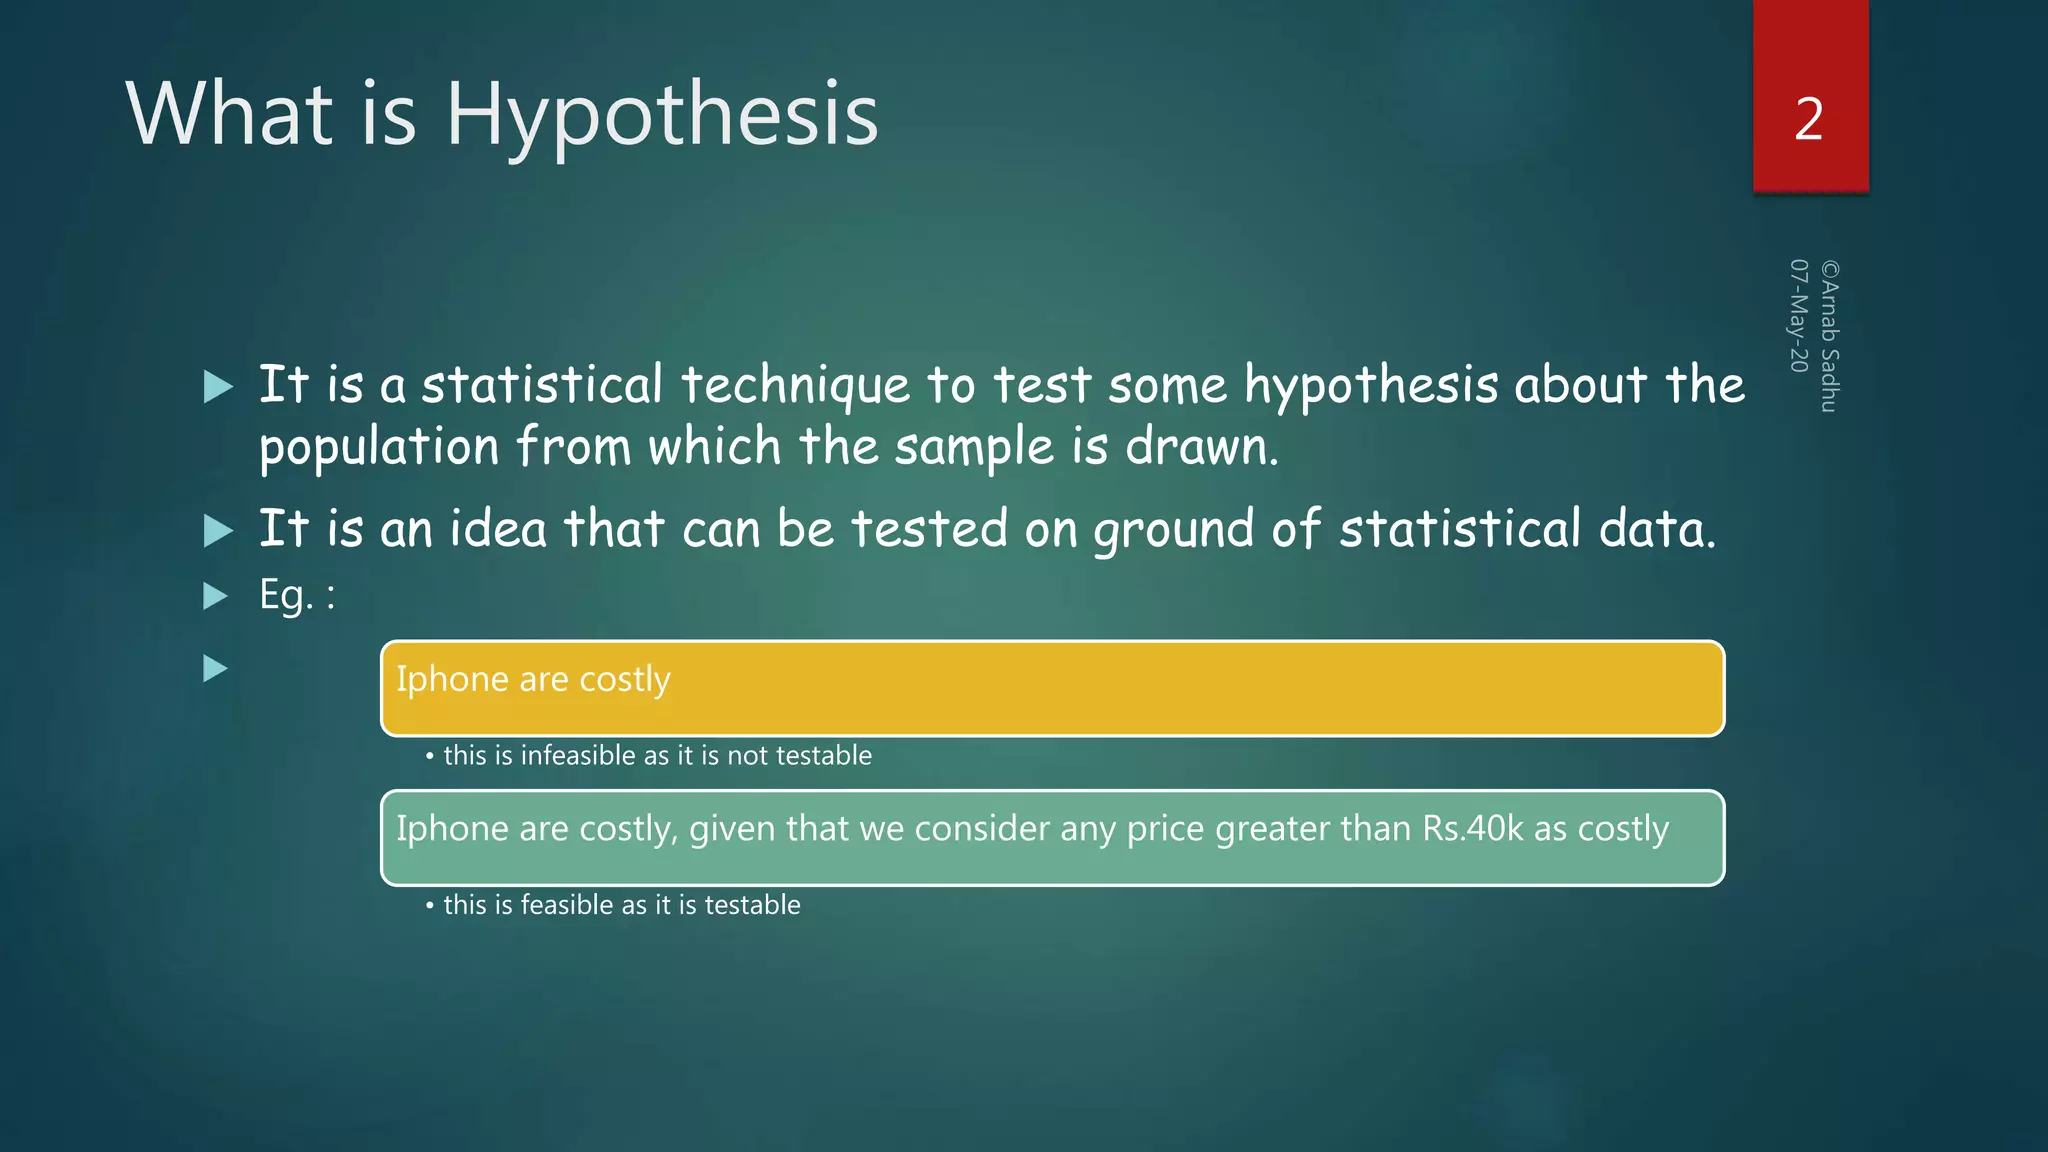
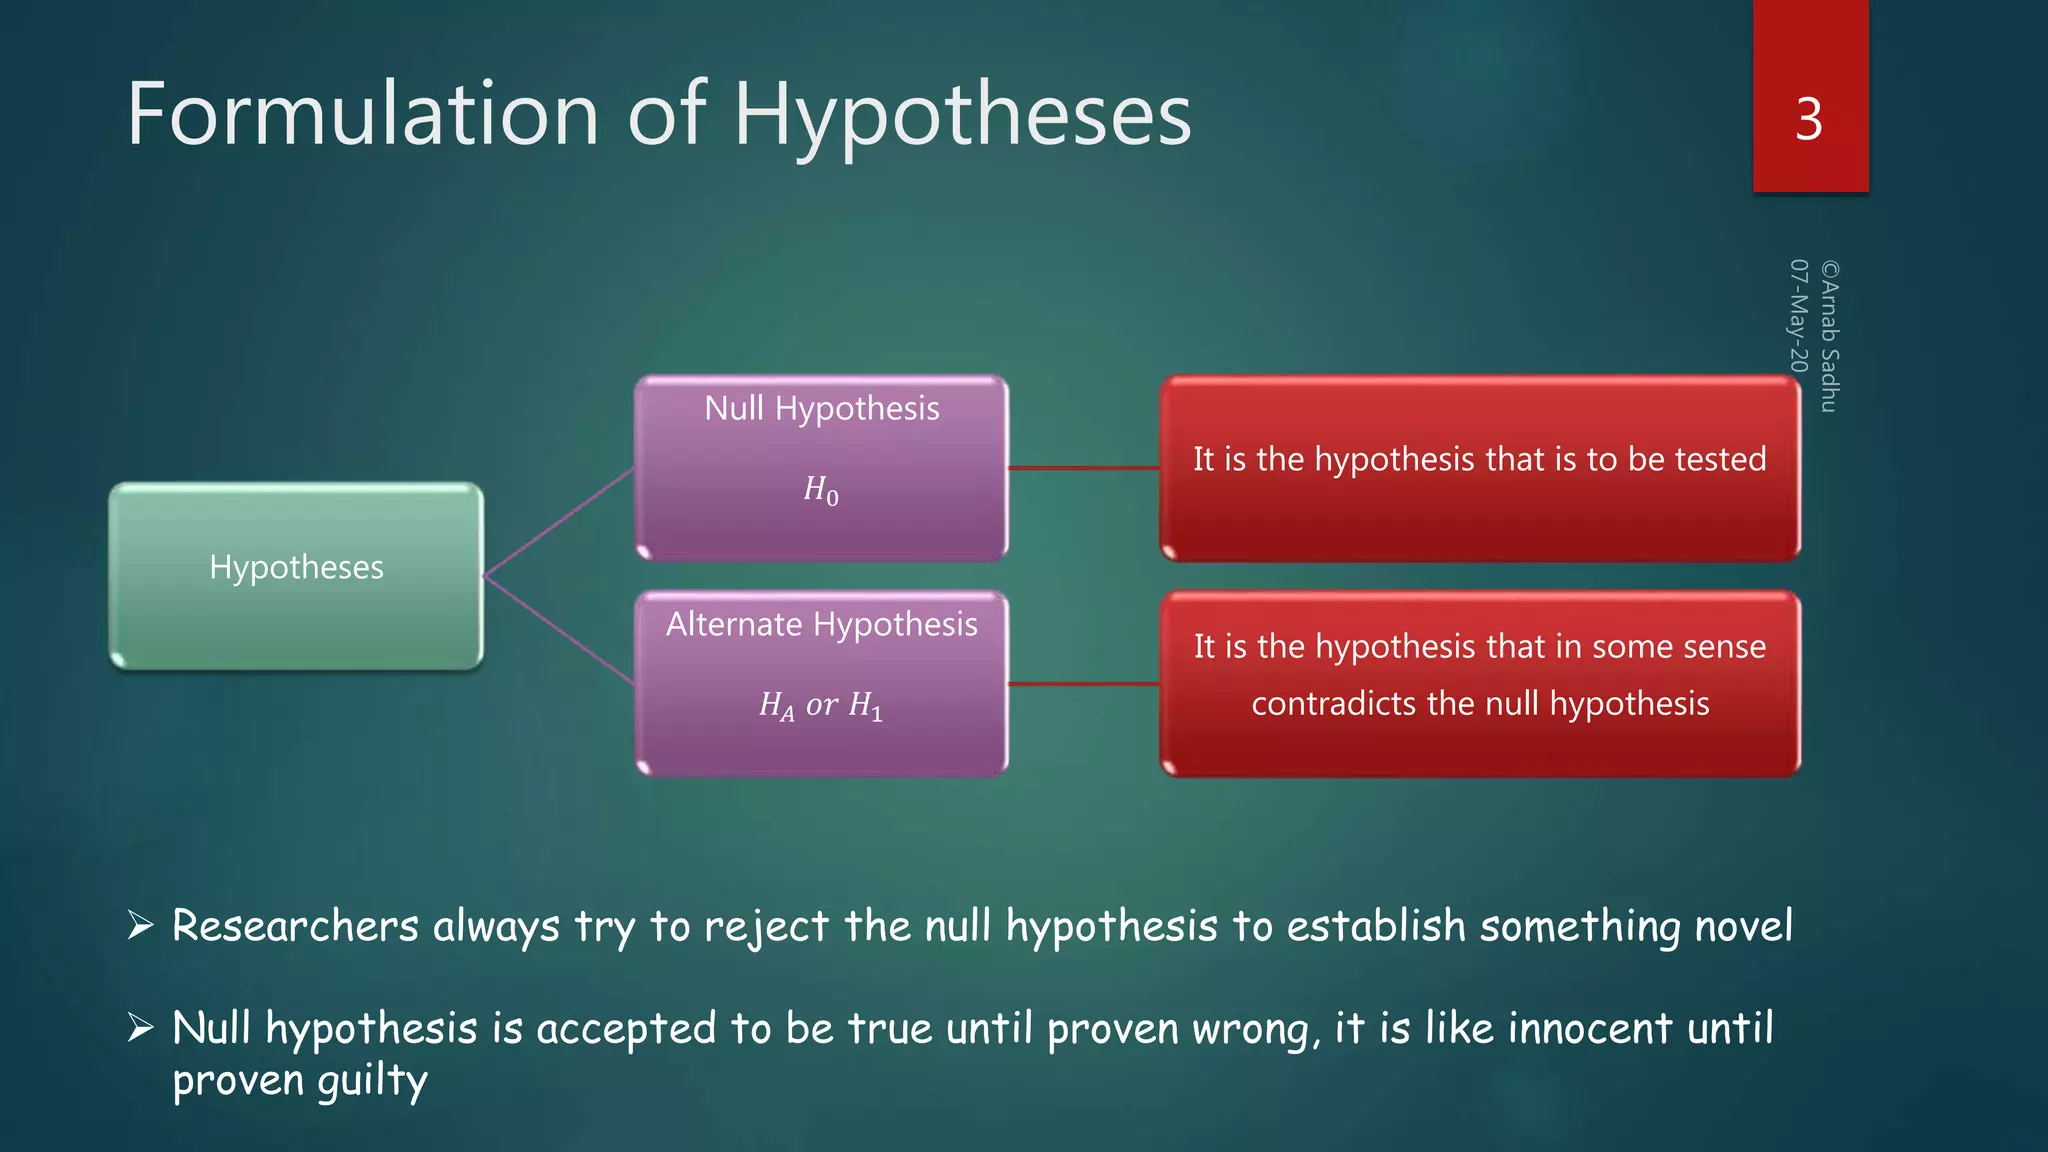
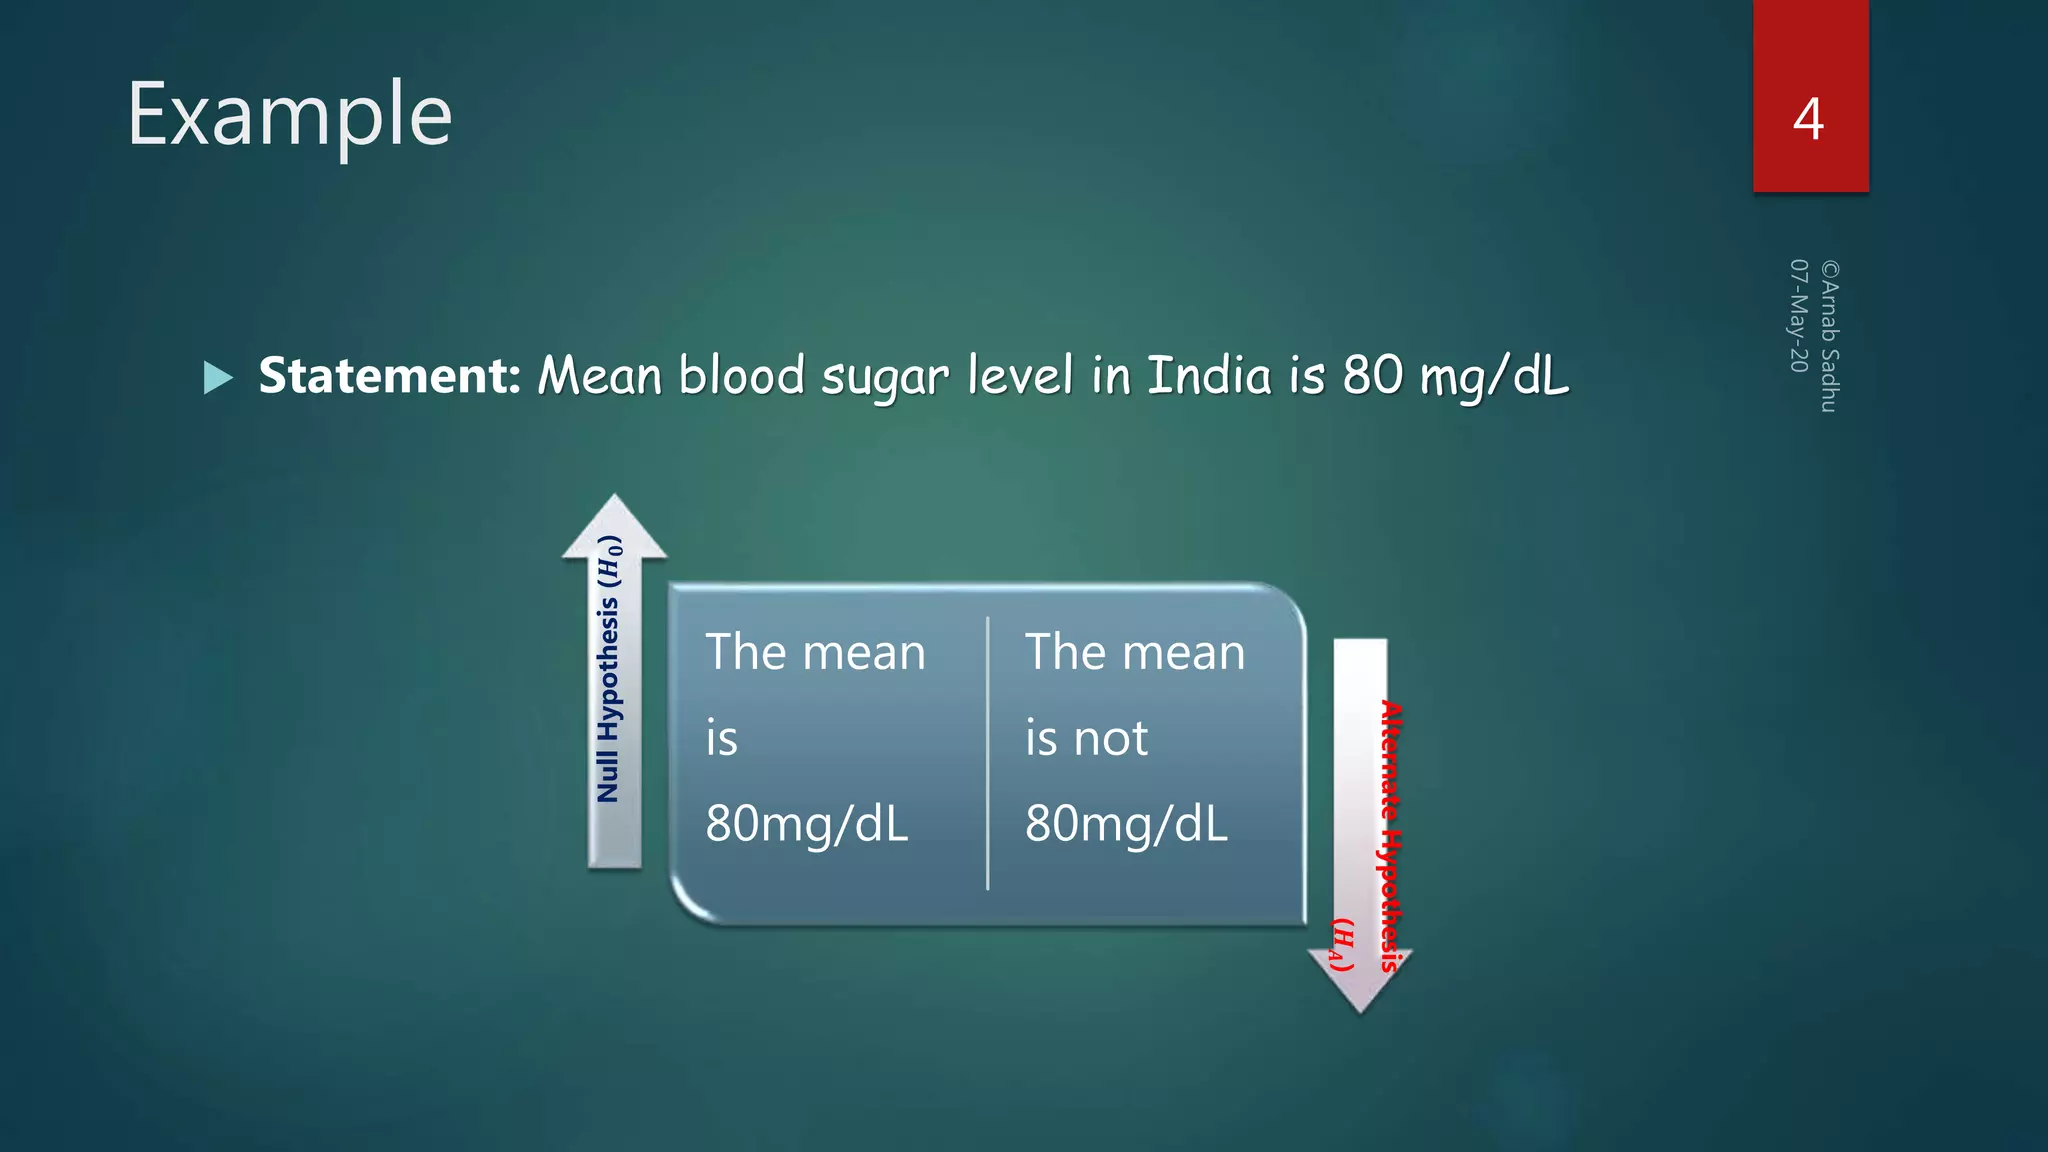
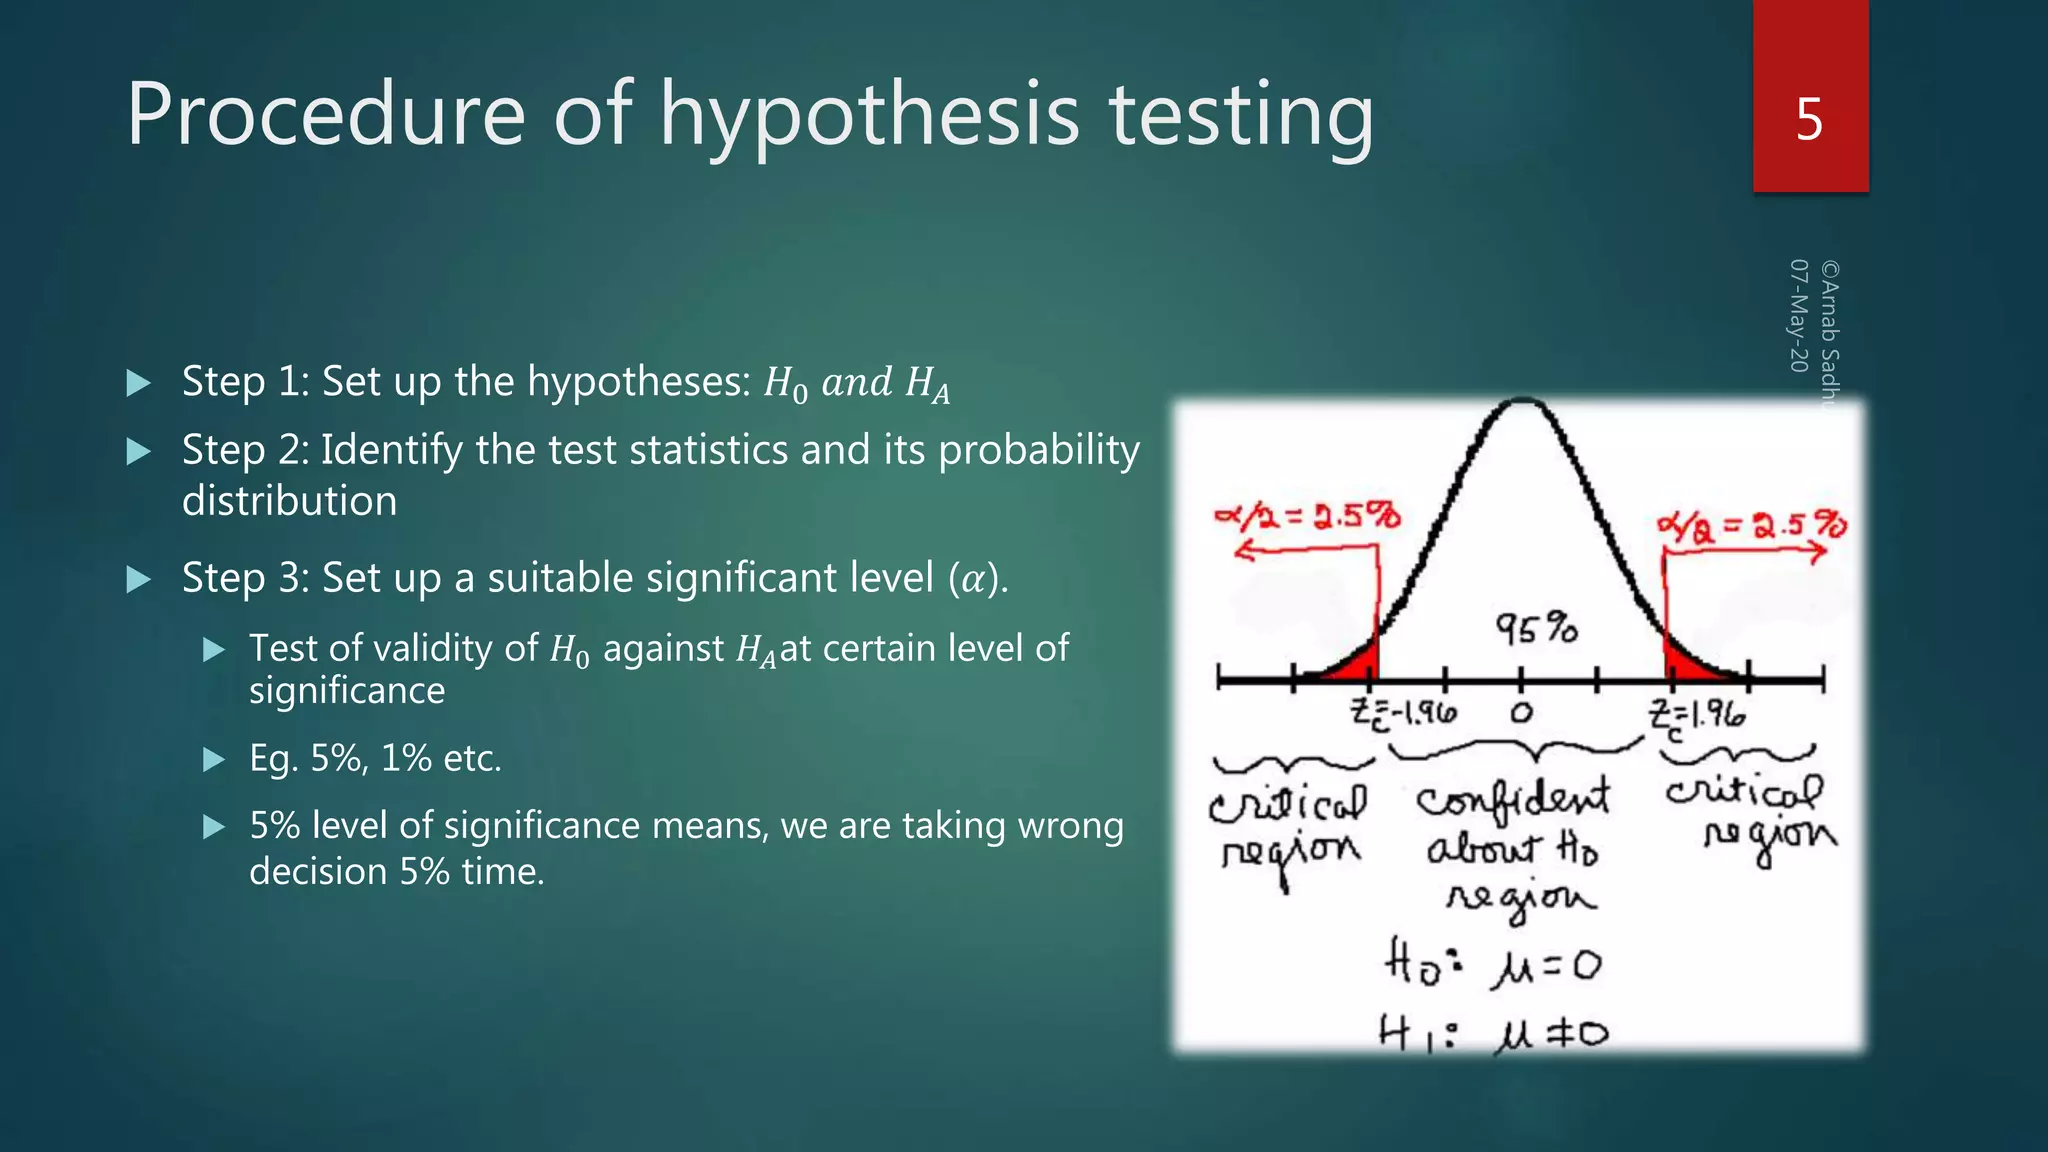
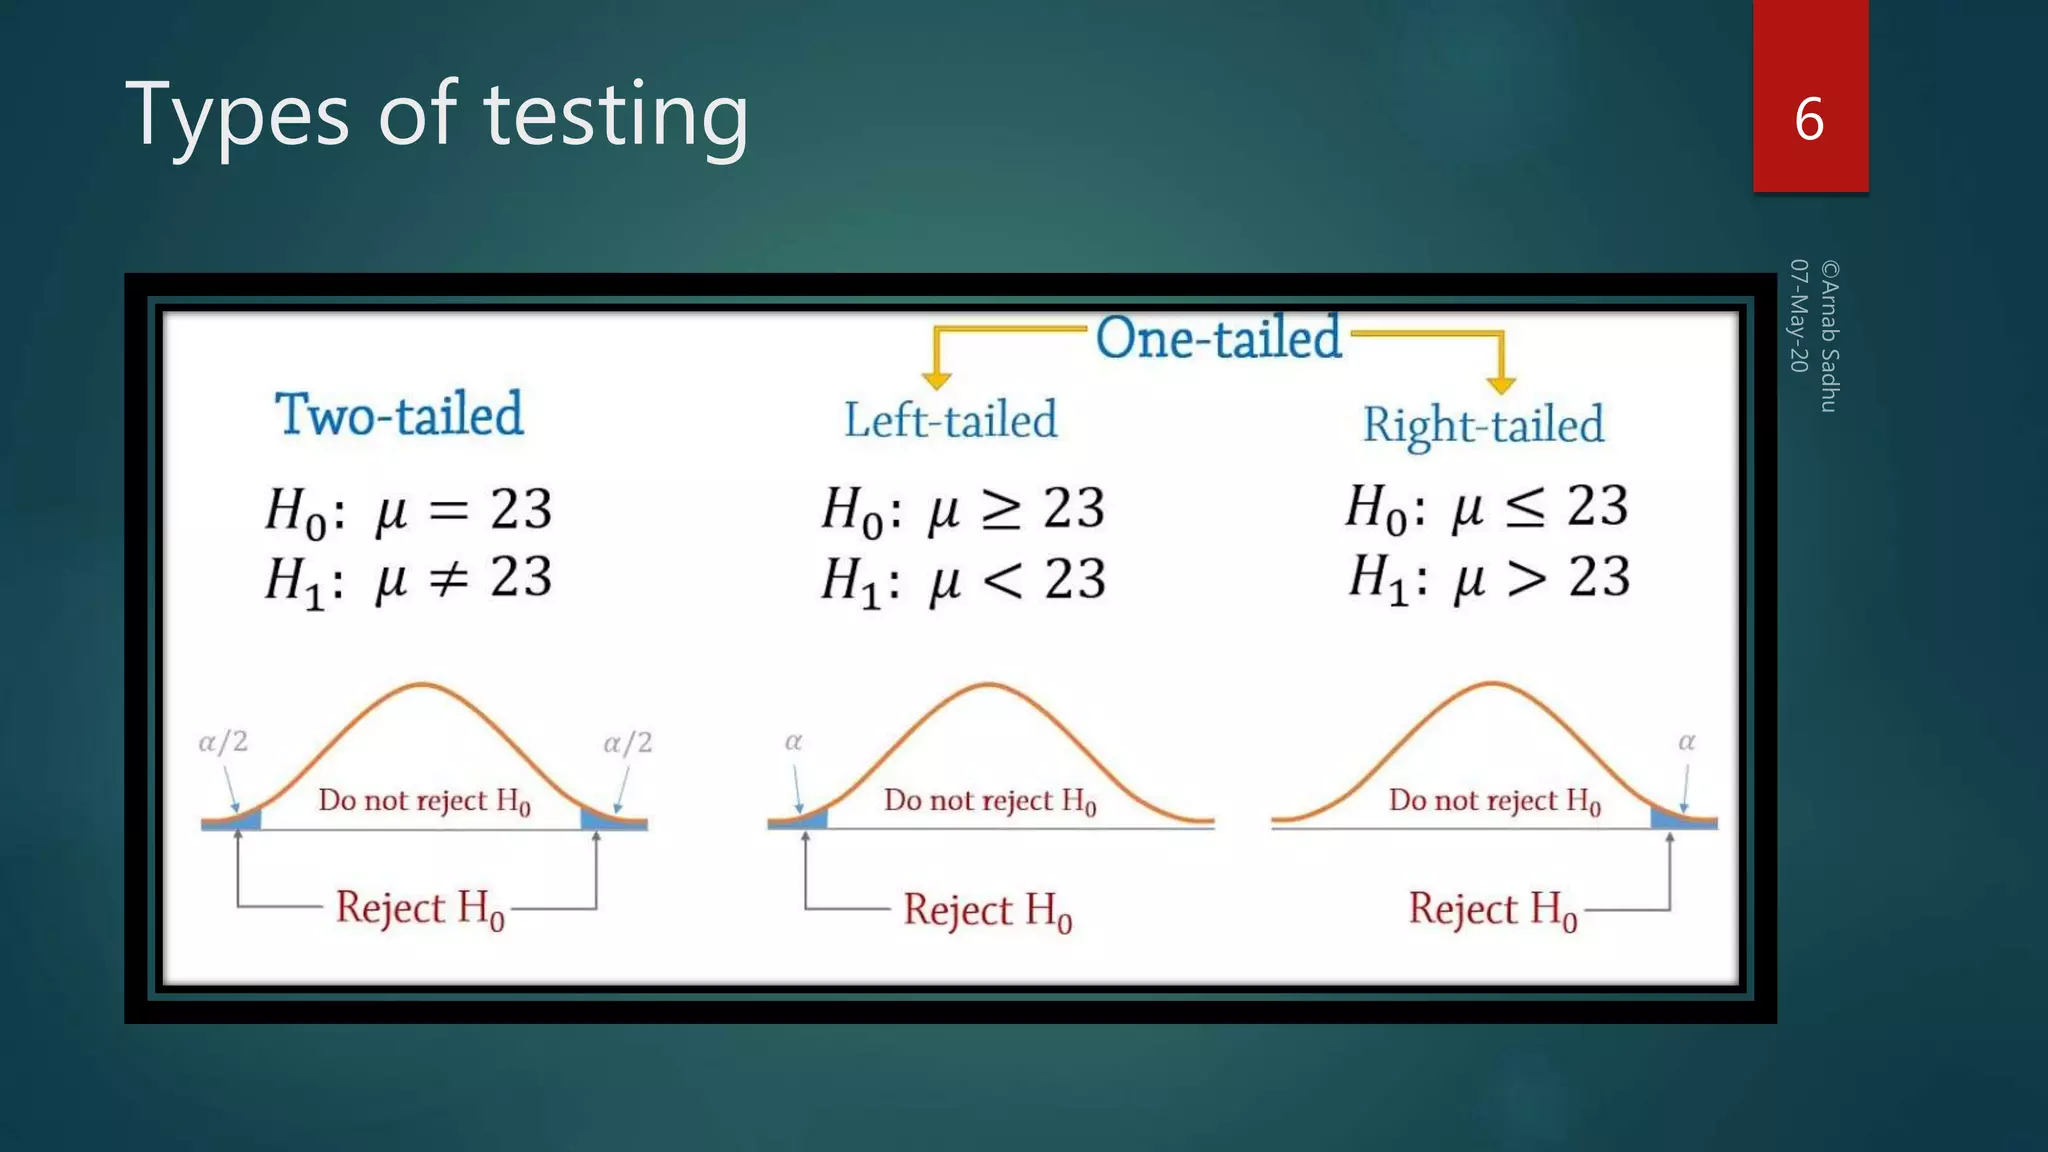
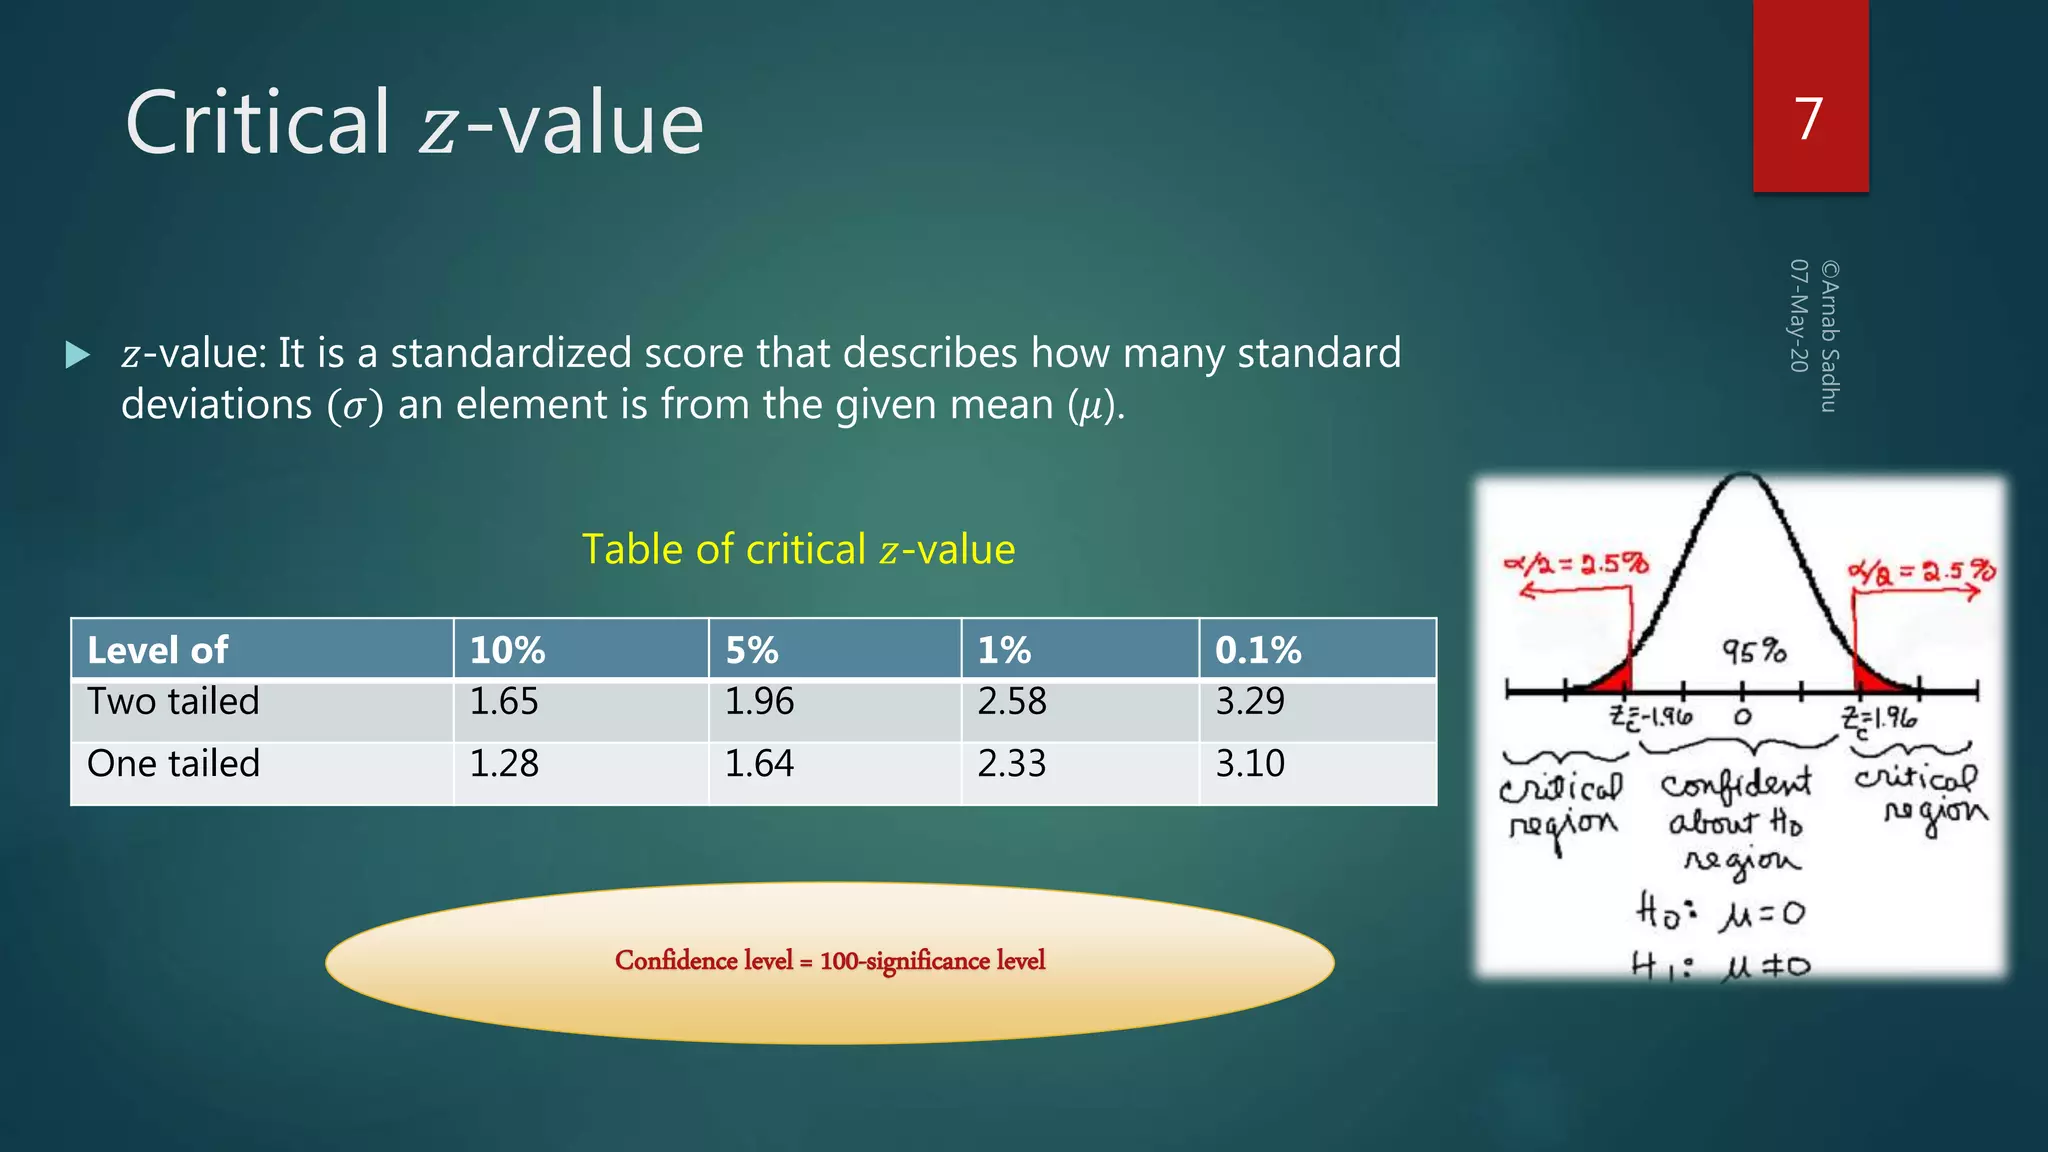
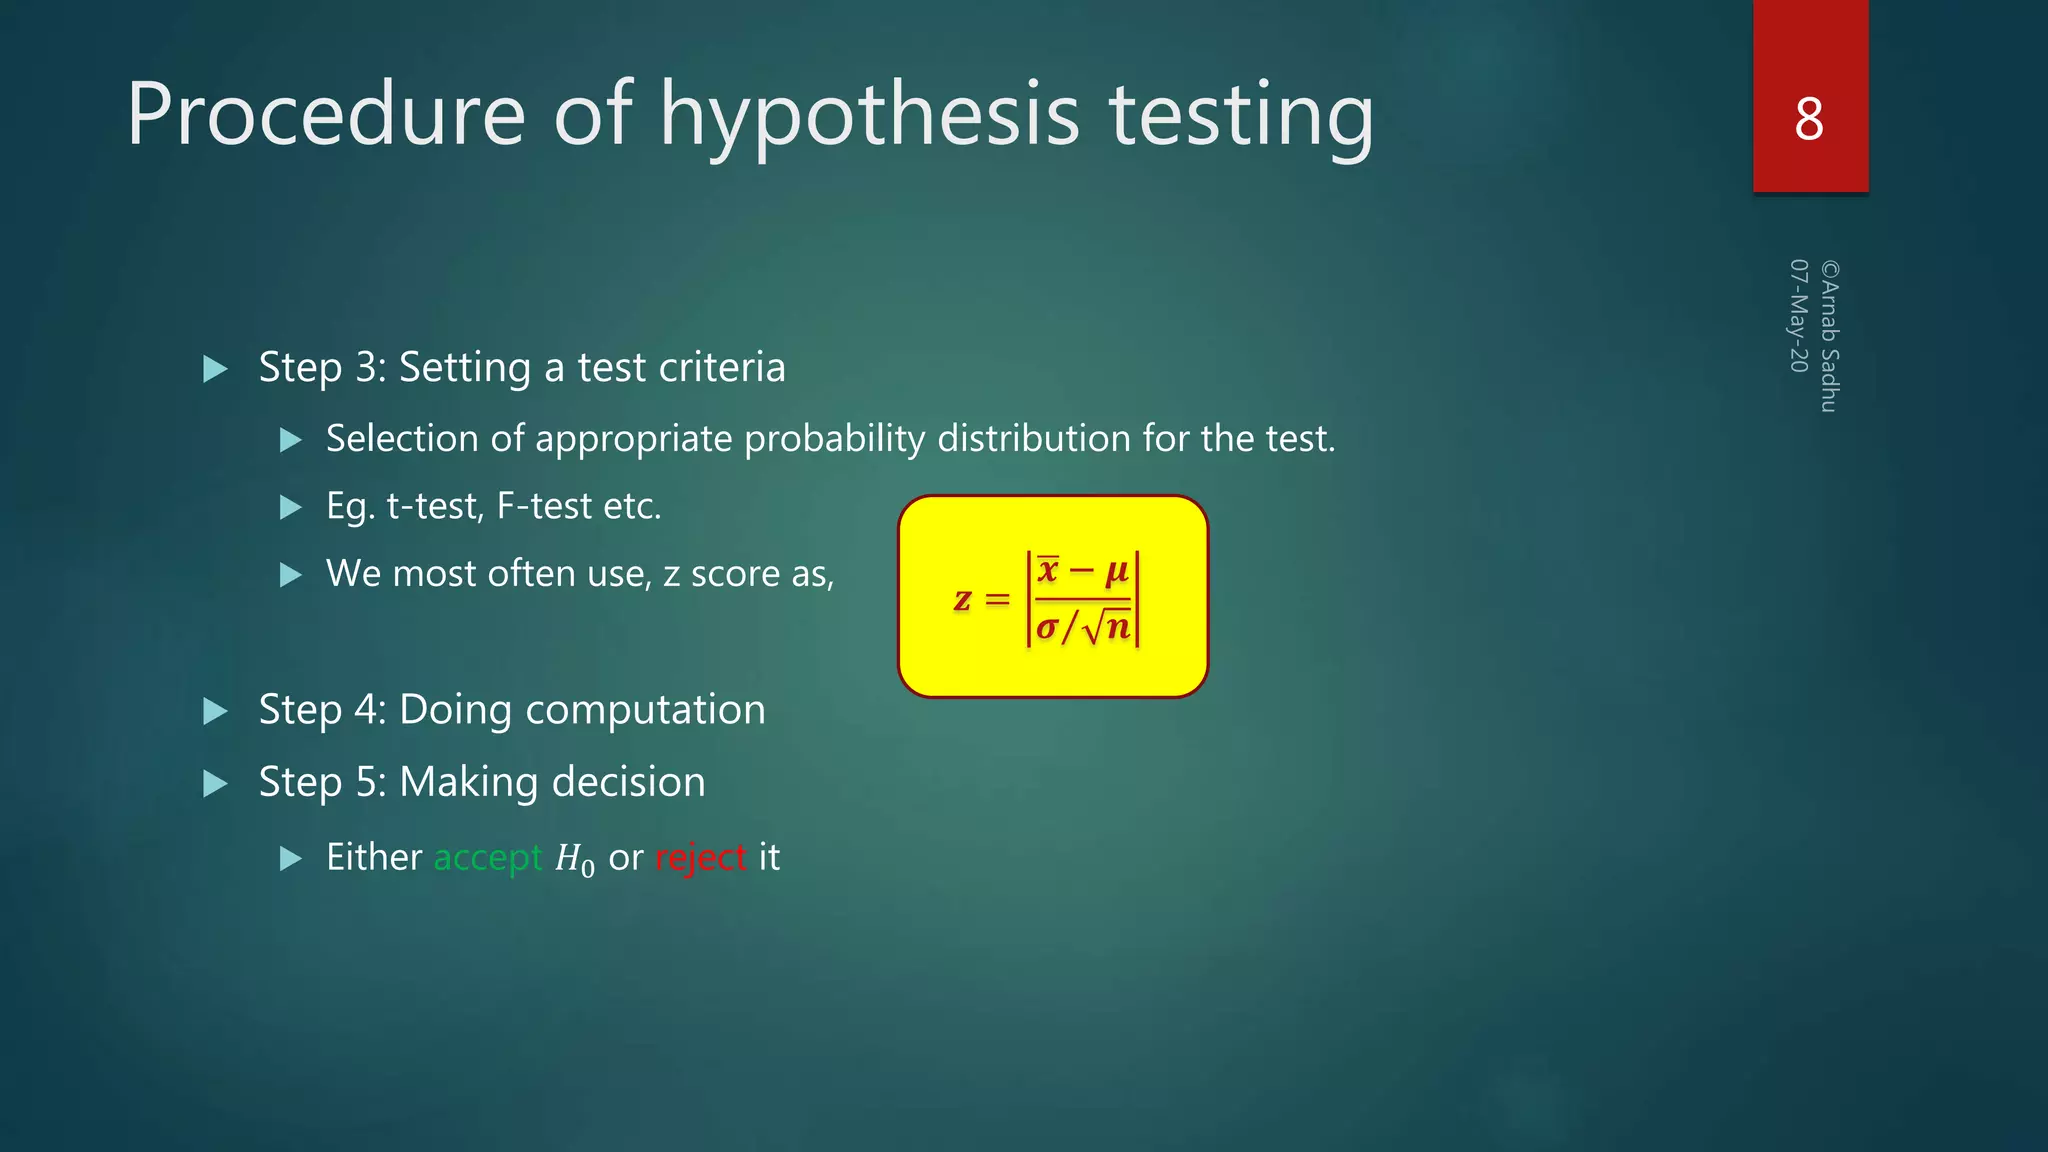
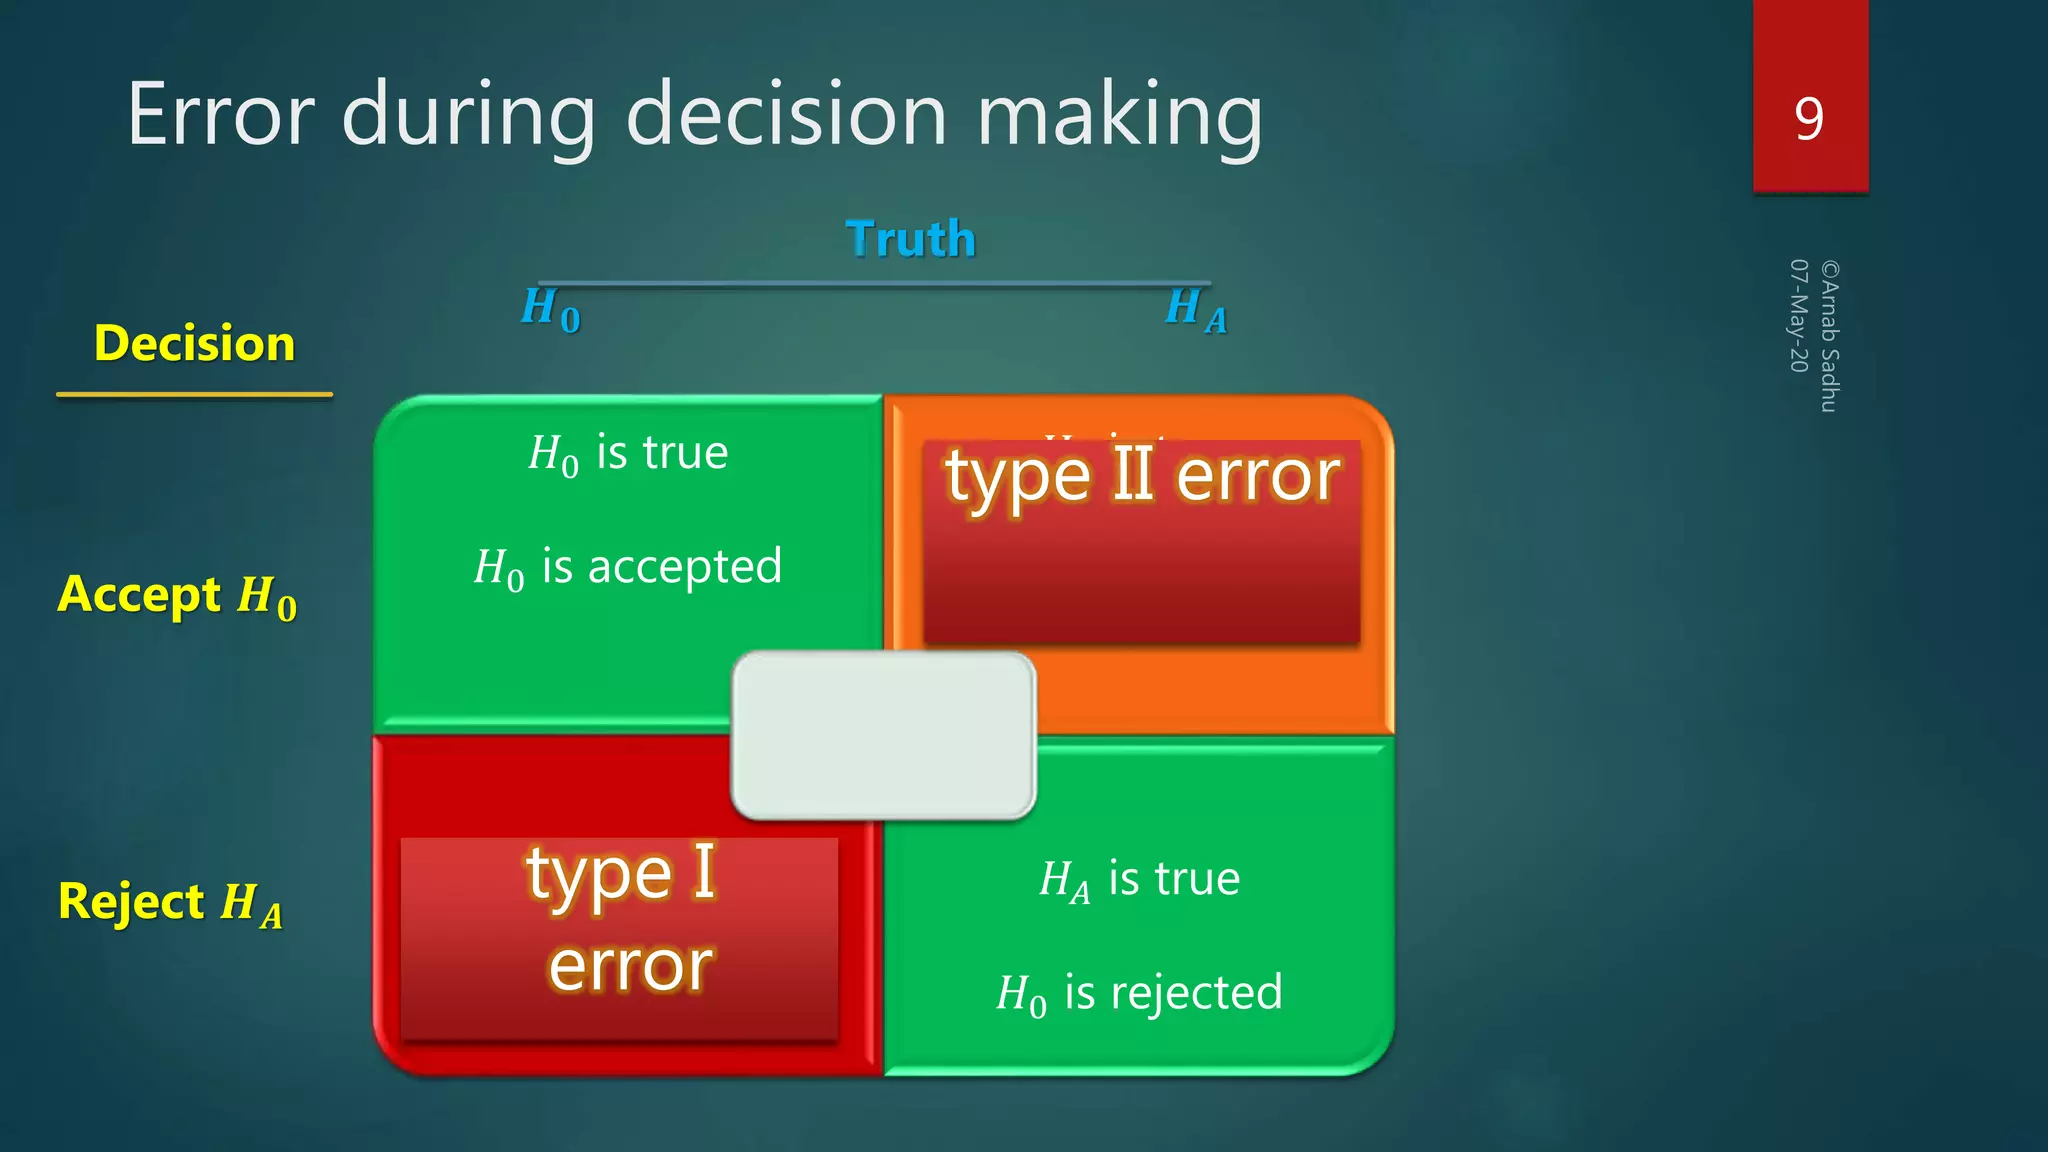
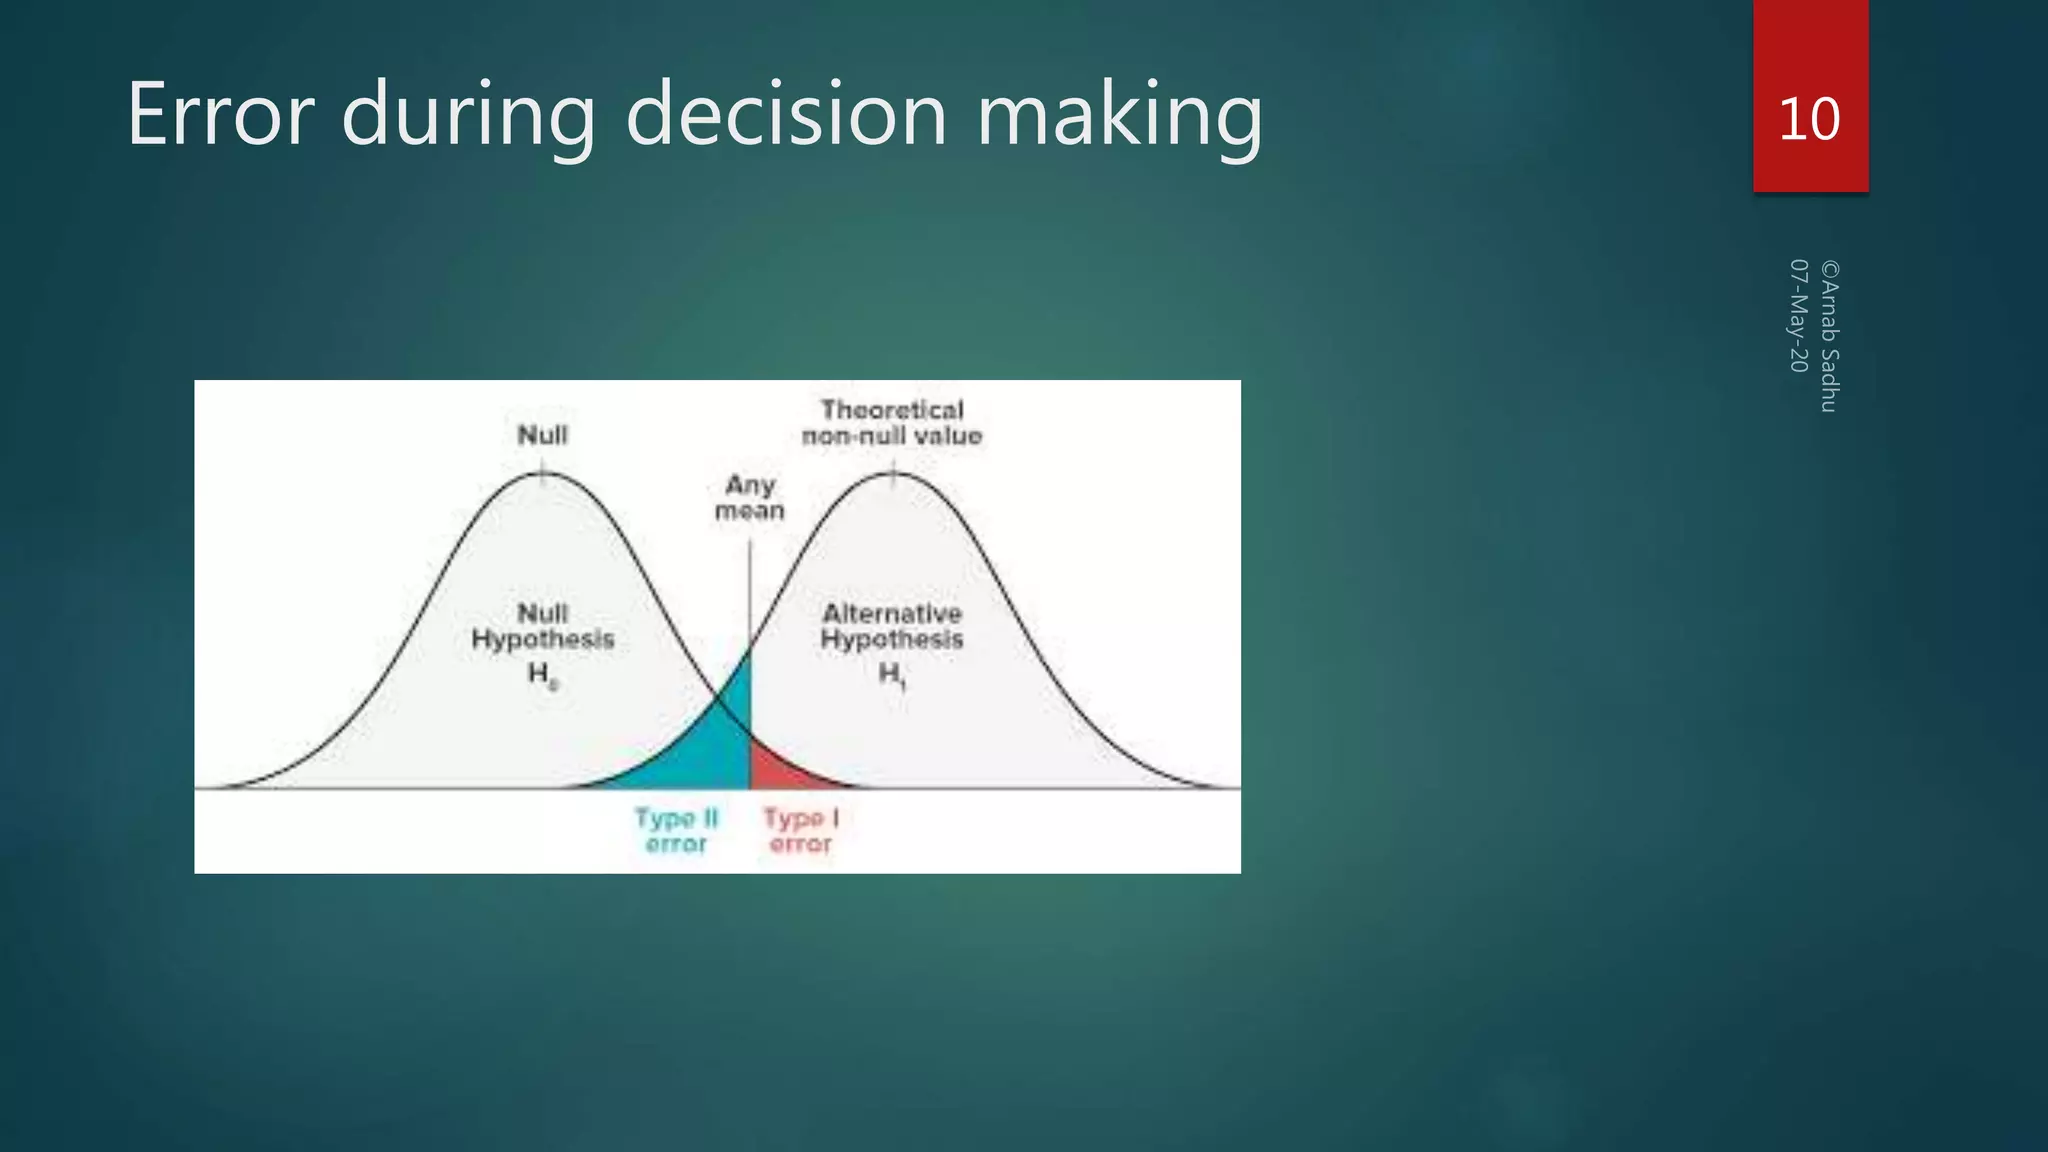
Hypotheses Testing
ARNAB SADHU
SISTER NIVEDITA UNIVERSITY
What is Hypothesis
 It is a statistical technique to test some hypothesis about the
population from which the sample is drawn.
 It is an idea that can be tested on ground of statistical data.
 Eg. :
 Iphone are costly
• this is infeasible as it is not testable
Iphone are costly, given that we consider any price greater than Rs.40k as costly
• this is feasible as it is testable
2
Formulation of Hypotheses
Hypotheses
Null Hypothesis
𝐻0
It is the hypothesis that is to be tested
Alternate Hypothesis
𝐻𝐴 𝑜𝑟 𝐻1
It is the hypothesis that in some sense
contradicts the null hypothesis
3
 Researchers always try to reject the null hypothesis to establish something novel
 Null hypothesis is accepted to be true until proven wrong, it is like innocent until
proven guilty
Example
 Statement: Mean blood sugar level in India is 80 mg/dL
4
The mean
is
80mg/dL
The mean
is not
80mg/dL
NullHypothesis(𝑯𝟎)
AlternateHypothesis
(𝑯𝑨)
Procedure of hypothesis testing
 Step 1: Set up the hypotheses: 𝐻0 𝑎𝑛𝑑 𝐻𝐴
 Step 2: Identify the test statistics and its probability
distribution
 Step 3: Set up a suitable significant level (𝛼).
 Test of validity of 𝐻0 against 𝐻𝐴at certain level of
significance
 Eg. 5%, 1% etc.
 5% level of significance means, we are taking wrong
decision 5% time.
5
Types of testing 6
Critical 𝑧-value
 𝑧-value: It is a standardized score that describes how many standard
deviations (𝜎) an element is from the given mean (𝜇).
Table of critical 𝑧-value
7
Confidence level = 100-significance level
Level of 10% 5% 1% 0.1%
Two tailed 1.65 1.96 2.58 3.29
One tailed 1.28 1.64 2.33 3.10
Procedure of hypothesis testing
 Step 3: Setting a test criteria
 Selection of appropriate probability distribution for the test.
 Eg. t-test, F-test etc.
 We most often use, z score as,
 Step 4: Doing computation
 Step 5: Making decision
 Either accept 𝐻0 or reject it
𝒛 =
𝒙 − 𝝁
𝝈 𝒏
8
Error during decision making 9
𝐻0 is true
𝐻0 is accepted
𝐻𝐴 is true
𝐻0 is accepted
𝐻0 is true
𝐻0 is rejected
𝐻𝐴 is true
𝐻0 is rejected
Truth
𝑯 𝟎 𝑯 𝑨
Decision
Accept 𝑯 𝟎
Reject 𝑯 𝑨
type II error
type I
error
Error during decision making 10
Problem Example
 A random sample of 50 items give the mean 6.2, and variance 10.24. Can it
be regarded as drawn from normal population with mean 5.4 at 5%
significance?
11

Hypothesis testing

  • 1.
  • 2.
    What is Hypothesis It is a statistical technique to test some hypothesis about the population from which the sample is drawn.  It is an idea that can be tested on ground of statistical data.  Eg. :  Iphone are costly • this is infeasible as it is not testable Iphone are costly, given that we consider any price greater than Rs.40k as costly • this is feasible as it is testable 2
  • 3.
    Formulation of Hypotheses Hypotheses NullHypothesis 𝐻0 It is the hypothesis that is to be tested Alternate Hypothesis 𝐻𝐴 𝑜𝑟 𝐻1 It is the hypothesis that in some sense contradicts the null hypothesis 3  Researchers always try to reject the null hypothesis to establish something novel  Null hypothesis is accepted to be true until proven wrong, it is like innocent until proven guilty
  • 4.
    Example  Statement: Meanblood sugar level in India is 80 mg/dL 4 The mean is 80mg/dL The mean is not 80mg/dL NullHypothesis(𝑯𝟎) AlternateHypothesis (𝑯𝑨)
  • 5.
    Procedure of hypothesistesting  Step 1: Set up the hypotheses: 𝐻0 𝑎𝑛𝑑 𝐻𝐴  Step 2: Identify the test statistics and its probability distribution  Step 3: Set up a suitable significant level (𝛼).  Test of validity of 𝐻0 against 𝐻𝐴at certain level of significance  Eg. 5%, 1% etc.  5% level of significance means, we are taking wrong decision 5% time. 5
  • 6.
  • 7.
    Critical 𝑧-value  𝑧-value:It is a standardized score that describes how many standard deviations (𝜎) an element is from the given mean (𝜇). Table of critical 𝑧-value 7 Confidence level = 100-significance level Level of 10% 5% 1% 0.1% Two tailed 1.65 1.96 2.58 3.29 One tailed 1.28 1.64 2.33 3.10
  • 8.
    Procedure of hypothesistesting  Step 3: Setting a test criteria  Selection of appropriate probability distribution for the test.  Eg. t-test, F-test etc.  We most often use, z score as,  Step 4: Doing computation  Step 5: Making decision  Either accept 𝐻0 or reject it 𝒛 = 𝒙 − 𝝁 𝝈 𝒏 8
  • 9.
    Error during decisionmaking 9 𝐻0 is true 𝐻0 is accepted 𝐻𝐴 is true 𝐻0 is accepted 𝐻0 is true 𝐻0 is rejected 𝐻𝐴 is true 𝐻0 is rejected Truth 𝑯 𝟎 𝑯 𝑨 Decision Accept 𝑯 𝟎 Reject 𝑯 𝑨 type II error type I error
  • 10.
  • 11.
    Problem Example  Arandom sample of 50 items give the mean 6.2, and variance 10.24. Can it be regarded as drawn from normal population with mean 5.4 at 5% significance? 11