Downloaded 316 times
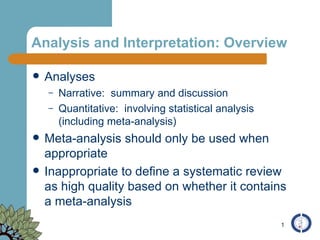
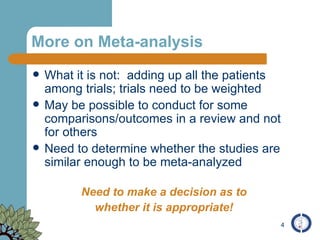
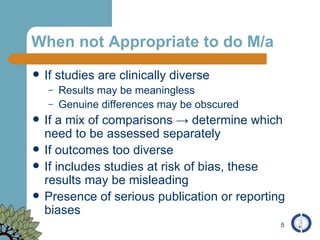
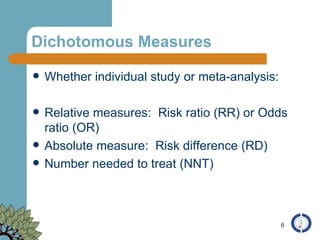
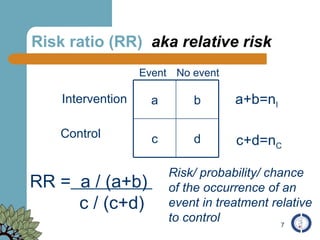
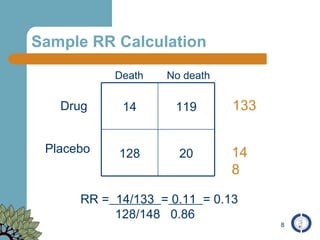
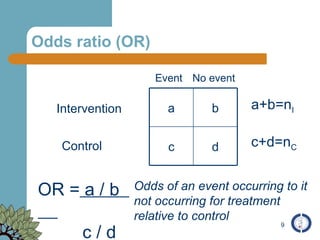
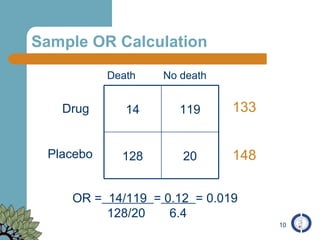
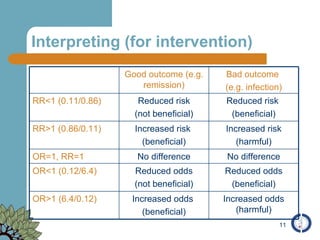
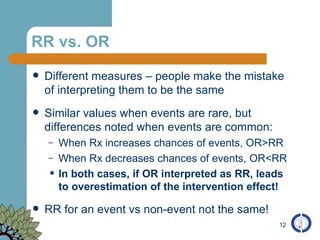
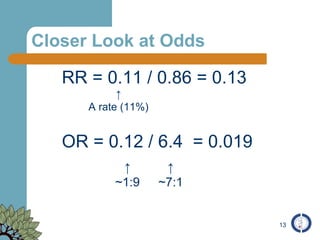
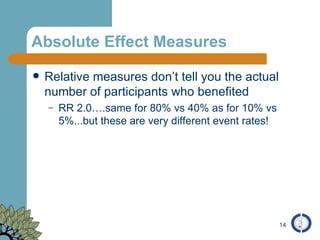
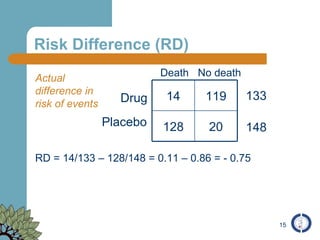
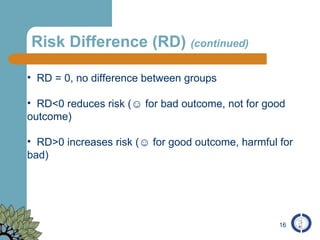
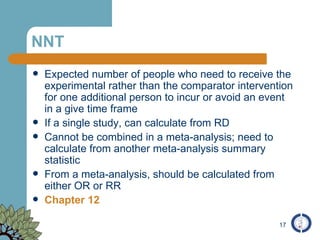
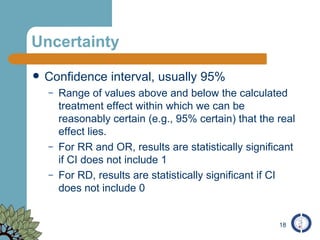
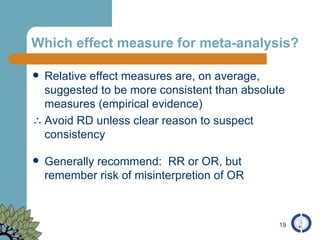
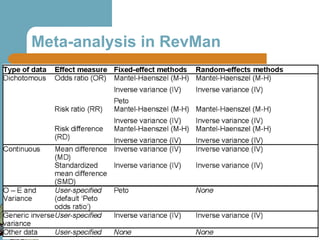
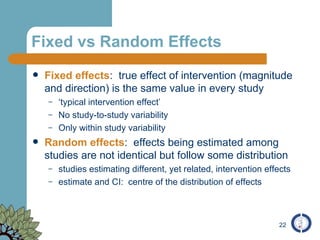
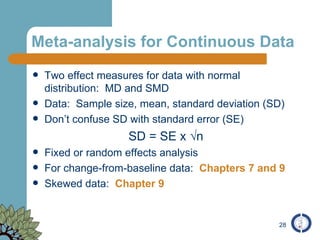
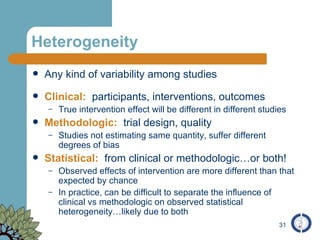
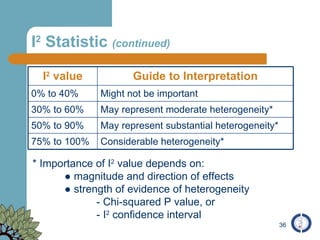
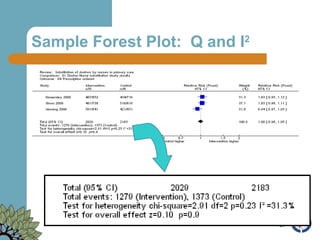
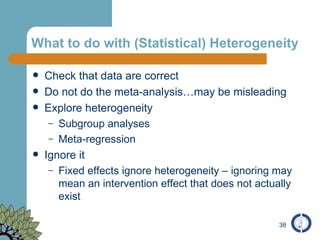
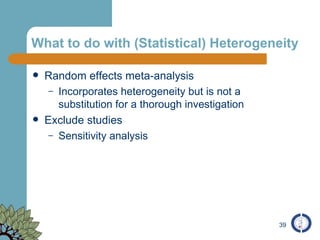

The document provides an overview of meta-analysis, emphasizing its appropriate use in synthesizing quantitative data while addressing issues of study diversity and bias. It outlines the differences between relative (risk ratio, odds ratio) and absolute measures (risk difference, number needed to treat), and discusses the importance of understanding statistical heterogeneity. Additionally, it details methods for analyzing data, including fixed and random effects models, and stresses caution in interpretation of results.


![To tweet or not to tweet? : Exploring the use of Social Media for [public] he...](https://cdn.slidesharecdn.com/ss_thumbnails/pahocisco-091130222152-phpapp01-thumbnail.jpg?width=640&height=640&fit=bounds)


![Getting Started with Apache Spark: Big Data Made Simple [Free Meetup]](https://cdn.slidesharecdn.com/ss_thumbnails/apachesparkgettingstarted-260203175547-8361bcc3-thumbnail.jpg?width=640&height=640&fit=bounds)


