Case study solution (Office Bldg tab) H. Schwarz-Lopes & A. Santos
•
1 like•746 views

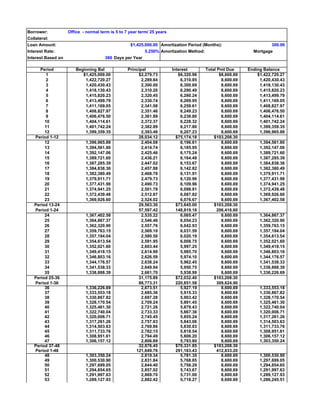
- The document outlines the terms of a $1,425,000 commercial loan for a 5-7 year term amortized over 300 months at an interest rate of 5.25%. - It shows the monthly principal and interest payments over the loan term, with the principal balance decreasing with each payment while the interest portion decreases slightly. - After 300 months of payments, the loan will be fully paid off with a total of $206,416.60 paid in principal and interest over the loan term.

More Related Content
What's hot
What's hot (16)
Similar to Case study solution (Office Bldg tab) H. Schwarz-Lopes & A. Santos
Similar to Case study solution (Office Bldg tab) H. Schwarz-Lopes & A. Santos (20)
More from UCF Continuing Education
More from UCF Continuing Education (8)
Recently uploaded
Recently uploaded (20)
Case study solution (Office Bldg tab) H. Schwarz-Lopes & A. Santos
- 1. Borrower: Office - normal term is 5 to 7 year term/ 25 years Collateral: Loan Amount: $1,425,000.00 Amortization Period (Months): 300.00 Interest Rate: 5.250% Amortization Method: Mortgage Interest Based on 360 Days per Year Period Beginning Bal Principal Interest Total Pmt Due Ending Balance 1 $1,425,000.00 $2,279.73 $6,320.96 $8,600.69 $1,422,720.27 2 1,422,720.27 2,289.84 6,310.85 8,600.69 1,420,430.43 3 1,420,430.43 2,300.00 6,300.69 8,600.69 1,418,130.43 4 1,418,130.43 2,310.20 6,290.49 8,600.69 1,415,820.23 5 1,415,820.23 2,320.45 6,280.24 8,600.69 1,413,499.79 6 1,413,499.79 2,330.74 6,269.95 8,600.69 1,411,169.05 7 1,411,169.05 2,341.08 6,259.61 8,600.69 1,408,827.97 8 1,408,827.97 2,351.46 6,249.23 8,600.69 1,406,476.50 9 1,406,476.50 2,361.89 6,238.80 8,600.69 1,404,114.61 10 1,404,114.61 2,372.37 6,228.32 8,600.69 1,401,742.24 11 1,401,742.24 2,382.89 6,217.80 8,600.69 1,399,359.35 12 1,399,359.35 2,393.46 6,207.23 8,600.69 1,396,965.88 Period 1-12 28,034.12 $75,174.18 $103,208.30 12 1,396,965.88 2,404.08 6,196.61 8,600.69 1,394,561.80 13 1,394,561.80 2,414.74 6,185.95 8,600.69 1,392,147.06 14 1,392,147.06 2,425.46 6,175.24 8,600.69 1,389,721.60 15 1,389,721.60 2,436.21 6,164.48 8,600.69 1,387,285.39 16 1,387,285.39 2,447.02 6,153.67 8,600.69 1,384,838.36 17 1,384,838.36 2,457.88 6,142.82 8,600.69 1,382,380.49 18 1,382,380.49 2,468.78 6,131.91 8,600.69 1,379,911.71 19 1,379,911.71 2,479.73 6,120.96 8,600.69 1,377,431.98 20 1,377,431.98 2,490.73 6,109.96 8,600.69 1,374,941.25 21 1,374,941.25 2,501.78 6,098.91 8,600.69 1,372,439.48 22 1,372,439.48 2,512.87 6,087.82 8,600.69 1,369,926.60 23 1,369,926.60 2,524.02 6,076.67 8,600.69 1,367,402.58 Period 13-24 29,563.30 $73,645.00 $103,208.30 Period 1-24 57,597.42 148,819.18 206,416.60 24 1,367,402.58 2,535.22 6,065.47 8,600.69 1,364,867.37 25 1,364,867.37 2,546.46 6,054.23 8,600.69 1,362,320.90 26 1,362,320.90 2,557.76 6,042.93 8,600.69 1,359,763.15 27 1,359,763.15 2,569.10 6,031.59 8,600.69 1,357,194.04 28 1,357,194.04 2,580.50 6,020.19 8,600.69 1,354,613.54 29 1,354,613.54 2,591.95 6,008.75 8,600.69 1,352,021.60 30 1,352,021.60 2,603.44 5,997.25 8,600.69 1,349,418.15 31 1,349,418.15 2,614.99 5,985.70 8,600.69 1,346,803.16 32 1,346,803.16 2,626.59 5,974.10 8,600.69 1,344,176.57 33 1,344,176.57 2,638.24 5,962.45 8,600.69 1,341,538.33 34 1,341,538.33 2,649.94 5,950.75 8,600.69 1,338,888.39 35 1,338,888.39 2,661.70 5,938.99 8,600.69 1,336,226.69 Period 25-36 31,175.89 $72,032.40 $103,208.30 Period 1-36 88,773.31 220,851.58 309,624.90 36 1,336,226.69 2,673.51 5,927.19 8,600.69 1,333,553.18 37 1,333,553.18 2,685.36 5,915.33 8,600.69 1,330,867.82 38 1,330,867.82 2,697.28 5,903.42 8,600.69 1,328,170.54 39 1,328,170.54 2,709.24 5,891.45 8,600.69 1,325,461.30 40 1,325,461.30 2,721.26 5,879.43 8,600.69 1,322,740.04 41 1,322,740.04 2,733.33 5,867.36 8,600.69 1,320,006.71 42 1,320,006.71 2,745.45 5,855.24 8,600.69 1,317,261.26 43 1,317,261.26 2,757.63 5,843.06 8,600.69 1,314,503.63 44 1,314,503.63 2,769.86 5,830.83 8,600.69 1,311,733.76 45 1,311,733.76 2,782.15 5,818.54 8,600.69 1,308,951.61 46 1,308,951.61 2,794.49 5,806.20 8,600.69 1,306,157.12 47 1,306,157.12 2,806.89 5,793.80 8,600.69 1,303,350.24 Period 37-48 32,876.45 $70,331.85 $103,208.30 Period 1-48 121,649.76 291,183.43 412,833.20 48 1,303,350.24 2,819.34 5,781.35 8,600.69 1,300,530.90 49 1,300,530.90 2,831.84 5,768.85 8,600.69 1,297,699.05 50 1,297,699.05 2,844.40 5,756.29 8,600.69 1,294,854.65 51 1,294,854.65 2,857.02 5,743.67 8,600.69 1,291,997.63 52 1,291,997.63 2,869.70 5,731.00 8,600.69 1,289,127.93 53 1,289,127.93 2,882.42 5,718.27 8,600.69 1,286,245.51
- 2. 54 1,286,245.51 2,895.21 5,705.48 8,600.69 1,283,350.30 55 1,283,350.30 2,908.05 5,692.64 8,600.69 1,280,442.25 56 1,280,442.25 2,920.95 5,679.74 8,600.69 1,277,521.29 57 1,277,521.29 2,933.91 5,666.78 8,600.69 1,274,587.38 58 1,274,587.38 2,946.92 5,653.77 8,600.69 1,271,640.46 59 1,271,640.46 2,959.99 5,640.70 8,600.69 1,268,680.47 Period 49-60 34,669.77 68,538.53 103,208.30 Period 1-60 156,319.53 359,721.96 516,041.49 60 1,268,680.47 2,973.12 5,627.57 8,600.69 1,265,707.34 61 1,265,707.34 2,986.31 5,614.38 8,600.69 1,262,721.03 62 1,262,721.03 2,999.56 5,601.13 8,600.69 1,259,721.47 63 1,259,721.47 3,012.86 5,587.83 8,600.69 1,256,708.61 64 1,256,708.61 3,026.23 5,574.46 8,600.69 1,253,682.38 65 1,253,682.38 3,039.65 5,561.04 8,600.69 1,250,642.72 66 1,250,642.72 3,053.14 5,547.56 8,600.69 1,247,589.59 67 1,247,589.59 3,066.68 5,534.01 8,600.69 1,244,522.91 68 1,244,522.91 3,080.28 5,520.41 8,600.69 1,241,442.63 69 1,241,442.63 3,093.95 5,506.75 8,600.69 1,238,348.68 70 1,238,348.68 3,107.67 5,493.02 8,600.69 1,235,241.01 71 1,235,241.01 3,121.45 5,479.24 8,600.69 1,232,119.56 Period 61-72 36,560.91 66,647.39 103,208.30 Period 1-72 192,880.44 426,369.35 619,249.79 72 1,232,119.56 3,135.30 5,465.39 8,600.69 1,228,984.26 73 1,228,984.26 3,149.21 5,451.48 8,600.69 1,225,835.05 74 1,225,835.05 3,163.18 5,437.51 8,600.69 1,222,671.88 75 1,222,671.88 3,177.21 5,423.48 8,600.69 1,219,494.67 76 1,219,494.67 3,191.30 5,409.39 8,600.69 1,216,303.37 77 1,216,303.37 3,205.46 5,395.23 8,600.69 1,213,097.91 78 1,213,097.91 3,219.68 5,381.02 8,600.69 1,209,878.23 79 1,209,878.23 3,233.96 5,366.73 8,600.69 1,206,644.28 80 1,206,644.28 3,248.30 5,352.39 8,600.69 1,203,395.97 81 1,203,395.97 3,262.71 5,337.98 8,600.69 1,200,133.26 82 1,200,133.26 3,277.18 5,323.51 8,600.69 1,196,856.08 83 1,196,856.08 3,291.72 5,308.97 8,600.69 1,193,564.36 Period 73-84 38,555.20 64,653.10 103,208.30 Period 1-84 231,435.64 491,022.45 722,458.09 84 1,193,564.36 3,306.32 5,294.37 8,600.69 1,190,258.04 85 1,190,258.04 3,320.99 5,279.70 8,600.69 1,186,937.05 86 1,186,937.05 3,335.72 5,264.97 8,600.69 1,183,601.33 87 1,183,601.33 3,350.52 5,250.18 8,600.69 1,180,250.81 88 1,180,250.81 3,365.38 5,235.31 8,600.69 1,176,885.44 89 1,176,885.44 3,380.31 5,220.39 8,600.69 1,173,505.13 90 1,173,505.13 3,395.30 5,205.39 8,600.69 1,170,109.83 91 1,170,109.83 3,410.36 5,190.33 8,600.69 1,166,699.47 92 1,166,699.47 3,425.49 5,175.20 8,600.69 1,163,273.98 93 1,163,273.98 3,440.68 5,160.01 8,600.69 1,159,833.30 94 1,159,833.30 3,455.94 5,144.75 8,600.69 1,156,377.35 95 1,156,377.35 3,471.27 5,129.42 8,600.69 1,152,906.08 Period 85-96 40,658.28 62,550.02 103,208.30 Period 1-96 272,093.92 553,572.47 825,666.39 96 1,152,906.08 3,486.67 5,114.02 8,600.69 1,149,419.41 97 1,149,419.41 3,502.14 5,098.55 8,600.69 1,145,917.27 98 1,145,917.27 3,517.67 5,083.02 8,600.69 1,142,399.60 99 1,142,399.60 3,533.28 5,067.41 8,600.69 1,138,866.32 100 1,138,866.32 3,548.95 5,051.74 8,600.69 1,135,317.37 101 1,135,317.37 3,564.69 5,036.00 8,600.69 1,131,752.68 102 1,131,752.68 3,580.50 5,020.19 8,600.69 1,128,172.17 103 1,128,172.17 3,596.39 5,004.31 8,600.69 1,124,575.79 104 1,124,575.79 3,612.34 4,988.35 8,600.69 1,120,963.45 105 1,120,963.45 3,628.36 4,972.33 8,600.69 1,117,335.09 106 1,117,335.09 3,644.46 4,956.23 8,600.69 1,113,690.63 107 1,113,690.63 3,660.62 4,940.07 8,600.69 1,110,030.01 Period 97-108 42,876.07 60,332.23 103,208.30 Period 1-108 314,969.99 613,904.70 928,874.69
- 3. 108 1,110,030.01 3,676.86 4,923.83 8,600.69 1,106,353.15 109 1,106,353.15 3,693.17 4,907.52 8,600.69 1,102,659.98 110 1,102,659.98 3,709.55 4,891.14 8,600.69 1,098,950.42 111 1,098,950.42 3,726.01 4,874.68 8,600.69 1,095,224.42 112 1,095,224.42 3,742.53 4,858.16 8,600.69 1,091,481.88 113 1,091,481.88 3,759.14 4,841.56 8,600.69 1,087,722.75 114 1,087,722.75 3,775.81 4,824.88 8,600.69 1,083,946.94 115 1,083,946.94 3,792.56 4,808.13 8,600.69 1,080,154.38 116 1,080,154.38 3,809.38 4,791.31 8,600.69 1,076,344.99 117 1,076,344.99 3,826.28 4,774.41 8,600.69 1,072,518.72 118 1,072,518.72 3,843.25 4,757.44 8,600.69 1,068,675.46 119 1,068,675.46 3,860.30 4,740.39 8,600.69 1,064,815.16 Period 109-120 45,214.84 57,993.46 103,208.30 Period 1-120 360,184.84 671,898.15 1,032,082.99 120 1,064,815.16 3,877.42 4,723.27 8,600.69 1,060,937.74 121 1,060,937.74 3,894.62 4,706.07 8,600.69 1,057,043.12 122 1,057,043.12 3,911.90 4,688.79 8,600.69 1,053,131.22 123 1,053,131.22 3,929.25 4,671.44 8,600.69 1,049,201.97 124 1,049,201.97 3,946.68 4,654.01 8,600.69 1,045,255.29 125 1,045,255.29 3,964.19 4,636.51 8,600.69 1,041,291.11 126 1,041,291.11 3,981.77 4,618.92 8,600.69 1,037,309.34 127 1,037,309.34 3,999.43 4,601.26 8,600.69 1,033,309.90 128 1,033,309.90 4,017.17 4,583.52 8,600.69 1,029,292.73 129 1,029,292.73 4,034.99 4,565.70 8,600.69 1,025,257.74 130 1,025,257.74 4,052.89 4,547.80 8,600.69 1,021,204.85 131 1,021,204.85 4,070.87 4,529.82 8,600.69 1,017,133.98 Period 121-132 47,681.18 55,527.11 103,208.30 Period 1-132 407,866.02 727,425.27 1,135,291.29 132 1,017,133.98 4,088.93 4,511.77 8,600.69 1,013,045.05 133 1,013,045.05 4,107.06 4,493.63 8,600.69 1,008,937.99 134 1,008,937.99 4,125.28 4,475.41 8,600.69 1,004,812.71 135 1,004,812.71 4,143.58 4,457.11 8,600.69 1,000,669.13 136 1,000,669.13 4,161.96 4,438.73 8,600.69 996,507.17 137 996,507.17 4,180.42 4,420.27 8,600.69 992,326.75 138 992,326.75 4,198.96 4,401.73 8,600.69 988,127.79 139 988,127.79 4,217.59 4,383.10 8,600.69 983,910.20 140 983,910.20 4,236.30 4,364.39 8,600.69 979,673.90 141 979,673.90 4,255.09 4,345.60 8,600.69 975,418.81 142 975,418.81 4,273.96 4,326.73 8,600.69 971,144.84 143 971,144.84 4,292.92 4,307.77 8,600.69 966,851.92 Period 133-144 50,282.06 52,926.24 103,208.30 Period 1-144 458,148.08 780,351.51 1,238,499.59 144 966,851.92 4,311.96 4,288.73 8,600.69 962,539.96 145 962,539.96 4,331.09 4,269.60 8,600.69 958,208.87 146 958,208.87 4,350.30 4,250.39 8,600.69 953,858.56 147 953,858.56 4,369.60 4,231.09 8,600.69 949,488.96 148 949,488.96 4,388.98 4,211.71 8,600.69 945,099.98 149 945,099.98 4,408.45 4,192.24 8,600.69 940,691.53 150 940,691.53 4,428.01 4,172.69 8,600.69 936,263.52 151 936,263.52 4,447.65 4,153.04 8,600.69 931,815.88 152 931,815.88 4,467.38 4,133.32 8,600.69 927,348.50 153 927,348.50 4,487.19 4,113.50 8,600.69 922,861.31 154 922,861.31 4,507.10 4,093.59 8,600.69 918,354.21 155 918,354.21 4,527.09 4,073.60 8,600.69 913,827.12 Period 145-156 53,024.80 50,183.50 103,208.30
- 4. Period 1-156 511,172.88 830,535.01 1,341,707.88 156 913,827.12 4,547.17 4,053.52 8,600.69 909,279.95 157 909,279.95 4,567.34 4,033.35 8,600.69 904,712.61 158 904,712.61 4,587.60 4,013.09 8,600.69 900,125.01 159 900,125.01 4,607.95 3,992.74 8,600.69 895,517.06 160 895,517.06 4,628.39 3,972.30 8,600.69 890,888.67 161 890,888.67 4,648.92 3,951.77 8,600.69 886,239.75 162 886,239.75 4,669.54 3,931.15 8,600.69 881,570.21 163 881,570.21 4,690.25 3,910.44 8,600.69 876,879.96 164 876,879.96 4,711.06 3,889.63 8,600.69 872,168.90 165 872,168.90 4,731.96 3,868.74 8,600.69 867,436.94 166 867,436.94 4,752.95 3,847.75 8,600.69 862,683.99 167 862,683.99 4,774.03 3,826.66 8,600.69 857,909.96 Period 157-168 55,917.16 47,291.14 103,208.30 Period 1-168 567,090.04 877,826.15 1,444,916.18 168 857,909.96 4,795.21 3,805.49 8,600.69 853,114.76 169 853,114.76 4,816.48 3,784.22 8,600.69 848,298.28 170 848,298.28 4,837.84 3,762.85 8,600.69 843,460.44 171 843,460.44 4,859.30 3,741.39 8,600.69 838,601.14 172 838,601.14 4,880.85 3,719.84 8,600.69 833,720.29 173 833,720.29 4,902.51 3,698.19 8,600.69 828,817.78 174 828,817.78 4,924.25 3,676.44 8,600.69 823,893.53 175 823,893.53 4,946.09 3,654.60 8,600.69 818,947.44 176 818,947.44 4,968.03 3,632.66 8,600.69 813,979.40 177 813,979.40 4,990.07 3,610.62 8,600.69 808,989.33 178 808,989.33 5,012.21 3,588.49 8,600.69 803,977.13 179 803,977.13 5,034.44 3,566.25 8,600.69 798,942.69 Period 169-180 58,967.28 44,241.02 103,208.30 Period 1-180 626,057.31 922,067.17 1,548,124.48 180 798,942.69 5,056.77 3,543.92 8,600.69 793,885.92 181 793,885.92 5,079.20 3,521.49 8,600.69 788,806.71 182 788,806.71 5,101.73 3,498.96 8,600.69 783,704.98 183 783,704.98 5,124.36 3,476.33 8,600.69 778,580.62 184 778,580.62 5,147.09 3,453.60 8,600.69 773,433.53 185 773,433.53 5,169.92 3,430.77 8,600.69 768,263.61 186 768,263.61 5,192.86 3,407.84 8,600.69 763,070.75 187 763,070.75 5,215.89 3,384.80 8,600.69 757,854.86 188 757,854.86 5,239.03 3,361.67 8,600.69 752,615.84 189 752,615.84 5,262.27 3,338.43 8,600.69 747,353.57 190 747,353.57 5,285.61 3,315.08 8,600.69 742,067.96 191 742,067.96 5,309.05 3,291.64 8,600.69 736,758.91 Period 181-192 62,183.78 41,024.52 103,208.30 Period 1-192 688,241.09 963,091.69 1,651,332.78 192 736,758.91 5,332.60 3,268.09 8,600.69 731,426.31 193 731,426.31 5,356.26 3,244.43 8,600.69 726,070.05 194 726,070.05 5,380.02 3,220.68 8,600.69 720,690.03 195 720,690.03 5,403.88 3,196.81 8,600.69 715,286.15 196 715,286.15 5,427.85 3,172.84 8,600.69 709,858.30 197 709,858.30 5,451.93 3,148.76 8,600.69 704,406.37 198 704,406.37 5,476.11 3,124.58 8,600.69 698,930.26 199 698,930.26 5,500.40 3,100.29 8,600.69 693,429.86 200 693,429.86 5,524.80 3,075.89 8,600.69 687,905.06 201 687,905.06 5,549.31 3,051.38 8,600.69 682,355.75 202 682,355.75 5,573.92 3,026.77 8,600.69 676,781.83 203 676,781.83 5,598.65 3,002.04 8,600.69 671,183.18
- 5. Period 193-204 65,575.73 37,632.57 103,208.30 Period 1-204 753,816.82 1,000,724.26 1,754,541.08 204 671,183.18 5,623.48 2,977.21 8,600.69 665,559.70 205 665,559.70 5,648.43 2,952.27 8,600.69 659,911.28 206 659,911.28 5,673.48 2,927.21 8,600.69 654,237.79 207 654,237.79 5,698.65 2,902.04 8,600.69 648,539.15 208 648,539.15 5,723.93 2,876.77 8,600.69 642,815.22 209 642,815.22 5,749.32 2,851.38 8,600.69 637,065.91 210 637,065.91 5,774.82 2,825.87 8,600.69 631,291.09 211 631,291.09 5,800.43 2,800.26 8,600.69 625,490.66 212 625,490.66 5,826.16 2,774.53 8,600.69 619,664.49 213 619,664.49 5,852.01 2,748.69 8,600.69 613,812.49 214 613,812.49 5,877.96 2,722.73 8,600.69 607,934.52 215 607,934.52 5,904.04 2,696.65 8,600.69 602,030.49 Period 205-216 69,152.70 34,055.60 103,208.30 Period 1-216 822,969.51 1,034,779.86 1,857,749.38 216 602,030.49 5,930.23 2,670.47 8,600.69 596,100.26 217 596,100.26 5,956.53 2,644.16 8,600.69 590,143.73 218 590,143.73 5,982.95 2,617.74 8,600.69 584,160.77 219 584,160.77 6,009.49 2,591.20 8,600.69 578,151.28 220 578,151.28 6,036.15 2,564.54 8,600.69 572,115.13 221 572,115.13 6,062.92 2,537.77 8,600.69 566,052.21 222 566,052.21 6,089.82 2,510.87 8,600.69 559,962.39 223 559,962.39 6,116.83 2,483.86 8,600.69 553,845.56 224 553,845.56 6,143.96 2,456.73 8,600.69 547,701.60 225 547,701.60 6,171.22 2,429.47 8,600.69 541,530.38 226 541,530.38 6,198.59 2,402.10 8,600.69 535,331.79 227 535,331.79 6,226.09 2,374.61 8,600.69 529,105.70 Period 217-228 72,924.78 30,283.52 103,208.30 Period 1-228 895,894.30 1,065,063.38 1,960,957.68 228 529,105.70 6,253.70 2,346.99 8,600.69 522,852.00 229 522,852.00 6,281.44 2,319.25 8,600.69 516,570.56 230 516,570.56 6,309.31 2,291.39 8,600.69 510,261.25 231 510,261.25 6,337.29 2,263.40 8,600.69 503,923.96 232 503,923.96 6,365.40 2,235.29 8,600.69 497,558.55 233 497,558.55 6,393.64 2,207.05 8,600.69 491,164.91 234 491,164.91 6,422.00 2,178.69 8,600.69 484,742.91 235 484,742.91 6,450.49 2,150.21 8,600.69 478,292.43 236 478,292.43 6,479.10 2,121.59 8,600.69 471,813.33 237 471,813.33 6,507.84 2,092.85 8,600.69 465,305.49 238 465,305.49 6,536.71 2,063.99 8,600.69 458,768.78 239 458,768.78 6,565.70 2,034.99 8,600.69 452,203.08 Period 229-240 76,902.62 26,305.68 103,208.30 Period 1-240 972,796.92 1,091,369.06 2,064,165.98 240 452,203.08 6,594.83 2,005.87 8,600.69 445,608.26 241 445,608.26 6,624.08 1,976.61 8,600.69 438,984.18 242 438,984.18 6,653.46 1,947.23 8,600.69 432,330.72 243 432,330.72 6,682.97 1,917.72 8,600.69 425,647.74 244 425,647.74 6,712.62 1,888.07 8,600.69 418,935.12 245 418,935.12 6,742.39 1,858.30 8,600.69 412,192.73 246 412,192.73 6,772.30 1,828.39 8,600.69 405,420.43 247 405,420.43 6,802.34 1,798.35 8,600.69 398,618.08 248 398,618.08 6,832.52 1,768.18 8,600.69 391,785.57 249 391,785.57 6,862.82 1,737.87 8,600.69 384,922.74 250 384,922.74 6,893.27 1,707.43 8,600.69 378,029.48
- 6. 251 378,029.48 6,923.84 1,676.85 8,600.69 371,105.64 Period 241-252 81,097.44 22,110.86 103,208.30 Period 1-252 1,053,894.36 1,113,479.91 2,167,374.28 252 371,105.64 6,954.55 1,646.14 8,600.69 364,151.08 253 364,151.08 6,985.40 1,615.29 8,600.69 357,165.68 254 357,165.68 7,016.39 1,584.30 8,600.69 350,149.29 255 350,149.29 7,047.51 1,553.18 8,600.69 343,101.78 256 343,101.78 7,078.77 1,521.92 8,600.69 336,023.01 257 336,023.01 7,110.17 1,490.52 8,600.69 328,912.83 258 328,912.83 7,141.71 1,458.98 8,600.69 321,771.12 259 321,771.12 7,173.39 1,427.30 8,600.69 314,597.73 260 314,597.73 7,205.21 1,395.48 8,600.69 307,392.52 261 307,392.52 7,237.17 1,363.52 8,600.69 300,155.35 262 300,155.35 7,269.27 1,331.42 8,600.69 292,886.08 263 292,886.08 7,301.52 1,299.17 8,600.69 285,584.56 Period 253-264 85,521.08 17,687.22 103,208.30 Period 1-264 1,139,415.44 1,131,167.13 2,270,582.57 264 285,584.56 7,333.91 1,266.79 8,600.69 278,250.65 265 278,250.65 7,366.44 1,234.25 8,600.69 270,884.21 266 270,884.21 7,399.11 1,201.58 8,600.69 263,485.10 267 263,485.10 7,431.93 1,168.76 8,600.69 256,053.17 268 256,053.17 7,464.90 1,135.79 8,600.69 248,588.27 269 248,588.27 7,498.01 1,102.68 8,600.69 241,090.25 270 241,090.25 7,531.27 1,069.42 8,600.69 233,558.98 271 233,558.98 7,564.68 1,036.01 8,600.69 225,994.30 272 225,994.30 7,598.23 1,002.46 8,600.69 218,396.07 273 218,396.07 7,631.94 968.75 8,600.69 210,764.13 274 210,764.13 7,665.79 934.90 8,600.69 203,098.34 275 203,098.34 7,699.80 900.90 8,600.69 195,398.54 Period 265-276 90,186.01 13,022.29 103,208.30 Period 1-276 1,229,601.46 1,144,189.42 2,373,790.87 276 195,398.54 7,733.95 866.74 8,600.69 187,664.59 277 187,664.59 7,768.26 832.44 8,600.69 179,896.34 278 179,896.34 7,802.71 797.98 8,600.69 172,093.62 279 172,093.62 7,837.32 763.37 8,600.69 164,256.30 280 164,256.30 7,872.09 728.60 8,600.69 156,384.21 281 156,384.21 7,907.01 693.68 8,600.69 148,477.20 282 148,477.20 7,942.08 658.61 8,600.69 140,535.12 283 140,535.12 7,977.31 623.38 8,600.69 132,557.81 284 132,557.81 8,012.70 588.00 8,600.69 124,545.11 285 124,545.11 8,048.24 552.45 8,600.69 116,496.87 286 116,496.87 8,083.94 516.75 8,600.69 108,412.93 287 108,412.93 8,119.80 480.89 8,600.69 100,293.14 Period 277-288 95,105.41 8,102.89 103,208.30 Period 1-288 1,324,706.86 1,152,292.31 2,476,999.17 288 100,293.14 8,155.81 444.88 8,600.69 92,137.32 289 92,137.32 8,191.99 408.70 8,600.69 83,945.33 290 83,945.33 8,228.33 372.36 8,600.69 75,717.00 291 75,717.00 8,264.83 335.86 8,600.69 67,452.17 292 67,452.17 8,301.49 299.20 8,600.69 59,150.68 293 59,150.68 8,338.31 262.38 8,600.69 50,812.37 294 50,812.37 8,375.30 225.39 8,600.69 42,437.07 295 42,437.07 8,412.45 188.24 8,600.69 34,024.62 296 34,024.62 8,449.77 150.93 8,600.69 25,574.85 297 25,574.85 8,487.25 113.44 8,600.69 17,087.60
- 7. 298 17,087.60 8,524.89 75.80 8,600.69 8,562.71 299 8,562.71 8,562.71 37.98 8,600.69 0.00 Period 289-300 100,293.14 2,915.16 103,208.30 Period 1-300 1,425,000.00 1,155,207.47 2,580,207.47 300 0.00 0.00 0.00 0.00 0.00 301 0.00 0.00 0.00 0.00 0.00 302 0.00 0.00 0.00 0.00 0.00 303 0.00 0.00 0.00 0.00 0.00 304 0.00 0.00 0.00 0.00 0.00 305 0.00 0.00 0.00 0.00 0.00 306 0.00 0.00 0.00 0.00 0.00 307 0.00 0.00 0.00 0.00 0.00 308 0.00 0.00 0.00 0.00 0.00 309 0.00 0.00 0.00 0.00 0.00 310 0.00 0.00 0.00 0.00 0.00 311 0.00 0.00 0.00 0.00 0.00 Period 301-312 0.00 0.00 0.00 Period 1-312 1,425,000.00 1,155,207.47 2,580,207.47 312 0.00 0.00 0.00 0.00 0.00 313 0.00 0.00 0.00 0.00 0.00 314 0.00 0.00 0.00 0.00 0.00 315 0.00 0.00 0.00 0.00 0.00 316 0.00 0.00 0.00 0.00 0.00 317 0.00 0.00 0.00 0.00 0.00 318 0.00 0.00 0.00 0.00 0.00 319 0.00 0.00 0.00 0.00 0.00 320 0.00 0.00 0.00 0.00 0.00 321 0.00 0.00 0.00 0.00 0.00 322 0.00 0.00 0.00 0.00 0.00 323 0.00 0.00 0.00 0.00 0.00 Period 313-324 0.00 0.00 0.00 Period 1-324 1,425,000.00 1,155,207.47 2,580,207.47 324 0.00 0.00 0.00 0.00 0.00 325 0.00 0.00 0.00 0.00 0.00 326 0.00 0.00 0.00 0.00 0.00 327 0.00 0.00 0.00 0.00 0.00 328 0.00 0.00 0.00 0.00 0.00 329 0.00 0.00 0.00 0.00 0.00 330 0.00 0.00 0.00 0.00 0.00 331 0.00 0.00 0.00 0.00 0.00 332 0.00 0.00 0.00 0.00 0.00 333 0.00 0.00 0.00 0.00 0.00 334 0.00 0.00 0.00 0.00 0.00 335 0.00 0.00 0.00 0.00 0.00 Period 325-336 0.00 0.00 0.00 Period 1-336 1,425,000.00 1,155,207.47 2,580,207.47 336 0.00 0.00 0.00 0.00 0.00 337 0.00 0.00 0.00 0.00 0.00 338 0.00 0.00 0.00 0.00 0.00 339 0.00 0.00 0.00 0.00 0.00 340 0.00 0.00 0.00 0.00 0.00 341 0.00 0.00 0.00 0.00 0.00 342 0.00 0.00 0.00 0.00 0.00 343 0.00 0.00 0.00 0.00 0.00 344 0.00 0.00 0.00 0.00 0.00
- 8. 345 0.00 0.00 0.00 0.00 0.00 346 0.00 0.00 0.00 0.00 0.00 347 0.00 0.00 0.00 0.00 0.00 Period 337-348 0.00 0.00 0.00 Period 1-348 1,425,000.00 1,155,207.47 2,580,207.47 348 0.00 0.00 0.00 0.00 0.00 349 0.00 0.00 0.00 0.00 0.00 350 0.00 0.00 0.00 0.00 0.00 351 0.00 0.00 0.00 0.00 0.00 352 0.00 0.00 0.00 0.00 0.00 353 0.00 0.00 0.00 0.00 0.00 354 0.00 0.00 0.00 0.00 0.00 355 0.00 0.00 0.00 0.00 0.00 356 0.00 0.00 0.00 0.00 0.00 357 0.00 0.00 0.00 0.00 0.00 358 0.00 0.00 0.00 0.00 0.00 359 0.00 0.00 0.00 0.00 0.00 Period 349-360 0.00 0.00 0.00 Period 1-360 $1,425,000.00 $1,155,207.47 $2,580,207.47