
Recommended
More Related Content
What's hot
What's hot (18)
Similar to Cap srtucture hotdebt
Similar to Cap srtucture hotdebt (20)
Recently uploaded
Recently uploaded (20)
Cap srtucture hotdebt
- 1. European Financial Management, Vol. 17, No. 1, 2011, 46–99 doi: 10.1111/j.1468-036X.2010.00549.x ‘Hot’ Debt Markets and Capital Structure John A. Doukas School of Business and Public Administration, Old Dominion University, Norfolk, VA 23529-0218, USA, and Judge Business School, University of Cambridge, Cambridge CB2 1AG, U.K. E-mail: jdoukas@odu.edu Jie (Michael) Guo Durham Business School, University of Durham, DH1 3LB, Durham, U.K. E-mail: jie.guo@durham.ac.uk Bilei Zhou Business School, Central South University, Changsha, 410083, P R. China . E-mail: bileizhou@msn.com Abstract This paper examines the motives of debt issuance during hot-debt market periods and its impact on capital structure over the period 1970–2006. We find that perceived capital market conditions as favourable, an indication of market timing, and adverse selection costs of equity (i.e., information asymmetry) are important frictions that lead certain firms to issue more debt in hot- than cold-debt market periods. Using alternative hot-debt market issuance measures and controlling for other effects, such as structural shifts in the debt market, industry, book-to-market, price-to-earnings, size, tax rates, debt market conditions and adjustment costs based on debt credit ratings, we find that firms with high adverse selection costs issue substantially more (less) debt when market conditions are perceived as hot (cold). Moreover, the results indicate that there is a persistent hot-debt market effect on the capital structure of debt issuers; hot-debt market issuing firms do not actively rebalance their leverage to stay within an optimal capital structure range. Keywords: hot debt markets, information asymmetry, capital structure, market timing JEL classification: G12, G14, G31, G32 We would like to thank an anonymous referee, Richard Heaney and participants at the 2009 Annual Meeting of the European Financial Management Association (EFMA) for helpful comments and suggestions. We also thank Jun Hua for valuable research assistance. A previous version of this paper was circulated under the title ‘The Impact of Debt Market Issuance on Capital Structure’. C 2010 Blackwell Publishing Ltd
- 2. ‘Hot’ Debt Markets and Capital Structure 47 1. Introduction Equity market timing has emerged as one of the primary factors that shape corporate capital structure decisions. Survey evidence in Graham and Harvey (2001) shows that market timing is a major concern of corporate executives: two-thirds of CEOs admit that timing considerations play an important role in financing decisions. In their seminal paper, Baker and Wurgler (2002) show that equity market timing is an important aspect of firms’ financial policies: they find that firms tend to raise external funds when their cost of equity capital (valuation) is temporarily low (high) and argue that this result is consistent with the view that capital structure is the cumulative outcome of past attempts to time the equity market.1 The persistent timing effects on leverage, reported in Baker and Wurgler (2002), challenge the conventional view of optimal capital structure and its determinants. Welch (2004) finds that equity price shocks also have a persistent effect on capital structure. Huang and Ritter (2005), using aggregate measures of market valuation, find evidence of a long-lasting market timing effect on capital structure. Using hot-cold market classification as the equity timing measure, however, Alti (2006) finds that the effect of market timing on leverage has very low persistence. Specifically, Alti’s empirical evidence shows that the negative impact of market timing on leverage reverses completely two years after IPO issuance, suggesting that capital structure policies, in the long run, seem to be more consistent with the pursuit of optimal leverage targets. Flannery and Rangan (2006) also question the longevity and economic significance of market timing. Similarly, Leary and Roberts (2005), accounting for adjustment costs, show that firms try to rebalance leverage in an attempt to stay within an optimal range. Notwithstanding the mixed empirical evidence, most of what is known about the impact of external financing on capital structure stems from IPO equity issues,2 even though debt financing plays an equally important role in shaping firm financing deci- sions. While IPOs are likely to be seriously influenced by market timing considerations, they represent capital structure decisions that occur only once in a firm’s life cycle. Further, IPOs are largely associated with relatively small, young firms characterised by high growth opportunities, not necessarily the most representative sample of firms to draw broad inferences about the effects of external financing on firm capital structure. The observed extremes in debt issue volume as a consequence of the clustering of debt issues in certain time periods, we refer to as ‘hot’-debt market periods, and its effects on capital structure have not been investigated despite the enormous corporate lever up in recent years.3 While debt-market timing has been addressed from the interest rate exposure perspective (Guedes and Opler, 1996; Barclay and Smith, 1995; Faulkender, 2005) and the debt maturity perspective (Baker et al., 2003; Butler et al., 2006), 1 In line with the evidence of Baker and Wurgler (2002), O’Brien et al. (2007) find that firms financing decisions (debt vs equity) are shaped by the degree of relative misevaluation in an attempt to increase shareholders’ wealth. 2 See Taggart (1977), Marsh (1982), Asquith and Mullins (1986), Jung et al. (1996) and Eckbo et al. (2000) for seasoned equity issues; Ritter (1991), Loughran et al. (1994), and Ibbotson et al. (1988, 1994), Baker and Wurgler (2002), Alti (2006), and Leary and Roberts (2005) for initial public offerings. 3 Global bond issuance was $7.5 trillion in 2007 while it dropped to $3.81 trillion in 2008 (Reuters, 23 December 2008). Todd (2007), shows that debt ratios have substantially increased for firms in 34 emerging markets and attributes this largely to the increased financial openness to foreign markets. C 2010 Blackwell Publishing Ltd
- 3. 48 John A. Doukas, Jie (Michael) Guo and Bilei Zhou yielding mixed results, the impact of hot-debt markets on capital structure remains unexplored.4 Moreover, no study has yet addressed the motives underlying the hot- debt issuance phenomenon despite the fact that a large number of firms in certain periods, as documented in this study, choose to turn to the debt market. Consequently, a related important research question is whether hot-debt markets have implications for firm capital structure; that is, whether the intention to exploit favourable debt market conditions relative to other forms of capital has an impact on capital structure. The importance of this issue cannot be overstated. If true, hot-debt issuance would imply that debt financing decisions are at variance with conventional financial policy and capital structure theories.5 Although equity undervaluation makes debt issuance appealing, the latter is not expected to be sensitive to investor beliefs as most buyers of corporate debt consist of banks, insurance companies, and pension funds that are unlikely to make naive investment decisions (e.g., Speiss and Afflect-Gtaves, 1999; Richardson and Sloan, 2008).6 If this is so, hot-debt market issuance is more likely to arise from managerial beliefs in the pursuit of opportunistic gains derived from switching between equity and debt markets (Baker and Wurgler, 2002). Since debt is not very sensitive to outside investor beliefs, managers may also choose to issue debt to avoid equity undervaluation that results from a difference in beliefs between managers and outside investors (asymmetry of information). This argument has its roots in Myers and Majluf’s (1984) view that asymmetric information results in adverse selection costs that are of sufficient magnitude to force firms to time their debt issues for periods when the level of information asymmetry is high. Accordingly, managers’ desire to avoid the adverse selection costs of equity or take advantage of a ‘debt financing window’ could motivate the selling of debt issues.7 To date, there is no empirical evidence documenting whether the existence of hot-debt issuance is linked to time-varying asymmetric information costs. This paper attempts to fill this void by investigating whether the decision to issue debt in hot-market periods is associated with adverse selection costs of equity. If information costs are a major deterrent to equity issuance, then periods of increased information costs should be periods of relatively high debt issue volume. This paper seeks to determine the motives of debt issuance in hot-debt market periods and the impact of hot-debt issuance on capital structure. Specifically, the focus of investigation is on the role of capital market conditions and adverse selection costs of 4 Faulkender (2005), in contrast with the standard textbook treatment of interest rate risk management, or the matching hypothesis that firms match the risk exposure of their debt to that of their assets, shows that the final interest rate exposure of newly issued debt is largely driven by the slope of the yield curve at the time of debt issuance, suggesting that interest rate risk management practices are primarily driven by speculation rather than by hedging considerations. 5 While there is no consensus in the literature about the real meaning of managerial market timing (Barry et al., 2005), market timing in the context of this study refers to the clustering of debt issues or ‘hot’ debt market periods. 6 Additional evidence, available upon request, from post issue calendar time portfolio returns for hot-market and cold-market issuing firms, confirms that debt market timing is not related to investor beliefs as hot-market issuers’ post-debt issuance long term alphas are indistinguishable from zero. 7 Huyghebaert and Van de Gucht (2007) find that high adverse selection problems determine the debt issuance patterns of start-up firms due to lack of prior history and reputation. C 2010 Blackwell Publishing Ltd
- 4. ‘Hot’ Debt Markets and Capital Structure 49 equity on the financing decision of the firm during hot-debt market periods. Focusing on debt issue events and identifying hot- and cold-debt market periods, this study attempts to examine the behaviour of hot- versus cold-market debt issuing firms and to shed light on the hot-debt issuance effects of capital structure. To examine these issues we concentrate on corporate debt issues, as a single financing event, in an effort to capture hot debt-market issuance and its influence on capital structure. The hot-debt market issuance measures used in this study are based on whether debt financing takes place in a hot (cold) issue market environment, characterised by a high (low) aggregate volume (number of deals) of debt issues. Consistent with previous studies, we find that capital market conditions play an important role in explaining the phenomenon of corporate debt issuance waves.8 Specifically, the results show that the aggregate volume of debt issuance is related to exogenous macro-factors in both equity and debt markets. Second, our findings provide evidence that debt financing decisions are influenced by the adverse selection costs of equity at the firm level. Put differently, when equity is out of favour firms engage in debt-financing (i.e., issue less information sensitive securities). This suggests that when a particular firm characteristic is in doubt (i.e., equity due to adverse selection costs) firms endowed with that characteristic engage in debt financing, especially when debt market conditions are more favourable. Third, using alternative hot-market measures and controlling for other effects, we show that the impact of hot-debt issuance on corporate debt financing is substantial. We find that hot-debt market firms, identified as firms issuing debt when the debt market is hot, with high adverse selection costs issue significantly more debt than do cold-debt market firms. Specifically, although the pre-issue leverage between hot- and cold-debt market issuers does differ considerably, hot-debt issuing firms having higher pre-issue leverage issue significantly higher levels of debt than do cold-debt issuing firms. The excess debt issuance of hot-debt market issuers is not induced by debt capacity, profitability, growth, or investment opportunity considerations. Interestingly, credit ratings indicate that hot-market firms are not riskier than cold-market firms. Hence, firms’ debt issuance differences between cold- and hot-debt market periods do not reflect differences between investment-grade and below investment-grade issuers. Fourth, the results indicate that there is a persistent hot-debt issuance effect on the capital structure of debt issuers that lasts more than five years after the hot-debt issue year. We investigate how firms adjust their capital structure over long-term periods when debt ratios apparently deviate from normal levels due to hot- debt market clustering. The evidence shows that hot-debt market issuing firms do not actively rebalance their leverage to stay within an optimal capital structure range. This financing behaviour is inconsistent with the trade-off theory of capital structure. Finally, the persistence revealed in our empirical tests is robust to several checks, inclusive of an alternative hot-market measure, structural shifts in the debt market, industry, book-to- market, price-to-earnings, size, tax rates, debt market conditions, and adjustment costs based on debt credit ratings. 8 Some studies reveal that financing occurs in waves over time, For example, Korajczyk and Levy (2003) look at leverage decisions and macroeconomic conditions and one of their findings suggests that unconstrained firms time debt issuance during periods of favourable macroeconomic conditions. Also, Gomes and Phillips (2007) examine financing choices over time and argue that measures of asymmetric information are important in determining the choice of security issuance. Dittmar and Dittmar (2008) argue that financing waves are the result of changes in the underlying economic fundamentals rather than misvaluation. C 2010 Blackwell Publishing Ltd
- 5. 50 John A. Doukas, Jie (Michael) Guo and Bilei Zhou This study contributes to the literature in several ways. Despite the fact that debt issuance plays an equally important role in firm financing decisions, little is known about hot-debt issuance and its effects, if any, on capital structure. This is the first study to examine the short- and long-term effects of hot-debt issuance on capital structure by focusing on debt financing issues. We document systematic differences between the financial policies of hot-debt and cold-debt issuing firms. We argue that the observed excessive debt issuance in hot-market periods by certain firms is consistent with the implications of hot-debt capital being cheaper than its equity counterpart due to adverse selection costs (information asymmetry costs). Second, this study shows that changes in capital market conditions and information asymmetry costs are two important frictions that lead certain firms to issue debt than equity. The study of debt financing decisions in response to perceived market conditions yields additional insights into the subjective judgment of managers in their financing decisions. Third, examining the effects of hot- debt issuance on capital structure allows us to draw inferences from a considerably larger sample of firms than relying on a sample of IPO firms which might skew the results. Focusing on the equity financing decisions of IPO firms to learn about its capital structure implications and whether managers behave in line with the predictions of conventional capital structure theories after the issue year, is rather precarious because the equity financing of IPO firms is also associated with the decision to become a publicly traded corporation while debt issuance by public corporations represents a purely financing decision. The rest of the paper is organised as follows. Section 2 describes the data, sample construction and descriptive statistics. Section 3 examines whether the ‘hot’ debt market phenomenon is associated with (i) changes in the capital market environment and (ii) asymmetric information, controlling for other factors that might motivate firms to issue debt during ‘hot’ debt market periods. Section 4 examines the short- and long-term effects of ‘hot’ debt market effect on capital structure. Section 5 reports a series of robustness checks. Section 6 concludes. 2. Data and Descriptive Statistics 2.1. Data, sample selection and descriptive statistics The original sample consists of all new, nonconvertible, public bond issues from 1 January 1970 to 31 December 2006 in the US markets, as reported by Securities Data Company (SDC) in the Thompson Financial SDC new issues database. The data contain information on issue date, identity and characteristics of borrowers such as their industry and nationality, along with various bond issue characteristics such as proceeds in nominal dollars. Debt issues from non-US firms and financial firms (SIC code between 6000 and 6999) were excluded from the sample. Multiple issues by the same firm in a given month were consolidated into one issue, and the proceeds were aggregated. The sample excludes debt issues with nominal proceeds of less than 1 million US dollars. The initial sample contained 7,241 corporate debt issues. Furthermore, the sample was restricted to those firms for which COMPUSTAT accounting data were available for the last fiscal year prior to the debt issue. All the accounting data are from COMPUSTAT and they end in fiscal year 2006. Finally, this screening produced 6,110 firm-year debt issue observations. C 2010 Blackwell Publishing Ltd
- 6. ‘Hot’ Debt Markets and Capital Structure 51 2.2. Variable definitions We use a number of variables to proxy macroeconomic and capital market conditions. The real short-term interest rate (Rst − π) is defined as the 3-month Treasury bill rate, Rst , minus the actual monthly inflation rate, π. The term spread (Rlt − Rst ) is defined as the difference between 10-year Treasury bond rate and 3-month Treasury bill rate. The risk spread (Rct − Rlt ) is defined as the difference between Moody’s Seasoned Baa corporate bond yields and 10-year Treasury bond rates. Rs&p500 represents the monthly returns of S&P 500 index as the equity market returns. P/E denotes the monthly changes in price-earnings ratio of S&P 500 index. USCI is the US coincident index, a comprehensive summary measure of US economic conditions made up of coincident indicators of the US economy including measures of production, employment, income and sales, produced by Economic Cycle Research Institute. In terms of accounting data, variables used in the analysis are defined as follows.9 Book debt, D, is defined as the total liabilities (COMPUSTAT item 181) and preferred stock (Item 10, replaced by the redemption value of preferred stock (item 56) if missing), minus deferred taxed (Item 35) and convertible debt (Item 79). Book equity, E, refers to the total assets (Item 6), minus book debt. Book leverage, D/A, is then defined as book debt divided by total assets. Firm-year observations where the book leverage exceeded 100% were dropped. Market-to-book ratio, M/B, is book debt plus market equity (common shares outstanding (Item 25) times share price at fiscal year-end (Item 199), divided by total assets). Consistent with Baker and Wurgler (2002) observations with M/B exceeding 10.0 were dropped. The net debt issues, d/A, variable represents the change in book debt over total assets, A. The net equity issues, e/A, variable is the change in book equity, minus the change in retained earnings (Item 36). RE/A is defined as the change in retained earnings relative to total assets. EBITDA/A, firm profitability measure, is earnings before interest, taxes, and depreciation (Item 13) over total assets. SIZE is the logarithm of net sales (Item 12) in millions of 2006 US dollars. Asset tangibility, PPE/A, is defined as net plant, property, and equipment (Item 8). R&D/A is the research and development expense (Item 46, replaced by zero when missing). In our regression analysis, dummy variable RDD takes the value of 1 when Item 46 is missing. INV/A denotes capital expenditures (Item 128). DIV/E is common dividends (Item 21) divided by the year-end book equity. CASH/A refers to cash and short-term investments (Item 1). The variables d/A, e/A, RE/A, EBITDA/A, PPE/A, R&D/A, INV/A, and CASH/A are normalised by fiscal year-end total assets and are measured in percentage terms. We remove firm-year observations from the sample when d/A, e/A, RE/A, EBITDA/A, INV/A, or DIV/E exceed 100% in absolute value. 2.3. Summary statistics Table 1 reports summary statistics of firm characteristics and financial decisions. All variables with the exception of SIZE are expressed in percentage terms. The analysis is organised with respect to debt issue time. Specifically, the issue year refers to the fiscal 9 These variable definitions are in line with those of Alti (2006), who examined the market timing of hot IPO issues. C 2010 Blackwell Publishing Ltd
- 7. C 52 Table 1 Summary statistics of firm characteristics and financing decisions This table reports the means and standard deviations of various firm characteristics for the period around the hot-debt issue year. The sample of US non-financial corporate debt issues was generated from the Thompson SDC Bond Issue database covering the period January 1970 – December 2006. The sample consists of all corporate debt issuers, with accounting data for the pre-issue year available in COMPUSTAT. The last year of COMPUSTAT data used is 2006. The issue year refers to the fiscal year in which the corporate debt issue took place. Issue year + k is the kth fiscal year after the debt was issued. All variables except SIZE are 2010 Blackwell Publishing Ltd in percentage terms. Book Leverage, D/A, is the ratio of book debt to total assets (Book debt, D, defined as total liabilities, and preferred stock, minus deferred taxed and convertible debt). Market-to-book ratio, M/B, denotes book debt plus market value of equity divided by total assets. Net debt issues, d/A, is the change in book debt. Net equity issues, e/A, is the change in book equity minus the retained earnings. Retained earnings are measured by RE/A. Profitability is measured by EBITDA/A, which is earnings before interest, taxes, and depreciation. SIZE is the logarithm of net sales in millions of 2001 dollars. Asset tangibility, PPE/A, is refers to net plant, property, and equipment. R&D/A is research and development expense. INV/A is capital expenditure. DIV/E is common dividends divided by year-end book equity. CASH/A denotes cash and short-term investments. The variables d/A, e/A, RE/A, EBITDA/A, PPE/A, R&D/A, INV/A, and CASH/A are normalised by the fiscal year-end total assets. No. of Observations D/A M/B d/A e/A RE/A EBITDA/A SIZE PPE/A R&D/A INV/A DIV/E CASH/A Pre-issue 6110 Mean 60.08 120.08 – – 2.52 14.26 7.41 56.99 0.90 8.83 4.72 3.48 SE [18.26] [75.42] – – [7.31] [7.33] [1.77] [27.06] [2.13] [7.31] [44.79] [5.58] Issue year 6049 Mean 61.78 120.83 1.71 0.56 2.16 13.59 7.52 56.33 0.88 8.68 4.92 3.72 SE [17.87] [73.76] [9.54] [11.2] [6.41] [6.41] [1.71] [26.99] [2.1] [7.09] [25.54] [5.98] Issue year + 1 5860 Mean 62.08 119.76 0.52 0.17 2.07 13.49 7.63 56.26 0.87 8.28 4.75 3.55 SE [18.46] [74.02] [7.82] [11.11] [6.26] [6.47] [1.67] [26.88] [2.07] [6.66] [34.11] [5.51] Issue year + 2 5650 Mean 62.29 118.38 0.53 −0.11 1.99 13.39 7.72 56.08 0.86 7.84 5.82 3.54 SE [19.01] [78.68] [7.47] [11.55] [6.31] [6.62] [1.64] [26.82] [2.03] [5.8] [33.84] [5.39] John A. Doukas, Jie (Michael) Guo and Bilei Zhou Issue year + 3 5479 Mean 62.42 118.13 0.43 −0.25 1.99 13.39 7.79 55.98 0.86 7.61 4.92 3.62 SE [20.41] [78.63] [9.17] [11.77] [6.44] [6.7] [1.62] [26.75] [2.08] [5.45] [37.97] [5.33] Issue year + 4 5309 Mean 62.32 118.82 0.17 0.31 2.00 13.48 7.87 55.80 0.86 7.34 5.36 3.84 SE [21.3] [80.89] [9.54] [26.03] [6.5] [6.39] [1.61] [26.71] [2.04] [5.21] [22.73] [5.58] Issue year + 5 5153 Mean 62.11 120.49 0.27 0.09 1.99 13.29 7.94 55.57 0.87 7.16 6.16 3.92 SE [22.2] [82.07] [11.28] [26.9] [6.65] [7.89] [1.6] [26.7] [2.11] [5.04] [59.25] [5.61]
- 8. ‘Hot’ Debt Markets and Capital Structure 53 year in which the debt issue was conducted. The issue year+k is the kth fiscal year after the debt issue. We note that sample size declines from 6,110 to 5,153 during six years after debt issuance. This could be attributed to bankruptcies or mergers and acquisitions of debt issuers. It could be argued that the sample is, to some extent, subject to ‘survivor bias’ because of the exclusion of the ‘dead’ firms that disappeared from the sample over time. However, only about 3% of debt issuers disappear from the sample per year after the debt issue year, which is not unreasonable in a large sample of firms. The mean book-leverage ratio, D/A, for the total sample varies from 60.08% in the pre-issue year to 62.11% six years after the pre-issue year. The highest change in book leverage occurs in the debt issue year (1.70%) and remains fairly stable at around 62% thereafter. Accordingly, new issuance of debt and equity during this period is consistent with the pattern of changes in leverage. In the issue year, the percentage of net debt issuance, d/A, was 1.71%, on average, which is identical to the change in the mean book leverage of the entire sample. While net debt issuance in the following years declines sharply, it exceeds the net equity issuance during the post-debt issue period. Retained earnings decline significantly in the debt issue year, but remain relatively stable in succeeding years at the 2% level. Profitability, EBITDA, exhibits a similar pattern. Firm size increases somewhat with age, whereas tangible assets decline during the five-year period after the debt issue year. While R&D expenses decline in the debt issue year, no substantive variation is found in subsequent years. However, an interesting pattern emerges in Table 1: the investment rate of debt issuers decreases from 8.83% in the pre-issue year to 7.16% five years later. This seems to suggest that debt issuance is not driven by the investment opportunities (needs) of debt issuers. By contrast, increases in dividend payments (from 4.72% in pre-issue year to 6.16% in year+5) and cash (from 3.48% in pre-issue year to 3.92% in year+5) during the post-debt issue five-year period appear to suggest that debt-issuing firms raise dividend payments while cash balances rise with the infusion of new capital in subsequent years. The rise in dividend payouts suggests that managers of hot-debt issuing firms raise dividends to preserve pre-issue equity valuation, as indicated by the relatively stable 5-year post-issue period M/B ratio and drop in profitability, EBITDA. 2.4. Hot-debt markets and corporate debt financing Debt financing during hot-debt market periods has received no attention in the capital structure literature. Most importantly, the motives of hot-debt issuance and its impact on capital structure remain unknown. To examine whether firms time their debt raising activities, we develop a hot-cold market measure by defining hot- and cold-debt markets on the basis of monthly volume of debt issues.10 The initial SDC sample, prior to imposition of the COMPUSTAT data requirements, is employed to determine the number and volume of debt issues for each month during the January 1970–December 2006 period. Following Helwege and Liang (2004), and Alti (2006), a three-month centred moving average of debt issue volume for each month is estimated in constant dollars, measured as of 1 December 2006 to smooth out any seasonal variation. The advantage of a moving average is that it avoids seasonal considerations for debt issue waves 10 Bayless and Chaplinsky (1996), in the context of IPOs, also use volume to identify hot- and cold-markets. C 2010 Blackwell Publishing Ltd
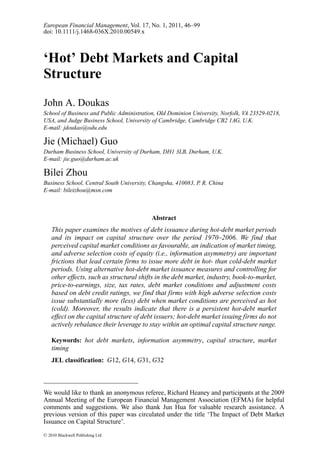
- 9. 54 John A. Doukas, Jie (Michael) Guo and Bilei Zhou Fig. 1. Time series of the detrended monthly debt issue volume Figure 1 plots the cumulative monthly issue volume and deals of corporate debt issues, and high- investment grade debt (A-grade or above of Moody’s rating) and low-investment grade debt (below A-grade of Moody’s rating) monthly issue volume for the period January 1970 – December 2006 in constant dollars measured as of 1 December 2006. The monthly volume and deal numbers of debt issues are adjusted by a 3-month detrended moving average to smooth out seasonal variations. The horizontal dash line and point-dash line denote the top and bottom 30% of monthly debt issue volume, measured as of 1 December 2006 across the sample period, which are used to define the hot- and cold-debt market, respectively. and economic conditions become exogenous determinants of the hot-debt windows of opportunity. Hence, a hot-market based measure is used to capture the hot-debt issuance effects of debt on capital structure. After counting the three-month moving average, the maximum monthly issue volume during the sample period was 24.57 billion in 2006 US dollars, and the minimum volume was 1.73 billion in 2006 US dollars. Hot (cold) months were, then, defined as those that ranked in the top (bottom) 30% of all months in the sample with respect to distribution of detrended monthly moving average debt issue volume. We create a dummy variable, HOTD, that takes the value of 1 when an individual debt is issued during a hot month, and zero if the debt was issued in a cold month. This hot-cold dummy, then, is our main focus in measuring firms’ hot-debt issuance (debt market timing) attempts.11 Figure 1 plots the cumulative monthly issue volume and deals of corporate debt issues, and high-investment grade debt (A-grade or above of Moody’s rating) and low- investment grade debt (below A-grade of Moody’s rating) monthly issue volume for the period January 1970–December 2006 in constant dollars measured as of 1 December 11 For robustness purposes, we construct an alternative HOTD, a dummy variable, and replicate the analysis in Section 5. C 2010 Blackwell Publishing Ltd
- 10. ‘Hot’ Debt Markets and Capital Structure 55 2006. The horizontal point dash line represents the bottom 30 percentile ranked by monthly volume of debt issues at 5,616 million in 2006 dollars, while the horizontal dash line denotes the top 30 percentile at 10,130 million in 2006 dollars. As this figure illustrates, the hot and cold months differ substantially in terms of cumulative volume and corresponding number of debt issues. From the whole sample of 6,110 debt issues, 3,082 issues occurred in hot months (50.4% of the sample) while 889 issues (14.5% of the sample) took place in cold months. This suggests that more firms issue debt when debt issuance activity is unusually high. Some studies have used an alternative measure to identify hot-cold markets by relying on the number of monthly debt issue deals, which we also plot in Figure 1 for comparison. Interestingly, Figure 1 shows that there is little qualitative and quantitative difference between these two measures. The two measures closely match each other numerically (3,227 debt issues during hot months and 845 during cold months) and graphically. While in this study we employ the cumulative volume of monthly debt issues first to define hot- and cold-markets and then construct our hot-markets measure, we also check the robustness of our results using a hot-markets measure based on the number of monthly debt issue deals.12 An obvious pattern that becomes apparent in Figure 1 is that corporate debt issue clusters are denser in the post–early-1980s period than in previous years of the sample, which, to some extent, coincide with below-investment grade debt (below A-grade of Moody’s rating) issue volume peaks and structural changes in the debt market that occurred in the early 1980s. In addition, the post-1982 period witnessed a dramatic rise in share repurchases. Therefore, to ensure that our results are not sensitive to this pattern of debt issue clusters, we examine the impact of hot-debt issuance on capital structure for the pre- and post-1982 period separately (see the section on robustness checks). 3. Determinants of ‘Hot’ Debt Market Issuance 3.1. Debt issue waves and capital market conditions A number of recent studies indicate that debt issuance decisions are driven by debt market conditions (e.g. Baker et al., 2003; Faulkender, 2005). If market conditions play an important role in shaping the debt issuance of hot-debt firms, one would expect them to exhibit greater sensitivity to debt market conditions than that of cold-debt firms. To examine the sensitivity of corporate hot- versus cold-debt issuance to debt market conditions, we study the relation between corporate debt issuance, Dt, and debt market conditions captured by the actual inflation rate, (π), defined as the percentage change in the US consumer price index (CPI), realised real short-term rate (Rst − π), defined as the 3-month Treasury bill rate minus the actual inflation, and the term spread (Rlt − Rst ), defined as the difference between the 10-year Treasury bond yield and 3-month 12 Our results, available upon request, remain unchanged when we use the hot-cold market measure based on the number of debt issues. While the deal based hot-cold market measure captures the extent to which the debt market is hot or not as well, the choice for the volume based hot-cold market measure was mainly dictated because it has the advantage that macroeconomic conditions become exogenous determinants of hot windows of debt market opportunities. Second, because if managers believe the debt market is favourable, they would tend to time the market by issuing abnormally high volumes of debt and, therefore, it is more likely to reflect managers’ market timing intentions than the number of deals. C 2010 Blackwell Publishing Ltd
- 11. 56 John A. Doukas, Jie (Michael) Guo and Bilei Zhou Treasury bill return, as suggested in the literature.13 The estimated regression takes the following specification: Ln(Dt ) = a + b1 ∗ (Rst − π) + b2 ∗ (Rlt − Rst ) + b3 ∗ (Rct − Rlt ) + b7 ∗ τ + εt (1a) Meanwhile, there is no reason to believe that equity and debt market conditions are irrelevant. Hence, we assume that the variation of equity market environment may have an impact on corporate debt issuance. Accordingly, the equity market conditions are also examined. We involve the monthly return and the change in the price-earnings ratio of S&P 500 index as the equity market index, as well as the US coincidence index (USCI) as a measure of the US economic cycle in the regression (1b). Ln(Dt ) = a + b4 ∗ (Rs&p500 )t + b5 ∗ ( P/E)t + b6 ∗ USCIt + b7 ∗ τ + εt (1b) Finally, a multivariate examination involving both equity and debt market conditions is conducted by estimating regression (1c). Ln(Dt ) = a + b1 ∗ (Rst − π) + b2 ∗ (Rlt − Rst ) + b3 ∗ (Rct − Rlt ) + b4 ∗ (Rs&p500 )t + b5 ∗ ( P/E)t + b6 ∗ USCIt + b7 ∗ τ + εt (1c) where τ is the time trend of debt issuance level over the sample period. Table 2 reports the regression results. Panel A (B) lists the sensitivity of aggregate monthly deals (volume) of debt issuance to market conditions. In line with the view that a steep yield curve is less likely to be correlated with subsequent economic recession (Estrella and Mishkin, 1996), where firms face low probability of distress and the cost of bearing interest rate volatility may thus be lower, the positive and statistically significant relationship between the aggregate debt issuance and the term spread indicates that more firms issue debt in anticipation of improving economic conditions (i.e., non-recessionary periods). This result is consistent with the evidence of Faulkender (2005) and Antoniou et al. (2009). Another interpretation of the positive association between debt issuance and the term spread, documented in the survey of Graham and Harvey (2001), is that managers tend to issue debt when they expect the long-term rate to decline in the future. Since the maturity of most corporate public debt is longer than one year, we do not see an obvious increase or decrease of debt issue deal numbers corresponding to the variation of the real short-term rate (Panel A). The negative coefficients of the real short-term rate, however, as shown in Panel B, suggest that, at the aggregate level, less debt is issued when the short-term rate increases. On the other hand, debt issuance is also influenced by the variations of equity market conditions as demonstrated by the negative relation between debt issuance and the S&P 500 index, as a proxy of equity market returns. Moreover, overvaluation in the equity market, proxied by the change in price-earnings ratio of S&P 500 index, induces a decrease in debt issuance. Following Baker et al. (2003) this result seems to suggest that firms time capital markets by issuing overvalued equity and repurchasing undervalued equity. Contrary to the cyclical nature of equity issuance, the negative sign of USCI suggests that hot-debt issuance is countercyclical and inversely related to economic activity. In sum, the debt issuance waves appear to be associated with both equity and debt market changes and the intention of managers to time the capital markets. 13 See Baker et al. (2003) for a similar regression specification and variable definitions. C 2010 Blackwell Publishing Ltd
- 12. C Table 2 Corporate debt issuance and market conditions This table reports regression estimates of the total debt issues Dt on debt and/or equity market condition factors. Ln (Dt ) = a + b1 ∗ (Rst − π ) + b2 ∗ (Rlt − Rst ) + b3 ∗ (Rct − Rlt ) + b7 ∗ τ + εt 2010 Blackwell Publishing Ltd Ln (Dt ) = a + b4 ∗ (Rs&p500 )t + b5 ∗ ( P/E)t + b6 ∗ USCIt + b7 ∗ τ + εt Ln (Dt ) = a + b1 ∗ (Rst − π ) + b2 ∗ (Rlt − Rst ) + b3 ∗ (Rct − Rlt ) + b4 ∗ (Rs&p500 )t + b5 ∗ ( P/E)t + b6 ∗ USCIt + b7 ∗ τ + εt Total debt issues consists of all debt issues generated from SDC. The sample spans the 1970 to 2006 period (444 months) and it is sorted by the number of deals, Ln(Dn), and the monthly deal volume, Ln(Dv), respectively. The real short-term interest rate (Rst − π ) is defined as the 3-month Treasury bill rate, Rst , minus the actual the monthly inflation rate, π . The term spread (Rlt − Rst ) is defined as the difference between 10-year Treasury bond yield and 3-month Treasury bill rate. The risk spread (Rct − Rlt ) is defined as the difference between Moody’s Seasoned Baa corporate bond yields and 10-year Treasury bond rates. Rs&p500 represents the monthly returns of S&P 500 index as the equity market returns. P/E denotes the monthly changes in price-earning ratios of S&P 500 index. USCI is the US coincident index (a comprehensive summary measure of U.S. economic conditions made up of coincident indicators of the U.S. economy including measures of production, employment, income and sales, produced by Economic Cycle Research Institute). τ is the trend of debt issuance level over the sample period. Panel A shows the aggregate monthly deal numbers of debt issuance (natural log). Panel B shows the aggregate monthly deal volumes of debt issuance (natural log). t-statistics are hetoroskedasticity and auto-correlation robust for time-series dependence up to 2 lags. Rst − π Rlt − Rst Rct − Rlt (Rs&p500 )t ( P/E)t USCIt τ Constant Ln(Dt) Obs. b1 [t] b2 [t] b3 [t] b4 [t] b5 [t] b6 [t] b7 [t] a [t] R-Square Panel A: Aggregate monthly deal numbers of debt issuance ‘Hot’ Debt Markets and Capital Structure Ln(Dn) 444 0.001 [0.07] 0.065 [3.17] 0.199 [4.2] 0.002 [7.85] 2.632 [26.3] 0.218 444 −0.012 [−1.91] −0.126 [−3.91] −0.026 [−3.06] 0.002 [10.8] 3.113 [57.8] 0.280 444 0.002 [0.157] 0.062 [3.03] 0.089 [1.62] −0.009 [−1.39] −0.136 [−4.23] −0.018 [−1.68] 0.002 [9.56] 2.848 [23] 0.309 Panel B: Aggregate monthly volumes of debt issuance Ln(Dv) 444 −0.038 [−3.26] 0.023 [1.05] 0.224 [4.42] 0.002 [8.74] 7.979 [74.4] 0.221 444 −0.008 [−1.17] −0.115 [−3.26] −0.040 [−4.31] 0.002 [9.49] 8.502 [144] 0.243 444 −0.038 [−3.04] 0.034 [1.54] 0.143 [2.37] −0.004 [−0.57] −0.139 [−3.94] −0.014 [−1.21] 0.002 [9.04] 8.144 [60] 0.278 57
- 13. 58 John A. Doukas, Jie (Michael) Guo and Bilei Zhou 3.2. Information asymmetry Another important underlying determinant of firms’ financing decisions is the level of information asymmetry at the time debt capital is raised. Myers and Majluf (1984), who argue that investors use firm-specific information about the issuing firm to condition their assessment of the motivation to issue, suggest that firms are likely (unlikely) to issue debt (equity) in periods when asymmetric information is high. Firms with high asymmetry of information costs will be subject to high adverse selection costs of equity and therefore reluctant to issue equity. Consequently, to avoid the adverse selection costs of equity firms with growth prospects will turn into the debt markets and try to take advantage of a ‘debt financing window’ by issuing debt. To assess the magnitude of the adverse selection costs of hot- and cold-debt issuers we use the stock price synchronicity, SYNCH, which measures the amount of market-wide information relative to the firm- specific information (French and Roll, 1986; Roll, 1988; Morck et al., 2000) embedded into stock prices. The stock price synchronicity is the residual sum of squares from a market model regression of monthly stock returns for 48 months prior to issue.14 A lower SYNCH indicates that a larger amount of firm-specific information is used by investors to value equity (future cash flows). When it is more difficult for investors to observe firm-specific information (i.e., higher idiosyncratic risk) the adverse selection costs of equity increase as investors are constrained to infer the true value of the firm from market-wide information only. As a result, the adverse selection cost of equity which is negatively related to the proportion of firm-specific information is of sufficient magnitude to force firms to resort to debt financing. Hence, to the extent that adverse selection costs deter equity issuance the adverse selection costs of equity hypothesis predicts a positive relation between SYNCH and leverage. We use two related measures of market-wide information relative to the firm-specific information estimated from the market model regression. The first, SYNCH1, is the stock’s beta (β), which measures the responsiveness of the stock’s return to market- wide information (market returns). The second, SYNCH2, is the R2 from the market model regression, which mirrors the fraction of variation in stock returns explained by market returns. Because the R2 is bounded between zero and one, we estimate this price synchronicity measure by taking its logit-transformation, ln(R2 /(1 − R2 )). Further to the analysis of hot-debt issuance in response to capital market conditions, documented earlier, at the aggregate level, we examine now the association between information asymmetry costs and the probability of debt issuance in hot- vs cold- debt markets, accounting for capital market conditions by estimating the following regression: HOTD = a + b1 ∗ SYNCH + b2 ∗ (Rst − π) + b3 ∗ (Rlt − Rst ) + b4 ∗ (Rct − Rlt ) + b5 ∗ (Rs& p500 )t + b6 ∗ ( P/E)t + εt (2) The HOTD is a binary variable that takes the value of 1 if debt is issued during a hot-debt market period and zero if debt is issued during a cold market period. Hot (cold) debt markets are defined as the months with an aggregate debt issue volume ranking on 14 Ng et al. (2009) show that the conventional interpretation of how adverse selection, relying on measures developed in the microstructure literature, manifests in capital markets is misspecified. The stock price synchronicity measure, however, employed in this study is unlikely to suffer from this criticism since it has a more direct link with firm performance. C 2010 Blackwell Publishing Ltd
- 14. ‘Hot’ Debt Markets and Capital Structure 59 top (bottom) 30% of the period from 1970 to 2006, with a sample of 3825 observations generated from SDC bond issue database. The control variables are the same as in equation (3). In brief, if adverse selection costs are a major deterrent to equity issuance, then periods of increased information costs should coincide with periods of relatively high debt issues and, therefore, a positive relation is expected to emerge between HOTD and SYNCH in regression (2). Table 3 reports the results for two measures of synchronicity. Consistent with the asymmetry of information hypothesis, the positive and statistically significant coefficient of synchronicity measures suggests that ‘hot’ debt issuance occurs when firms’ adverse selection costs of equity are high. The regression results confirm that when equity is out of favour due to high adverse selection costs, firms engage in debt-financing (i.e., issue less information sensitive securities). This also demonstrates that when a particular firm characteristic is in trouble (i.e., equity due to adverse selection costs) firms endowed with that characteristic engage in debt financing, especially when debt market conditions are more favourable. In addition, the regression results show that the control variables, capturing market conditions, exhibit the same pattern as in Table 2. The yield and the risk spreads appear to rise during hot-debt market periods. More importantly, the negative coefficients of equity market returns and the change in the P/E ratio suggest that low equity returns and equity undervaluation (i.e., unfavourable equity market conditions) induce firms to resort to debt financing. Overall, the evidence indicates that hot-debt market periods occur when firms’ equity is out of favour due to high information asymmetry costs. Hot-debt issuance appears to be associated with managerial efforts intended to reduce or avoid firm’s adverse selection costs. 3.3. Financial characteristics of hot- and cold-debt market issuers Now we examine a set of firm-specific characteristics that are likely to influence managers’ decision to issue debt during hot-debt market periods. Panel A of Table 4 reports mean values of hot- and cold-debt issuing firm financial characteristics prior to debt issuance, including leverage ratio (D/A), market-to-book ratio (M/B), retained earnings (RE/A), size (SIZE), tangible assets (PPE/A), R&D expense (R&D/A), capital expenditure (INV/A), dividend payout (DIV/E), and free cash (CASH/A). With the exception of size, market-to-book ratio and dividend payout, all variables are standardised with firm assets. The t-values of mean differences, based on one-tail mean comparison tests with unequal variance, are also shown in brackets. The financial characteristics of hot- and cold-market debt issuers indicate that they differ significantly in several ways. Hot-debt market issuers appear to be firms larger in size and with higher profitability than cold-market issuers. In line with Stoughton et al. (2001) and Benverniste et al. (2002), the evidence also shows that hot-debt market issuers have higher growth opportunities (i.e., market-to-book ratio and R&D expenses). However, the tangible assets, retained earnings and investment rates of hot-market debt issuing firms are relatively lower than those of cold-market debt issuers. No distinct differences are observed with respect to dividend payout policy and cash balances. Panel B of Table 4 shows that hot-debt issuers have higher leverage (D/At ), growth opportunities (Q Ratio), credit rating (High Credit Rating) and are less financially constrained, based on estimates of the KZ index of Kaplan and Zingales (1997), than C 2010 Blackwell Publishing Ltd
- 15. C 60 Table 3 Asymmetric information, market conditions and corporate debt issuance in the hot-cold markets 2010 Blackwell Publishing Ltd This table reports regression estimates of the probability of corporate debt issues happening in the hot or cold debt markets with the influences of asymmetric information and a series of exogenous debt and/or equity market condition factors. The dependent variable, HOTD, is a dummy variable of the hot-cold debt market, taking value on I if the debt was issued during the hot debt market, and zero if during the cold market. The hot (cold) debt markets are defined as the months with an aggregate debt issue volume ranking on top (bottom) 30% of the period from 1970 to 2006, with a sample of 3825 observations generated from SDC bond issue database. HOTD = a + b1 ∗ SYNCH + b2 ∗ (Rst − π ) + b3 ∗ (Rlt − Rst ) + b4 ∗ (Rct − Rlt ) + b5 ∗ (Rs&p500 )t + b6 ∗ ( P/E)t + εt SYNCH denotes the synchronicity of the equity prices to the market (i.e., indicates the amount of firm-specific information is used by investors to value equity). SYNCH1, is the stock’s beta (β), which measures the responsiveness of the stock’s return to market-wide information (market returns). SYNCH2, is the stock price synchronicity based on logit-transformation of R2 : ln(R2/(1 − R2)).The real short-term interest rate (Rst − π ) is defined as the 3-month Treasury bill rate, Rst , minus the actual the monthly inflation rate, π . The term spread (Rlt − Rst ) is defined as the difference between 10-year Treasury bond yield and 3-month Treasury bill rate. The risk spread (Rct − Rlt ) is defined as the difference between Moody’s Seasoned Baa corporate bond yields and 10-year Treasury bond rates. Rs&p500 represents the monthly returns of S&P 500 index as the equity market returns. P/E denotes the monthly changes in price-earning ratios of S&P 500 index. SYNCH Rst − π Rlt − Rst Rct − Rlt Rs&p500 P/E Constant b1 [t] b2 [t] b3 [t] b4 [t] b5 [t] b6 [t] b1 [t] R-Square John A. Doukas, Jie (Michael) Guo and Bilei Zhou SYNCH1 0.08 [2.21] −0.002 [−0.838] 0.066 [12.6] 0.163 [12.7] −0.012 [−6.52] −0.106 [−9.93] 0.285 [10.4] 0.155 SYNCH2 0.26 [2.55] −0.002 [−0.859] 0.066 [12.6] 0.165 [12.8] −0.012 [−6.56] −0.106 [−9.96] 0.281 [10.2] 0.156
- 16. ‘Hot’ Debt Markets and Capital Structure 61 Table 4 Differences in financial characteristics between hot- and cold-debt market issuing firms This Table evaluates the mean values of financial characteristics of hot- and cold-market firms at year-end one year before the debt-issue year (Panel A) and presents firm-specific characteristics of hot- and cold-debt issuers related to the motivation to issue debt (Panel B). Hot (cold) firms are those that issue debt in hot (cold) months, ranked in the top (bottom) 30% of all the months in the sample period with respect to the distribution of the detrended monthly moving average debt issue volume, shown in Figure 1. The mean values of the financial characteristics of pre-issue year in Panel A include the leverage ratio (D/A), market-to-book ratio (M/B), retained earnings (RE/A), size (SIZE), short-term to total debt ratio (S/D), tangible assets (PPE/A), R&D expense (R&D/A), capital expenditure (INV/A), dividend payouts (DIV/E), and free cash (CASH/A). The variables are standardised by firm year-end assets (excepting size, market-to-book ratio and dividend). All variables are expressed in percentage terms. The t-statistics report the differences of each pair based on one-tailed mean difference tests with unequal variances. The variables of financial characteristics include the leverage ratio (D/A), Q Ratio is firm’s Tobin’s Q at the debt issue year, High credit rating is the percentage of firms with a debt credit rating equal or above BBB in Standard & Poors, or equal or above Baa in Moody’s, Financially constrained firms are defined on the basis of the Kaplan and Zingales (1997) index. Firms with a high (low) KZIndex value relative to the median of the whole sample are categorised as financially constrained (unconstrained). KZIndex = −1.002 × CashFlow + 0.283 × Q + 3.139 × Leverage − 39.368 × Dividends − 1.315 × CashHoldings Bankruptcy Rate measures the percentage of firms that declared bankruptcy within three years after debt issuance. Stock price synchronicity, a proxy for adverse selection costs of equity, measures: SYNCH1, is the stock’s beta (β), which measures the responsiveness of the stock’s return to market-wide information (market returns). SYNCH2, is the stock price synchronicity based on logit-transformation of R2 :ln(R2 /(1 − R2 )). R2 is the residual sum of square from a market model regression of monthly stock returns for 48 months prior to issue. Ownership concentration ratio, OCON, is defined as the number of common shareholders over the outstanding number of common shares. Repurchase is the percentage of firms involved in share-repurchase activities one year after debt issuance. Acquisitions measure the percentage of firms involved in merger and acquisitions one year after debt issuance and the subsequent year (+1). Panel A. Mean values of financial characteristics of hot- and cold-debt issuers one year prior to debt-issue year D/At − 1 M/Bt − 1 RE/At − 1 EBITDA/At − 1 SIZEt − 1 S/Dt − 1 Hot-market firms 61.10 130.20 2.41 14.49 7.74 9.57 Cold-market firms 58.81 95.66 2.81 13.75 6.57 8.13 t-value (difference) [3.40] [16.29] [−1.95] [3.13] [18.2] [4.23] PPE/At − 1 R&D/At − 1 INV/At − 1 DIV/Et − 1 CASH/At − 1 Hot-market firms 53.85 0.97 8.36 4.26 3.41 Cold-market firms 65.62 0.62 10.16 5.34 3.47 t-value (difference) [−11.71] [4.80] [−6.27] [−0.81] [−0.33] C 2010 Blackwell Publishing Ltd
- 17. 62 John A. Doukas, Jie (Michael) Guo and Bilei Zhou Table 4 Continued. Panel B. Firm-specific characteristics of hot- and cold-debt issuers at debt-issue year Hot Cold t-value (difference) Leverage (D/At ) 62.83% 59.37% [5.81] Q Ratio 1.31 0.98 [4.11] High Credit Rating 83.06% 67.52% [2.17] Financially Constrained 37.18% 62.82% [−12.28] Bankruptcy Rate 9.78% 18.41% [−1.29] SYNCH1 0.37 0.30 [3.87] SYNCH2 −0.308 −1.09 [21.59] Ownership Ratio 0.376 2.937 [−4.85] Repurchase 13.26% 3.24% [3.61] Acquisitions 47.32% 11.87% [2.52] Acquisitions +1 84.64% 15.35% [4.75] No. Issues 3082 889 – cold-debt issuers.15 Only 37.1% of hot-debt issuers in our sample are characterised as financially constrained relative to 62.82% of cold-debt issuers. Consistent with their high investment grade status, hot-debt issuers have considerably lower bankruptcy rate (9.78%) than cold-debt issuers (18.41%). Both measures of the stock price synchronicity of hot-debt issuers are considerably higher than those of cold-debt issuers, implying that firm-specific information has a lower weight in their equity valuation which increases the adverse selection costs of equity (i.e., higher asymmetry of information). Hence, these stock price synchronicity differences allow us to tentatively conclude that hot-debt issuers are subject to higher asymmetry of information costs than their cold-debt counterparts. The high investment grade status of hot-debt issuers and their lower bankruptcy rate relative to cold-debt issuers combined with high adverse selection costs of equity suggest that hot-debt issuers’ debt preference is largely dictated by their relatively high adverse selection costs of equity. The ownership concentration structure of debt issuers plays a role in the financing policy of the firm. In the presence of conflict of interests, agency problems emerge and control becomes valuable. Consequently, firms controlled by major shareholders are more likely to issue debt than equity in order to maintain control (Stulz, 1988). To assess ownership structure differences across firms in the sample, we report the ownership concentration ratio, defined as the number of common shareholders over the outstanding number of common shares. A close look at ownership structure of hot-debt versus cold-debt issuers reveals an important difference: hot-debt issuers have markedly more concentrated ownership than cold-debt issuers. This difference suggests that controlling shareholders of hot-debt firms who value the benefits of control the most are likely to favour debt financing to maintain control. 15 The KZ index has been used widely in the literature and despite the controversy about its usefulness (see, among others, Almeida and Campello (2007)) as a measure of financial constraint we are not going to take an issue here. C 2010 Blackwell Publishing Ltd
- 18. ‘Hot’ Debt Markets and Capital Structure 63 Finally, Panel B reports the percentage of firms in our sample that engaged in share repurchases and acquisitions at the debt-issue year and in subsequent years. These estimates reveal that hot-debt issuers conduct significantly more share repurchases and acquisitions than cold-debt issuers. Specifically, about 47% (13%) of hot-debt issuers are involved in acquisitions (share repurchases) at the hot-debt issue year while only 12% (3%) of cold-debt issuers do so. More than 84% of hot-debt issuers conduct acquisitions one year after relative to 15% of cold-debt issuers. These differences are statistically and economically significant. These figures advocate that hot-debt issuers with higher adverse selection costs of equity and ownership concentration than their cold-debt issuing counterpart firms engage in significantly more share repurchases and acquisitions than cold-debt issuers with the intention to restore value. Interestingly, when we look at the buy-and-hold abnormal returns (BHAR) of the hot-debt issuers engaging in these transactions subsequent to the hot-debt issue year, the evidence indicates that they fail to improve long-term performance. We find that the year +1 to +5 BHAR are negative and economically significant.16 This seems to be consistent with the view that when a particular firm characteristic is out of favour (equity due to adverse selection costs), firms endowed with that trait conduct debt-financed repurchase shares and/or acquisitions to restore equity value (arbitrage mispriced characteristics). In general, the share repurchases and acquisition statistics provide empirical support for anecdotal evidence that debt-financed share repurchases and acquisitions are important considerations for debt issuance in hot-debt periods.17 3.4. Hot-market effects on debt issue levels As the first column in Panel A of Table 4 illustrates, the most interesting feature of hot-debt market issuers relates to pre-debt issue leverage. Hot issuers, on average, have a 2.31% higher book debt ratio than cold issuers (61.10% vs 58.81%). This difference is statistically significant, with a t-value of 3.40. The key question that emerges from the pre-issue debt figures is whether hot issuers borrow more than cold issuers, despite having higher pre-issue book debt ratios and, if they do, what are the economic forces behind their debt financing decision. To address this issue, first we estimate the Proceeds/At variable, which measures the percentage of newly issued debt over total assets at fiscal year-end of the debt issuance. We also estimate the Proceeds/At−1 variable, which reflects the percentage of newly issued debt relative to pre-issue assets. A comparison of Proceeds/At or Proceeds/At−1 , between hot- and cold-debt market issuers is expected to reveal whether hot-debt firms issue more debt in hot- than in cold-debt markets. Panel A of Table 5 shows average percentages of debt issue proceeds over total assets. As expected, both financing measures show that, in hot markets, firms issue significantly more debt than in cold markets. The average percentage of hot-market debt issues over total pre-issue assets is almost 2% (0.6% measured by post-issue assets) higher than that of cold-market issues. The t-values of the two sample tests, with unequal variances, show that the mean differences for hot- and cold-market issuers are statistically significant (2.40 and 3.81, respectively). Thus, hot-debt market issuers raise more debt capital than 16 These results are available upon request. 17 See, Bloomberg (30 December 2009) http://www.bloomberg.com/apps/news?pid= 20601087&sid=aHNzEjVBMSuw&refer=home and Economist Staff – The Economist, ‘Will swallowing Wyeth cure Pfizer?’ 4 February 2009. C 2010 Blackwell Publishing Ltd
- 19. 64 John A. Doukas, Jie (Michael) Guo and Bilei Zhou Table 5 Hot-market effects on debt issue levels This table reports the differences between hot- and cold-market firms with respect to debt issue proceeds over firms’ total assets, Proceeds/At (Proceeds/At−1 ). Panel A presents the mean values of Proceeds/At , and Proceeds/At−1 , between hot and cold issuers, expressed in percentage terms. The t-statistics report the differences of each pair based on one-tailed mean difference tests with unequal variances. Panel B1 reports regression results by using the SYNCH1 variable, and Panel B2 reports the regression results by using the SYNCH2 variable. Panels B1 and B2 present the regression results of the following specification: Yt = c0 + c1 HOTD + c2 HOTD × SYNCH t−1 + c3 D/At−1 + c4 M/Bt−1 + c5 RE/At−1 + c6 EBITDA/At−1 + c7 SIZEt−1 + c8 PPE/At−1 + c9 R&D/At−1 + c10 RDD/At−1 + c11 INV/At−1 + c12 DIV/Et−1 + c13 Cash/At−1 + c14 OCON t−1 + c15 D-OCON t−1 + εt The dependent variable Yt represents total debt issue proceeds over total assets at the end and at the beginning of the fiscal year (Proceeds/At , and Proceeds/At−1 ). The hot (cold) markets are defined as the months with a cumulative debt issue volume, which fit in to the top (bottom) 30%. The dummy variable Hot-cold (HOTD) takes the value of 1 when the debt issue takes place during a hot-market period, and zero otherwise. SYNCH denotes the synchronicity of the equity prices to the market (i.e., indicates the amount of firm-specific information is used by investors to value equity). SYNCH1, is the stock’s beta (β), which measures the responsiveness of the stock’s return to market-wide information (market returns). SYNCH2, is the stock price synchronicity based on logit-transformation of R2 , i.e. ln(R2 /(1− R2 )). The control variables include book leverage ratio (D/A), market-to-book ratio (M/B), retained earnings (RE/A), profitability (EBITDA/A), size (SIZE), tangible assets (PPE/A), R&D expense (R&D/A), the dummy variable of R&D (RDD/A), capital expenditure (INV/A), dividend (DIV/E), cash (CASH/A), ownership concentration (OCON) and the dummy variable of ownership concentration (D- OCON). The dummy variable RDD and D-OCON take the value of 1 when R&D expense and ownership concentration information are missing in COMPUSTAT, respectively. Apart from the dummy variables and SIZE, all other variables are expressed in percentage terms. Panel A: Mean Values Proceeds/At Proceeds/At − 1 Hot 7.31 10.46 Cold 6.68 8.49 t-value (difference) [2.4] [3.81] Panel B1: Regression c t-value c t-value Hot-cold (HOTD) 2.273 [8.06] 2.537 [6.24] HOTD × SYNCH1 0.945 [3.83] 1.485 [4.18] D/At − 1 0.021 [2.74] 0.007 [0.589] M/Bt − 1 −0.001 [−0.08] −0.004 [−1.49] RE/At − 1 −0.007 [−0.447] −0.013 [−0.618] EBITDA/At − 1 0.090 [4.32] 0.098 [3.25] SIZEt − 1 −3.068 [−44.3] −4.434 [−44.4] PPE/At − 1 −0.081 [−14.8] −0.119 [−15.1] R&D/At − 1 −0.191 [−2.98] −0.297 [−3.22] RDDt − 1 −0.530 [−1.64] −0.822 [−1.77] INV/At − 1 0.027 [1.63] 0.097 [4.07] DIV/Et − 1 −0.081 [−3.97] −0.082 [−2.77] CASH/At − 1 0.154 [7.14] 0.296 [9.52] OCON −0.003 [−1.4] −0.008 [−2.34] D-OCON −1.515 [−4.75] −2.945 [−6.41] AdjR2 0.411 0.422 C 2010 Blackwell Publishing Ltd
- 20. ‘Hot’ Debt Markets and Capital Structure 65 Table 5 Continued. Panel B2: Regression c t-value c t-value Hot-cold (HOTD) 2.664 [9.47] 3.174 [7.84] HOTD × SYNCH2 0.650 [7.51] 1.040 [8.35] D/At − 1 0.019 [2.46] 0.003 [0.273] M/Bt − 1 −0.001 [−0.59] −0.006 [−2.25] RE/At − 1 −0.001 [−0.067] −0.004 [−0.194] EBITDA/At − 1 0.086 [4.13] 0.090 [3.03] SIZEt − 1 −3.003 [−43.1] −4.329 [−43.2] PPE/At − 1 −0.082 [−15.2] −0.121 [−15.5] R&D/At − 1 −0.204 [−3.21] −0.319 [−3.48] RDDt − 1 −0.728 [−2.26] −1.142 [−2.46] INV/At − 1 0.029 [1.8] 0.101 [4.3] DIV/Et − 1 −0.078 [−3.83] −0.076 [−2.6] CASH/At − 1 0.148 [6.9] 0.286 [9.26] OCON −0.003 [−1.39] −0.008 [−2.35] D-OCON −1.847 [−5.91] −3.488 [−7.76] AdjR2 0.417 0.430 Number of obs. 3825 3825 cold-debt market issuers, although they have significantly higher pre-issue leverage than that of cold-debt market issuers. Pre-issue high leverage of hot-debt issuers does not seem to act as a deterrent of additional debt financing. It could be argued that these differences are economically insignificant and may arise from firm-specific characteristics of hot- and cold-market issuers. To address whether the hot-debt issuance effect on the amount of debt issued is sensitive to the different characteristics of hot- versus cold-debt market firms, we examine the hot-debt market issuance effect on leverage, controlling for various firm characteristics, by estimating the following regression: Yt = c0 + c1 HOTD + c2 HOTD × SYNCH t−1 + c3 D/At−1 + c4 M/Bt−1 + c5 R E/At−1 + c6 EBITDA/At−1 + c7 SIZEt−1 + c8 PPE/At−1 + c9 R&D/At−1 + c10 RDD/At−1 + c11 INV /At−1 + c12 DIV /E t−1 + c13 Cash/At−1 + c14 OCON t−1 + c15 D-OCON t−1 + εt (3) where, the Proceeds/At and Proceeds/At−1 are used as alternative dependent variables, Yt . The dummy variable HOTD takes the value of 1 for hot-debt market issuers and zero for cold-market issuers. Therefore, the coefficient of HOTD measures the impact of hot-debt market effect on firm’s debt issuance. In this regression specification we also focus on the cross-sectional relation between leverage and the stock price synchronicity to determine the impact of adverse selection costs of equity on debt financing during hot-debt issuance periods. As noted earlier, the adverse selection costs of equity hypothesis predicts a positive relationship between SYNCH and leverage. If adverse selection costs of equity act as a deterrent to equity issuance, then periods of increased information costs should be associated with periods of relatively high debt issue volume. That is, when firm-specific information becomes more difficult to observe the adverse selection risk, which is measured by the amount of market-wide relative to firm-specific information, SYNCH, should exert a positive impact on firm leverage. That is, leverage increases because debt C 2010 Blackwell Publishing Ltd
- 21. 66 John A. Doukas, Jie (Michael) Guo and Bilei Zhou becomes a less information-sensitive security. Hence, the interaction variable between HOTD and SYNCH is expected to capture the impact of information asymmetry on debt issuance in hot-debt periods. If information asymmetry plays an important role, the coefficient of the interaction variable is expected to be positive and statistically significant. Although the hot-debt issuance dummy and its interaction with SYNCH are the main focus of this analysis, we also introduce a set of other control variables that other studies have shown to affect firm leverage. The control variables include book leverage ratio (D/A), market-to-book ratio (M/B), retained earnings (RE/A), profitability (EBITDA/A), size (SIZE), tangible assets (PPE/A), R&D expenditures (R&D/A), the dummy variable of R&D (RDD/A), capital expenditure (INV/A), dividend (DIV/E), cash (CASH/A), ownership concentration (OCON) and the dummy variable of ownership concentration (D-OCON).18 All these variables are computed using pre-issue year-end values normalised by year-end fiscal total assets. Panel B of Table 5 reports the regression results. In both regression specifications, the coefficients of the hot-market dummy, HOTD, are positive and statistically significant at conventional levels. Specifically, the coefficients of the hot-market dummy are 2.27and 2.54 in the two regressions, with t-values of 8.06 and 6.24, respectively. While Panel B of Table 4 indicates that hot-market issuers have higher average pre-issue leverage than cold-market issuers, the regression results in Table 5 suggest that hot-market firms issue, on average, 2.27% and 2.54% more debt than cold-market issuers, even after controlling for firm characteristics. Hence, the supplemental evidence from this regression analysis confirms that hot-debt market firms issue significantly more debt than cold-debt market firms. This is consistent with the view that debt market issuers are drawn to hot-debt markets. A more interesting result is that the HOTD × SYNCH1 (Panel B1) and HOTD × SYNCH2 (Panel B2) variables, in line with the prediction of the adverse selection costs of equity hypothesis, exhibit a positive and statistically significant association with leverage in both regressions. These regression estimates, consistent with our previous results, indicate that firms with increasing information asymmetry costs favour debt issuance. That is, a firm’s leverage increases when a lower proportion of firm-specific information relative to market-wide information is available to investors to assess future cash flows (performance). Firms are attracted to hot-debt markets when the level of adverse selection costs of equity is high. Consequently, hot-debt markets seem to occur when firms encounter high adverse selection costs. We turn our focus to the control variables.19 One interesting result from these regressions is that the pre-issue debt ratio, D/At−1 , has a positive and statistically significant relation with subsequent debt financing, suggesting that firms are more likely to issue debt even when their past leverage is relatively high. This is not consistent with the tradeoff hypothesis, which predicts a negative association between the pre-issue debt ratio and new debt issuance. That is, high pre-issue debt ratios do not deter firms from issuing more debt. This result does not appear to be consistent with the view that 18 Following Alti (2006), the dummy for R&D (Ownership concentration) takes the value of 1 for missing information on R&D (Ownership concentration), and zero otherwise, since R&D (Ownership concentration) data, was missing for a large proportion of the observations in Compustat. 19 Although the influences of firm financial characteristics on debt issuance are not the main object of this study, it is helpful when following the analysis to explore the underlying reasons for debt market timing in hot markets. C 2010 Blackwell Publishing Ltd
- 22. ‘Hot’ Debt Markets and Capital Structure 67 firms actively rebalance their leverage to stay within an optimal range. The statistically significant coefficients of the D/At−1 variable, in both regressions, seem to be in accord with the idea that debt financing coincides with favourable debt market conditions. The market-to-book ratio enters both regressions with negative but statistically insignificant coefficients, indicating that firms with higher equity valuation (i.e., lower adverse selection costs of equity) are less likely to issue debt than equity. These results are in accord with Hovakimiam (2006), who contends that high (low) market-to-book firms use more (less) equity financing. Consistent with Baker and Wurgler (2002) who have used the market-to-book ratio as an equity market timing proxy, these regression estimates indicate that debt financing is unlikely to be reversed in favour of equity financing when a firm experiences relatively high adverse selection costs of equity. The R&D expense measure, representing the long-run investment opportunities of the firm, has a uniform association with debt financing. The negative and significant relation between R&D expenditures and debt proceeds suggests that debt financing is not the choice of firms with high growth opportunities. This is consistent with Hovakimian et al. (2001), who argue that firms with high R&D expenditures tend to have low preference for debt in their capital structures, to protect their growth options. Capital expenditures appear to have a positive, but weaker, relation with debt proceeds To assess how firm capital requirements influence a firm’s debt financing decision, we turn our attention to retained earnings, profitability, dividend payout and the level of cash balance variables, which reflect the new capital requirements of the firm (e.g., Woolridge and Ghosh, 1985).20 The positive and significant coefficients of cash and profitability variables indicate that firms issue debt even when internal funds (i.e., cash flows) are high. This, coupled with the positive impact of past leverage on debt issuance, seems to suggest that debt financing is more consistent with market timing than with capital structure rebalancing considerations. High dividend payers appear to issue less debt, implying perhaps that they do attempt to manage credit ratings and implicitly leverage. Alternatively, to the extent that high dividend payout reflects a firm’s low level of investment opportunities, this result seems somewhat consistent with the finding on capital expenditures. It is well known that firm financing preferences vary by firm size; specifically, small firms rely more heavily on external capital, whereas larger firms tend to depend on internally generated funds. Indeed, the regression results confirm this by showing that larger (smaller) firms issue less (more) debt than small firms. Since tangible assets, PPE, vary significantly across industries, this variable may act as a proxy for industry differences, suggesting that firms in industries with high tangible assets (i.e., larger industrial firms) tend to issue less debt. The negative relation between debt financing and tangible assets also suggests that firms with low collateral (tangible assets) are more likely to issue debt in response to favourable market conditions. Finally, as expected, the results show that ownership concentration exerts significant impact on firm leverage indicating that firms with less dispersed ownership are more likely to issue debt in an attempt to retain control. 20 Woolridge and Ghosh (1985), among others, reveal that dividend cuts with increases in retained earnings signal that the firm wishes to conserve cash to fund good investment opportunities. C 2010 Blackwell Publishing Ltd
- 23. 68 John A. Doukas, Jie (Michael) Guo and Bilei Zhou 3.5. Firm-specific determinants of debt issuance in hot markets 3.5.1. Pre-issue debt capacity. There are several other reasons that may potentially explain why hot-debt issuers raise more debt capital than cold-debt issuers during hot-debt market periods. First, hot-debt issuers may have a larger debt capacity than cold-debt firms. If this is the case, they are expected to be more active in taking advantage of low debt ratios, and as a result, raise more debt in an attempt to optimise their capital structure when the debt market is hot. The mean difference estimates, in Panel A of Table 6, indicate that hot-debt issuers have 2.29% (61.1% vs. 58.81%) higher pre-issue leverage than cold-debt issuers. However, this gap could be attributed to differing financial characteristics between the two groups of issuers. To shed more light on this issue, we examine the impact of the hot-cold debt issuance dummy on pre-issue book leverage, D/A pre-issue, for hot- and cold-debt issuers using the same set of control variables employed in regression (3). The first column of Table 6 displays the results of this regression. The regression results in Panel B also show that hot-debt firms do not have larger debt capacity than cold- debt firms, controlling for various firm characteristics. The insignificant coefficient of the hot-cold dummy (t-value of −1.1) suggests that the two groups of debt issuers do not differ dramatically in terms of pre-issue debt leverage.21 Thus, these results point out that debt capacity or capital structure optimisation are not the primary reasons hot-debt issuers engage in greater debt issuance than their cold-debt counterparts. The positive and statistically significant coefficient of the interaction variable, HOTD × SYNCH1, (1.33 with t-value of 1.93) indicates that hot-debt issuers subject to greater adverse selection costs of equity have higher debt ratios than cold-debt issuers in the pre-issue year. In line with our previous results this reinforces the view that hot-debt markets attract firms with high asymmetry of information costs. In unreported results, for reasons of brevity, when we employ the alternative measure of price synchronicity, SYNCH2, estimated from logit-transformation, ln(R2 /(1 − R2 )), where the R2 comes from the market model regression, we find similar findings. Collectively, these results confirm that adverse selection costs of equity motivate debt financing in hot-market periods and provide an explanation for hot-debt issuers’ higher leverage. 3.5.2. Growth opportunities. Another possible explanation for the debt issuance activity of hot-debt firms is that they grow at a higher rate than cold-debt firms. Hence, if hot-debt firms invest more or expect to invest in the near future, they are likely to meet their growing capital requirements by raising debt capital. We address the investment behaviour of firms by replicating the previous regression analysis. Specifically, we now examine whether hot-debt issuance is influenced by the investment rate of debt issuers, controlling for other firm characteristics. These regression results are reported in columns (2)–(4) of Table 6. Interestingly, as shown in Panel A, we find that hot-debt issuers, on average, have a lower investment rate than their cold-debt counterparts in the issue year and in the post-issue two-year period. The differences are statistically significant and do not wane two years after the debt-issue year. The regression analysis in Panel B also shows that the investment rate of hot-debt firms is significantly lower than that of cold-debt firms in the issue year and a year after, and is indistinguishable from 21 Other control variables exhibited significant correlations with pre-issue debt ratios. Since the main focus is to examine the difference between the debt ratios of hot and cold market issuers, the investigation was not extended to the more general question of corporate debt issue determinants implied by the control variables, for reasons of brevity. C 2010 Blackwell Publishing Ltd
- 24. C Table 6 Pre-issue debt financing, investment and profitability of hot- and cold-debt issuing firms This table reports the differences between hot- and cold-debt market firms with respect to their pre-issue leverage, post-issue investment rates and post-issue profitability. Panel A presents mean values for hot- and cold-debt market firms and t-statistics of their differences, based on one-tailed mean difference tests with 2010 Blackwell Publishing Ltd unequal variances. Panels B present the estimates of the following regression: Yt = c0 + c1 HOTD + c2 HOTD × SYNCH t−1 + c3 D/At−1 + c4 M/Bt−1 + c5 RE/At−1 + c6 EBITDA/At−1 + c7 SIZEt−1 + c8 PPE/At−1 + c9 R&D/At−1 + c10 RDD/At−1 + c11 INV/At−1 + c12 DIV/Et−1 + c13 Cash/At−1 + c14 OCON t−1 + c15 D − OCON t−1 + εt The dependent variable Yt is pre-issue leverage ratio (D/At ), investment rate (INV/At ), and profitability (EBITDA/At ), respectively. Hot (cold) markets are defined as the months with a cumulative debt issue volume that fit into the top (bottom) 30%. The dummy variable Hot-cold (HOTD) takes the value of 1 when the debt issue takes place during a hot-market period, and zero in a cold-market period. SYNCH denotes the synchronicity of the equity prices to the market (i.e., indicates the amount of firm-specific information is used by investors to value equity). SYNCH1, is the stock’s beta (β), which measures the responsiveness of the stock’s return to market-wide information (market returns). SYNCH2, is the stock price synchronicity based on logit-transformation of R2 , i.e. ln(R2 /(1− R2 )) (we only report results of specification involving SYNCH1 for reasons of brevity, but available upon request). The control variables include book leverage ratio (D/A), market-to-book ratio (M/B), retained earnings (RE/A), profitability (EBITDA/A), size (SIZE), tangible assets (PPE/A), R&D expense (R&D/A), the dummy variable of R&D (RDD/A), capital expenditure (INV/A), dividend (DIV/E), cash (CASH/A) ownership concentration (OCON) and the dummy variable of ownership concentration (D-OCON). The dummy variable RDD and D-OCON take the value of 1 when R&D expense and ownership concentration information are missing in COMPUSTAT, respectively.. Apart from the dummy variables and SIZE, all variables are expressed in percentage terms. INV/At EBITDA/At ‘Hot’ Debt Markets and Capital Structure Event time D/Apre-issue Issue year Issue year + 1 Issue year + 2 Issue year Issue year + 1 Issue year + 2 Panel A: Mean Values Hot 61.10 8.12 7.64 7.20 13.76 13.95 13.87 Cold 58.81 10.65 10.43 9.41 12.91 12.43 12.30 t-value (difference) [3.40] [−9.20] [−10.94] [−9.62] [3.93] [6.24] [5.99] 69
- 25. C 70 Table 6 Continued. Panel B: 2010 Blackwell Publishing Ltd Regression c t-value c t-value c t-value c t-value c t-value c t-value c t-value HOTD −1.1 [−1.1] −1.195 [−6.88] −1.551 [−7.64] −0.055 [−0.342] −0.288 [−1.49] 0.660 [3.38] 0.013 [0.072] HOTD × 1.33 [1.93] 0.430 [2.82] 0.444 [2.45] 0.201 [1.43] 0.419 [2.48] 0.244 [1.41] 0.275 [1.71] SYNCH1 D/At−1 0.017 [3.58] 0.031 [5.44] 0.008 [1.88] 0.014 [2.53] 0.003 [0.607] 0.028 [5.71] M/Bt−1 3.96 [3.96] −0.002 [−1.34] −0.001 [−1.03] 0.003 [3.04] 0.006 [4.7] 0.013 [10.5] 0.005 [4.36] RE/At−1 −9.32 [−9.32] 0.004 [0.4] −0.010 [−0.889] 0.032 [3.21] −0.041 [−3.97] 0.005 [0.42] 0.015 [1.34] EBITDA/At−1 −15.4 [−15.4] 0.139 [10.8] 0.145 [9.55] 0.065 [5.73] 0.756 [53] 0.626 [47.8] 0.837 [64.6] SIZEt−1 4.39 [4.39] −0.179 [−4.17] −0.302 [−6.01] −0.173 [−4.21] 0.132 [2.77] 0.168 [3.38] 0.073 [1.56] PPE/At−1 −21.1 [−21.1] 0.022 [6.54] 0.040 [10.1] 0.038 [12.1] 0.009 [2.45] 0.015 [3.87] 0.029 [8.1] R&D/At−1 −3.25 [−3.25] −0.065 [−1.65] −0.091 [−1.99] −0.063 [−1.59] −0.010 [−0.221] −0.107 [−2.37] 0.009 [0.201] RDDt−1 3.41 [3.41] 0.440 [2.21] 0.173 [0.737] −0.240 [−1.3] −0.050 [−0.226] −0.785 [−3.55] −0.016 [−0.076] INV/At−1 8.55 [8.55] 0.763 [74.6] 0.569 [47.8] 0.620 [59.1] −0.062 [−5.44] 0.069 [5.99] −0.050 [−4.2] DIV/Et−1 9.21 [9.21] −0.034 [−2.65] −0.046 [−3.01] −0.001 [−0.304] 0.043 [3.04] 0.028 [3.08] 0.012 [3.67] CASH/At−1 −7.09 [−7.09] 0.078 [5.9] 0.087 [5.54] 0.079 [6.34] −0.043 [−2.95] −0.033 [−2.32] 0.033 [2.37] OCON t−1 5 [5] −0.003 [−1.86] −0.003 [−1.77] 0.001 [1.11] 0.001 [0.807] 0.004 [2.37] −0.001 [−0.829] D-OCON t−1 8.5 [8.5] −0.438 [−2.23] −0.781 [−3.38] −0.095 [−0.535] 0.115 [0.529] 0.730 [3.36] 0.219 [1.09] John A. Doukas, Jie (Michael) Guo and Bilei Zhou AdjR2 0.197 0.697 0.537 0.639 0.563 0.550 0.650 No. of Obser- 3825 3786 3665 3534 3786 3665 3534 vations