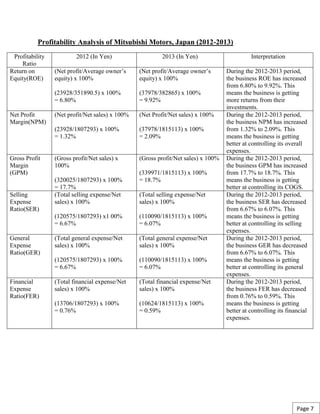
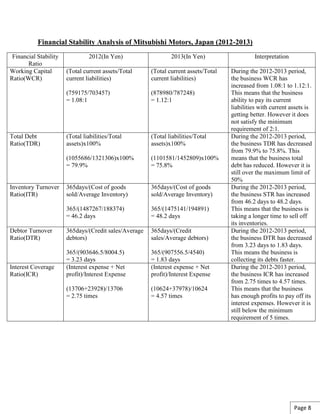
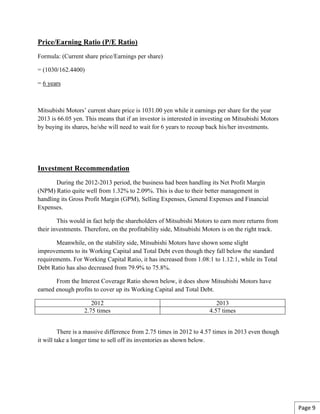
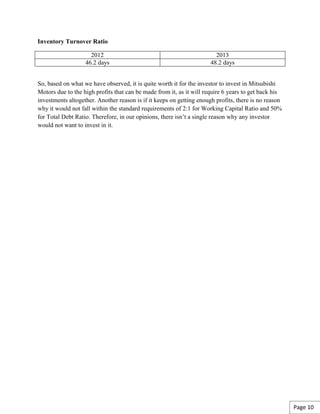
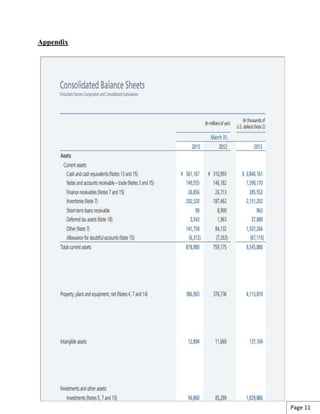
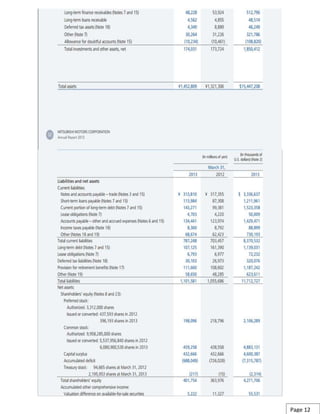
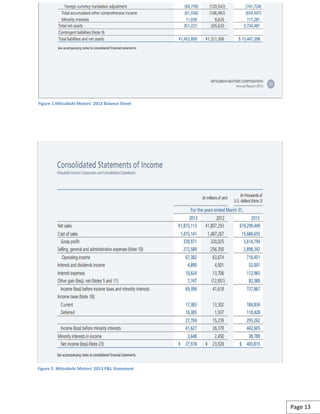
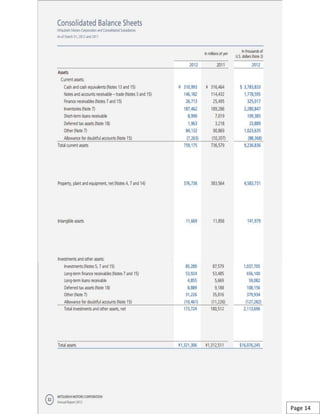
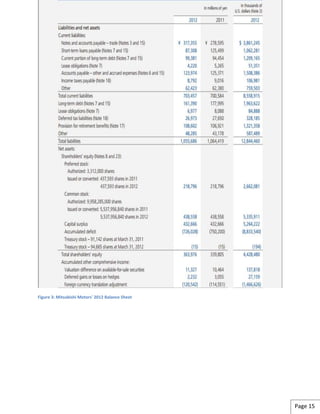
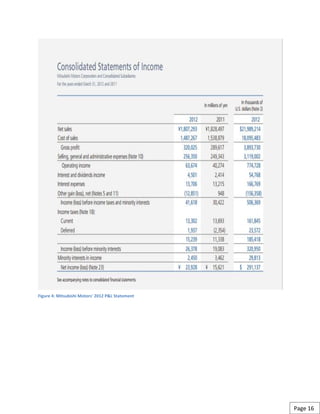
This document provides an analysis of Mitsubishi Motors Corporation, including:
- A brief history of Mitsubishi Motors from its founding in 1917 to the formation of Mitsubishi Motors Corporation in 1970.
- Recent developments at Mitsubishi Motors from 2014, including new vehicle concepts showcased and safety awards received.
- A profitability analysis comparing financial ratios from 2012-2013, showing improved profitability.
- A financial stability analysis of ratios from 2012-2013, with some areas like debt ratios still above standards.
- A recommendation that investing in Mitsubishi Motors is worthwhile due to improving profits, though some financial stability concerns remain.
The research has been conducted to know the people’s perception towards Maruti Suzuki cars. The study was conducted to know the factors that influence the purchase of Maruti Suzuki cars, also what are the people’s expectations from Maruti Suzuki cars. The problems faced by the consumers with regard to Maruti Suzuki cars were also inquired into and thereby their overall satisfaction level was studied. This is a descriptive and exploratory research and mainly primary data is used for the purpose of data collection. The results indicated that people are satisfied with the Maruti cars and it is its fuel efficiency which affects their buying behavior towards Maruti Suzuki. Also there is a lot of scope for Maruti Suzuki cars in India.
Running Head STRATEGIC AUDIT TOYOTA COMPANY 1STRATEGIC AUD.docxtodd521
Running Head: STRATEGIC AUDIT: TOYOTA COMPANY 1
STRATEGIC AUDIT: TOYOTA COMPANY 59
Strategic Audit: Toyota Company
Dr. Mario Hayek
Debo A Ogunseinde
GLB/Strategic Management - 527
June 30, 2019
Table of Contents
I. Introduction 4-5
Toyota Company History 5-9
Toyota Company Worldwide: Acquisition 9
II. Industry Overview 10
Automotive Industry 11
Revenue Streams 12-13
Costs and Expense 13
III. External Environment 14
Political Impacts on Toyota Company 14-23
Economic Environmental Impacts on Toyota Company 24-29
Socio-Cultural Impacts on Toyota Company 30-33
Technology Impacts on Toyota Company 33-35
IV. Porter’s Five Forces 36
Competition in the Automotive Industry 52
The threat of New Entrants into the Automotive Industry 38-41
The threat of Substitute Products 41-44
Bargaining Power of Customers 44-46
Purchasing Power of Consumers 46-50
V. Toyota Company SWOT Analysis 52
VI. Internal Environmental Analysis 52
Strengths of Toyota Company 52-54
Weaknesses of Toyota Company 54-56
VII. Environmental and Industry Analysis 56
Opportunities of Toyota Company 56-57
Threats of Toyota Company 57-58
VIII. Environmental and Industry Conclusion 59
References: 60-64
I. Introduction
Toyota Company is a multinational Automotive Corporation with its headquartereds in Toyota City, Aichi Prefecture Japan. Toyota is among the top ten what number are they? automotive companies in the world despite being the biggest what does this mean? car manufacturing company which was founded back in the 1930s. This company besides being the main car producer, it involves itself please make sure to edit this paper; I expect graduate degree work or partners with large industrial groups which involve themselves in electronics, machinery, and finance. In 1933, the founder of Toyota Company named Kiichiro Toyoda begun the automotive division which was a transformation from textile machinery production (Jürgens, 2015). In 1935, Toyota Company made its successful trial on its own produced cars, upon its car launch, the production units increased significantly due to the impacts of World War II.
In around 1970s???, the company had a total production unit of about 10 million and it becomes isn’t this past tense???the main supplier of cars in North America. From the 1960s to 1970s was the self-expansion period for this company before starting to face competition from other car producers in the market and the new entrants. The main competitors of Toyota Company in the Automotive industry include Ford Company, General Motors Company, Volkswagen Company, Suzuki Company, Nissan Company, Honda Company, Fiat Chrysler Automobile Company, BMW and Mercedes Company (Jürgens, 2015).
Toyota Company is majorly a strong competitor for Ford, Hyundai, as well as Volkswagen which are the other well-known makers of cars in the automotive industry according to…?. The main focus of Toyota is on sustainable expansion besides the production of electric po.
In detail about Toyota, Kirloskar, and Toyota Kirloskar motors private limited. In detail about these companies
List of products which they produced as TKM
Experience Mazda Zoom Zoom Lifestyle and Culture by Visiting and joining the Official Mazda Community at http://www.MazdaCommunity.org for additional insight into the Zoom Zoom Lifestyle and special offers for Mazda Community Members. If you live in Arizona, check out CardinaleWay Mazda's eCommerce website at http://www.Cardinale-Way-Mazda.com
Neuro-symbolic is not enough, we need neuro-*semantic*Frank van Harmelen
Neuro-symbolic (NeSy) AI is on the rise. However, simply machine learning on just any symbolic structure is not sufficient to really harvest the gains of NeSy. These will only be gained when the symbolic structures have an actual semantics. I give an operational definition of semantics as “predictable inference”.
All of this illustrated with link prediction over knowledge graphs, but the argument is general.
LF Energy Webinar: Electrical Grid Modelling and Simulation Through PowSyBl -...DanBrown980551
Do you want to learn how to model and simulate an electrical network from scratch in under an hour?
Then welcome to this PowSyBl workshop, hosted by Rte, the French Transmission System Operator (TSO)!
During the webinar, you will discover the PowSyBl ecosystem as well as handle and study an electrical network through an interactive Python notebook.
PowSyBl is an open source project hosted by LF Energy, which offers a comprehensive set of features for electrical grid modelling and simulation. Among other advanced features, PowSyBl provides:
- A fully editable and extendable library for grid component modelling;
- Visualization tools to display your network;
- Grid simulation tools, such as power flows, security analyses (with or without remedial actions) and sensitivity analyses;
The framework is mostly written in Java, with a Python binding so that Python developers can access PowSyBl functionalities as well.
What you will learn during the webinar:
- For beginners: discover PowSyBl's functionalities through a quick general presentation and the notebook, without needing any expert coding skills;
- For advanced developers: master the skills to efficiently apply PowSyBl functionalities to your real-world scenarios.
DevOps and Testing slides at DASA ConnectKari Kakkonen
My and Rik Marselis slides at 30.5.2024 DASA Connect conference. We discuss about what is testing, then what is agile testing and finally what is Testing in DevOps. Finally we had lovely workshop with the participants trying to find out different ways to think about quality and testing in different parts of the DevOps infinity loop.
Software Delivery At the Speed of AI: Inflectra Invests In AI-Powered QualityInflectra
In this insightful webinar, Inflectra explores how artificial intelligence (AI) is transforming software development and testing. Discover how AI-powered tools are revolutionizing every stage of the software development lifecycle (SDLC), from design and prototyping to testing, deployment, and monitoring.
Learn about:
• The Future of Testing: How AI is shifting testing towards verification, analysis, and higher-level skills, while reducing repetitive tasks.
• Test Automation: How AI-powered test case generation, optimization, and self-healing tests are making testing more efficient and effective.
• Visual Testing: Explore the emerging capabilities of AI in visual testing and how it's set to revolutionize UI verification.
• Inflectra's AI Solutions: See demonstrations of Inflectra's cutting-edge AI tools like the ChatGPT plugin and Azure Open AI platform, designed to streamline your testing process.
Whether you're a developer, tester, or QA professional, this webinar will give you valuable insights into how AI is shaping the future of software delivery.
State of ICS and IoT Cyber Threat Landscape Report 2024 previewPrayukth K V
The IoT and OT threat landscape report has been prepared by the Threat Research Team at Sectrio using data from Sectrio, cyber threat intelligence farming facilities spread across over 85 cities around the world. In addition, Sectrio also runs AI-based advanced threat and payload engagement facilities that serve as sinks to attract and engage sophisticated threat actors, and newer malware including new variants and latent threats that are at an earlier stage of development.
The latest edition of the OT/ICS and IoT security Threat Landscape Report 2024 also covers:
State of global ICS asset and network exposure
Sectoral targets and attacks as well as the cost of ransom
Global APT activity, AI usage, actor and tactic profiles, and implications
Rise in volumes of AI-powered cyberattacks
Major cyber events in 2024
Malware and malicious payload trends
Cyberattack types and targets
Vulnerability exploit attempts on CVEs
Attacks on counties – USA
Expansion of bot farms – how, where, and why
In-depth analysis of the cyber threat landscape across North America, South America, Europe, APAC, and the Middle East
Why are attacks on smart factories rising?
Cyber risk predictions
Axis of attacks – Europe
Systemic attacks in the Middle East
Download the full report from here:
https://sectrio.com/resources/ot-threat-landscape-reports/sectrio-releases-ot-ics-and-iot-security-threat-landscape-report-2024/
Slack (or Teams) Automation for Bonterra Impact Management (fka Social Soluti...Jeffrey Haguewood
Sidekick Solutions uses Bonterra Impact Management (fka Social Solutions Apricot) and automation solutions to integrate data for business workflows.
We believe integration and automation are essential to user experience and the promise of efficient work through technology. Automation is the critical ingredient to realizing that full vision. We develop integration products and services for Bonterra Case Management software to support the deployment of automations for a variety of use cases.
This video focuses on the notifications, alerts, and approval requests using Slack for Bonterra Impact Management. The solutions covered in this webinar can also be deployed for Microsoft Teams.
Interested in deploying notification automations for Bonterra Impact Management? Contact us at sales@sidekicksolutionsllc.com to discuss next steps.
GraphRAG is All You need? LLM & Knowledge GraphGuy Korland
Guy Korland, CEO and Co-founder of FalkorDB, will review two articles on the integration of language models with knowledge graphs.
1. Unifying Large Language Models and Knowledge Graphs: A Roadmap.
https://arxiv.org/abs/2306.08302
2. Microsoft Research's GraphRAG paper and a review paper on various uses of knowledge graphs:
https://www.microsoft.com/en-us/research/blog/graphrag-unlocking-llm-discovery-on-narrative-private-data/
Elevating Tactical DDD Patterns Through Object CalisthenicsDorra BARTAGUIZ
After immersing yourself in the blue book and its red counterpart, attending DDD-focused conferences, and applying tactical patterns, you're left with a crucial question: How do I ensure my design is effective? Tactical patterns within Domain-Driven Design (DDD) serve as guiding principles for creating clear and manageable domain models. However, achieving success with these patterns requires additional guidance. Interestingly, we've observed that a set of constraints initially designed for training purposes remarkably aligns with effective pattern implementation, offering a more ‘mechanical’ approach. Let's explore together how Object Calisthenics can elevate the design of your tactical DDD patterns, offering concrete help for those venturing into DDD for the first time!
UiPath Test Automation using UiPath Test Suite series, part 3DianaGray10
Welcome to UiPath Test Automation using UiPath Test Suite series part 3. In this session, we will cover desktop automation along with UI automation.
Topics covered:
UI automation Introduction,
UI automation Sample
Desktop automation flow
Pradeep Chinnala, Senior Consultant Automation Developer @WonderBotz and UiPath MVP
Deepak Rai, Automation Practice Lead, Boundaryless Group and UiPath MVP
JMeter webinar - integration with InfluxDB and GrafanaRTTS
Watch this recorded webinar about real-time monitoring of application performance. See how to integrate Apache JMeter, the open-source leader in performance testing, with InfluxDB, the open-source time-series database, and Grafana, the open-source analytics and visualization application.
In this webinar, we will review the benefits of leveraging InfluxDB and Grafana when executing load tests and demonstrate how these tools are used to visualize performance metrics.
Length: 30 minutes
Session Overview
-------------------------------------------
During this webinar, we will cover the following topics while demonstrating the integrations of JMeter, InfluxDB and Grafana:
- What out-of-the-box solutions are available for real-time monitoring JMeter tests?
- What are the benefits of integrating InfluxDB and Grafana into the load testing stack?
- Which features are provided by Grafana?
- Demonstration of InfluxDB and Grafana using a practice web application
To view the webinar recording, go to:
https://www.rttsweb.com/jmeter-integration-webinar
Encryption in Microsoft 365 - ExpertsLive Netherlands 2024Albert Hoitingh
In this session I delve into the encryption technology used in Microsoft 365 and Microsoft Purview. Including the concepts of Customer Key and Double Key Encryption.
GDG Cloud Southlake #33: Boule & Rebala: Effective AppSec in SDLC using Deplo...James Anderson
Effective Application Security in Software Delivery lifecycle using Deployment Firewall and DBOM
The modern software delivery process (or the CI/CD process) includes many tools, distributed teams, open-source code, and cloud platforms. Constant focus on speed to release software to market, along with the traditional slow and manual security checks has caused gaps in continuous security as an important piece in the software supply chain. Today organizations feel more susceptible to external and internal cyber threats due to the vast attack surface in their applications supply chain and the lack of end-to-end governance and risk management.
The software team must secure its software delivery process to avoid vulnerability and security breaches. This needs to be achieved with existing tool chains and without extensive rework of the delivery processes. This talk will present strategies and techniques for providing visibility into the true risk of the existing vulnerabilities, preventing the introduction of security issues in the software, resolving vulnerabilities in production environments quickly, and capturing the deployment bill of materials (DBOM).
Speakers:
Bob Boule
Robert Boule is a technology enthusiast with PASSION for technology and making things work along with a knack for helping others understand how things work. He comes with around 20 years of solution engineering experience in application security, software continuous delivery, and SaaS platforms. He is known for his dynamic presentations in CI/CD and application security integrated in software delivery lifecycle.
Gopinath Rebala
Gopinath Rebala is the CTO of OpsMx, where he has overall responsibility for the machine learning and data processing architectures for Secure Software Delivery. Gopi also has a strong connection with our customers, leading design and architecture for strategic implementations. Gopi is a frequent speaker and well-known leader in continuous delivery and integrating security into software delivery.
1. SCHOOL OF ARCHITECTURE, BUILDING AND DESIGN
THE DESIGN SCHOOL
FOUNDATION IN NATURAL & BUILT ENVIRONMENTS
FINANCIAL RATIO ANALYSIS
BASIC ACCOUNTING [FNBE0145]
ASSIGNMENT 1
CHIN TZE WEI (0315767)
SIAU SEE SING (0315926)
2. TABLE OF CONTENT
Brief background history of Mitsubishi Motors Pg: 3-4
Recent Developments of Mitsubishi Motors Pg: 4-6
Profitability Analysis of Mitsubishi Motors Pg: 7
Financial Stability Analysis of Mitsubishi Motors Pg: 8
Investment Recommendation Pg: 9-10
Appendix Pg: 11-16
References Pg 17
3. Brief Background History of Mitsubishi Motors
Mitsubishi's automotive was started back in 1917 when the Mitsubishi Shipbuilding Co.
Ltd. launched the Mitsubishi Model A which was actually Japan's first series-production
automobile. It is an entirely hand-built seven-seated sedan based on the Fiat Tipo 3 but it
eventually proved expensive when compared to its American and European mass-produced
rivals. In the end, it discontinued its operations in 1921 after only 22 had been built.
In 1934, Mitsubishi Shipbuilding was merged with the Mitsubishi Aircraft Co., a
company established in 1920 that is specialized in manufacturing aircraft engines and other parts.
The unified company was known as Mitsubishi Heavy Industries (MHI) and became the largest
private company in Japan. Initially MHI was specifically concentrated on manufacturing aircraft,
ships, railroad cars and machinery but in 1937, it developed the PX33, a prototype sedan for
military use. It was the first Japanese-built passenger car with full-time four-wheel drive, a
technology the company would return to almost fifty years later in its quest for motorsport and
sales success.
Immediately following the end of the Second World War, the company returned to
manufacturing vehicles. Fuso bus production was resumed, while a small three-wheeled cargo
vehicle called the Mizushima and a scooter called the Silver Pigeon were also developed soon
after. (Yuji Sato, 1972) However, the zaibatsu (Japan's family-controlled industrial
conglomerates) were ordered to be dismantled by the Allied powers in 1950 and Mitsubishi
Heavy Industries was split into three regional companies, each having a hand in motor vehicle
development: West Japan Heavy-Industries, Central Japan Heavy-Industries and East Japan
Heavy-Industries. (Hirokazu Nakamura, 1991)
East Japan Heavy-Industries began importing the Henry J, an inexpensive American
sedan built by Kaiser Motors, in knockdown kit (CKD) form to Japan in 1951, and continued to
do so for the remainder of the car's three-year production run. (Takemune Kimura, 1995) During
that same year, Central Japan Heavy-Industries have also concluded a similar contract with
Willys (now owned by Kaiser) for CKD-assembled Jeep CJ-3Bs. This deal showed more durable
with licensed Mitsubishi Jeeps in production lasting until 1998, thirty years after Willys
themselves had replaced the model.
By the beginning of the 1960s Japan's economy was soaring, wages were rising and the
idea of family motoring was taking off. By now Central Japan Heavy-Industries, now known as
Shin Mitsubishi Heavy-Industries, had already re-established an automotive department in its
headquarters in 1953. (Yuji Sato, 1973) Then, it had come to the introduction of the Mitsubishi
500, a mass market sedan, to meet the new demand from consumers. This was soon followed up
in 1962 with the Minica kei car and the Colt 1000, the first of its Colt line of family cars, in
1963.
Page 3
4. Meanwhile, West Japan Heavy-Industries (now renamed Mitsubishi Shipbuilding &
Engineering) and East Japan Heavy-Industries (now Mitsubishi Nihon Heavy-Industries) had
also expanded their automotive departments in the 1950s staging the stage for all three to be re-
integrated as Mitsubishi Heavy Industries in 1964. Within three years its output was over 75,000
vehicles annually. (Osamu Masuko, 2009) Following the successful introduction of the first
Galant in 1969 as well as experiencing similar growth with its commercial vehicle division, it
was decided that the company should create a single operation just to focus on the automotive
industry. Finally Mitsubishi Motors Corporation (MMC) was formed on April 22, 1970 as a
wholly owned subsidiary of MHI under the leadership of Tomio Kubo, a successful engineer
from the aircraft division. (Hideyasu Tagaya, 2005)
The logo of three red diamonds, shared with over forty other companies within the
keiretsu, predates Mitsubishi Motors itself by almost a century. (Yoichiro Okazaki, 2004) It was
chosen by Iwasaki Yatarō, the founder of Mitsubishi, as it was suggestive of the emblem of the
Tosa Clan who first employed him and because his own family crest was three rhombuses that
were stacked atop each other. The name Mitsubishi is a portmanteau of mitsu ("three") and hishi
(literally, "water chestnut", often used in Japanese to denote a diamond or rhombus). (Rolf
Eckrodt, 2002)
Recent Developments of Mitsubishi Motors
10th April 2014: Motor Show at the 2014 Beijing International Automotive Exhibition
(Auto China 2014)
To present the MITSUBISHI Concept GC-PHEV *1 and the MITSUBISHI Concept XR-
PHEV *2 for the first time in China at the 2014 Beijing International Automotive
Exhibition (Auto China 2014).
To display a total of 11 models including models produced and sold in China.
To incorporate a new design that symbolizes the functionality and reassuring safety
inherent to SUVs, the MITSUBISHI Concept GC-PHEV and the MITSUBISHI Concept
XR-PHEV.
The MITSUBISHI Concept GC-PHEV is a next-generation full-size SUV with
full-time four-wheel drive. It is based on a front engine, rear-wheel drive layout
with a plug-in hybrid EV (PHEV) system comprising a 3.0-liter V6 supercharged
MIVEC*3 engine mated to an eight-speed automatic transmission, with a high-
output electric motor and a high-capacity battery to deliver all-terrain
performance truly worthy of an all-round SUV.
The MITSUBISHI Concept XR-PHEV is a next-generation compact SUV
developed to take driving pleasure to new levels. The model uses a front engine,
front-wheel drive layout with a PHEV system that is configured with a downsized
Page 4
5. 1.1-liter direct-injection turbocharged MIVEC engine, a lightweight, compact and
high-efficiency electric motor with a high-capacity battery.
9th May 2014: Outlander PHEV Receives Five Star Award for Safety from JNCAP
Cementing the world's first plug-in hybrid SUV as a leader in automobile safety, adding
on to its five-star rating from Euro NCAP in December 2013.
Satisfied all tests regarding electric shock safety including protection against electric
shock, high-voltage battery electrolyte leakage performance, and high-voltage battery
attachment status.
First product that reflects MMC's future product development direction - focusing on
SUVs with a combination of advanced electric vehicle technology cultivated from its
MiEV series, superior 4x4 stability honed from the Lancer Evolution, and SUV knowhow
from the legendary Pajero.
Won the Car of the Year Japan 2013-2014's Innovation Award*3 and the unique plug-in
hybrid system that propels the Outlander PHEV as the chosen recipient of the RJC
Technology of the Year 2014 award*4.
Recent Mitsubishi Motor Vehicles:
MITSUBISHI ASX L200/TRITON
Page 5
7. Profitability Analysis of Mitsubishi Motors, Japan (2012-2013)
Profitability
Ratio
2012 (In Yen) 2013 (In Yen) Interpretation
Return on
Equity(ROE)
(Net profit/Average owner’s
equity) x 100%
(23928/351890.5) x 100%
= 6.80%
(Net profit/Average owner’s
equity) x 100%
(37978/382865) x 100%
= 9.92%
During the 2012-2013 period,
the business ROE has increased
from 6.80% to 9.92%. This
means the business is getting
more returns from their
investments.
Net Profit
Margin(NPM)
(Net profit/Net sales) x 100%
(23928/1807293) x 100%
= 1.32%
(Net Profit/Net sales) x 100%
(37978/1815113) x 100%
= 2.09%
During the 2012-2013 period,
the business NPM has increased
from 1.32% to 2.09%. This
means the business is getting
better at controlling its overall
expenses.
Gross Profit
Margin
(GPM)
(Gross profit/Net sales) x
100%
(320025/1807293) x 100%
= 17.7%
(Gross profit/Net sales) x 100%
(339971/1815113) x 100%
= 18.7%
During the 2012-2013 period,
the business GPM has increased
from 17.7% to 18.7%. This
means the business is getting
better at controlling its COGS.
Selling
Expense
Ratio(SER)
(Total selling expense/Net
sales) x 100%
(120575/1807293) x1 00%
= 6.67%
(Total selling expense/Net
sales) x 100%
(110090/1815113) x 100%
= 6.07%
During the 2012-2013 period,
the business SER has decreased
from 6.67% to 6.07%. This
means the business is getting
better at controlling its selling
expenses.
General
Expense
Ratio(GER)
(Total general expense/Net
sales) x 100%
(120575/1807293) x 100%
= 6.67%
(Total general expense/Net
sales) x 100%
(110090/1815113) x 100%
= 6.07%
During the 2012-2013 period,
the business GER has decreased
from 6.67% to 6.07%. This
means the business is getting
better at controlling its general
expenses.
Financial
Expense
Ratio(FER)
(Total financial expense/Net
sales) x 100%
(13706/1807293) x 100%
= 0.76%
(Total financial expense/Net
sales) x 100%
(10624/1815113) x 100%
= 0.59%
During the 2012-2013 period,
the business FER has decreased
from 0.76% to 0.59%. This
means the business is getting
better at controlling its financial
expenses.
Page 7
8. Financial Stability Analysis of Mitsubishi Motors, Japan (2012-2013)
Financial Stability
Ratio
2012(In Yen) 2013(In Yen) Interpretation
Working Capital
Ratio(WCR)
(Total current assets/Total
current liabilities)
(759175/703457)
= 1.08:1
(Total current assets/Total
current liabilities)
(878980/787248)
= 1.12:1
During the 2012-2013 period,
the business WCR has
increased from 1.08:1 to 1.12:1.
This means that the business
ability to pay its current
liabilities with current assets is
getting better. However it does
not satisfy the minimum
requirement of 2:1.
Total Debt
Ratio(TDR)
(Total liabilities/Total
assets)x100%
(1055686/1321306)x100%
= 79.9%
(Total liabilities/Total
assets)x100%
(1101581/1452809)x100%
= 75.8%
During the 2012-2013 period,
the business TDR has decreased
from 79.9% to 75.8%. This
means that the business total
debt has reduced. However it is
still over the maximum limit of
50%
Inventory Turnover
Ratio(ITR)
365days/(Cost of goods
sold/Average Inventory)
365/(1487267/188374)
= 46.2 days
365days/(Cost of goods
sold/Average Inventory)
365/(1475141/194891)
= 48.2 days
During the 2012-2013 period,
the business STR has increased
from 46.2 days to 48.2 days.
This means that the business is
taking a longer time to sell off
its inventories.
Debtor Turnover
Ratio(DTR)
365days/(Credit sales/Average
debtors)
365/(903646.5/8004.5)
= 3.23 days
365days/(Credit
sales/Average debtors)
365/(907556.5/4540)
= 1.83 days
During the 2012-2013 period,
the business DTR has decreased
from 3.23 days to 1.83 days.
This means the business is
collecting its debts faster.
Interest Coverage
Ratio(ICR)
(Interest expense + Net
profit)/Interest Expense
(13706+23928)/13706
= 2.75 times
(Interest expense + Net
profit)/Interest Expense
(10624+37978)/10624
= 4.57 times
During the 2012-2013 period,
the business ICR has increased
from 2.75 times to 4.57 times.
This means that the business
has enough profits to pay off its
interest expenses. However it is
still below the minimum
requirement of 5 times.
Page 8
9. Price/Earning Ratio (P/E Ratio)
Formula: (Current share price/Earnings per share)
= (1030/162.4400)
= 6 years
Mitsubishi Motors’ current share price is 1031.00 yen while it earnings per share for the year
2013 is 66.05 yen. This means that if an investor is interested in investing on Mitsubishi Motors
by buying its shares, he/she will need to wait for 6 years to recoup back his/her investments.
Investment Recommendation
During the 2012-2013 period, the business had been handling its Net Profit Margin
(NPM) Ratio quite well from 1.32% to 2.09%. This is due to their better management in
handling its Gross Profit Margin (GPM), Selling Expenses, General Expenses and Financial
Expenses.
This would in fact help the shareholders of Mitsubishi Motors to earn more returns from
their investments. Therefore, on the profitability side, Mitsubishi Motors is on the right track.
Meanwhile, on the stability side, Mitsubishi Motors have shown some slight
improvements to its Working Capital and Total Debt even though they fall below the standard
requirements. For Working Capital Ratio, it has increased from 1.08:1 to 1.12:1, while its Total
Debt Ratio has also decreased from 79.9% to 75.8%.
From the Interest Coverage Ratio shown below, it does show Mitsubishi Motors have
earned enough profits to cover up its Working Capital and Total Debt.
2012 2013
2.75 times 4.57 times
There is a massive difference from 2.75 times in 2012 to 4.57 times in 2013 even though
it will take a longer time to sell off its inventories as shown below.
Page 9
10. Inventory Turnover Ratio
2012 2013
46.2 days 48.2 days
So, based on what we have observed, it is quite worth it for the investor to invest in Mitsubishi
Motors due to the high profits that can be made from it, as it will require 6 years to get back his
investments altogether. Another reason is if it keeps on getting enough profits, there is no reason
why it would not fall within the standard requirements of 2:1 for Working Capital Ratio and 50%
for Total Debt Ratio. Therefore, in our opinions, there isn’t a single reason why any investor
would not want to invest in it.
Page 10
17. References
1) Mukai, Anna (2011-01-20). "Mitsubishi Motors to Introduce Eight Hybrid,
Electric Car Models by 2015". Bloomberg.com. Retrieved 23 May 2014.
2) "Notice regarding conclusion of a principal agreement on share transfer of
the European subsidiary production site". Mitsubishi Motors. 11 July 2012.
Retrieved 24 May 2014.
3) http://www.mitsubishi-motors.com/publish/ir_en/library/anual.html
4) http://www.mitsubishi-motors.com/en/showroom/
5) http://www.mitsubishi-motors.com/en/corporate/aboutus/history/1870/
6) http://www.mitsubishi-
motors.com/publish/pressrelease_en/corporate/2014/news/detail0929.html
7) http://www.mitsubishi-
motors.com/publish/pressrelease_en/motorshow/2014/news/detail0926.html
Page 17