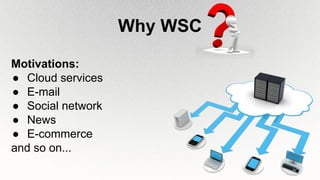
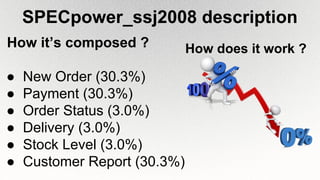
An introduction to the
Design of Warehouse-Scale Computers
Computer Architecture
A.Y. 2014/2015
Authors:
Piscione Pietro
Villardita Alessio
Degree: Computer Engineering
What is a WSC
Warehouse-Scale
Computer
● Scalable
● Distributed
● Cost efficiency
VMs and
applications
Disks
Networking
Servers
Cooling
Energy
proportionality Costs
WSC @
Repair and
failures
Web search
and QPS
e-commerce
Why WSC
Motivations:
● Cloud services
● E-mail
● Social network
● News
● E-commerce
and so on...
Is WSC a data center
Data centers:
● Not co-located
● Host services for
multiple providers
● Third party SW
solution
WSCs:
● Co-located
● Single organization
● Homogenous SW
and HW organization
Cost efficiency at scale
It requires more:
● Computing power
● Storage
● Throughput
● Reliability
Morecosts
WSC architecture overview
Low-end
server Cluster
WSC: SW and HW techniques
● Replication
● Error correction
● Sharding
● Load-balancing
● Health checking
● Compression
● Consistency
● Canaries
● Platform-level software: common firmware,
kernel, operating system distribution, and
libraries
● Cluster-level infrastructure software:
MapReduce, BigTable, Hadoop, Spanner, etc.
● Application-level software: Google search,
Gmail, Google Maps, etc.
Software Layers
Platform-level software
Virtual machines
Pro: Versatile, Reliable, Isolation, Performance,
Encapsulation, Costs, Flexibility, Checkpointing,
Live Migration.
Cons:
I/O intensive WL
Hardware Building Blocks
● Server hardware
● Network fabric
● Storage hierarchy components
Large SMP vs low-end server nodes
Warehouse scale
Limits of very low-end cores
● Amdahl’s law: difficult to reduce serialization
and communication overheads
● The larger # of threads, the larger the
variability in response times
Ex.: Web Server Latency per request
High-End cores Low-End cores (3x slower)
1s/request (50% CPU) 2s/request (75% CPU)
Network fabric
● Network scalability: hard to put in practice;
offloading some traffic to a special-purpose
network
● Protocols: FCoE (FibreChannel over Ethernet)
and iSCSI (SCSI over IP)
● Programmable network: OpenFlow and SDN
WSC architecture overview - Network
Characteristics Ethernet
cable
Optical fiber
Performance (Gbs) 1-10 10-1000
MTBF (years) >45 >10
Costs ($/km) 200-500 700-1200
What protocol is used in the data center? Infiniband-Ethernet
Storage hierarchy componentsLatency
Size
WSC architecture overview - Disks
Characteristics HDD SDD
Performance (MBs) R:59 W:60 R:100 W:80
Active Power (W) 3.86 1
MTBF (Mh) >2 <0.7
Costs ($/TB) 60-75 130-150
Which is the file system? GFS
Modelling costs
Total Cost=Capital Cost+Operational cost
Capital cost depends from:
● Design
● Size
● Location
● Speed of construction
Operational cost:
It hardly depends
from applications
Capital Cost - example1
1
Ref. [2]
Servers
$2,997,090
Power &
Cooling
$1,296,902
Power
$1,042,440
Other
$284,686
Operational Cost - example
● Power consumption
○ Cooling
○ Servers
○ Energy power efficiency
○ Workload
● Repairs and failure
WSC Power Consumption: overview
● A datacenter uses
10-20% of the
servers power
● Cooling
● High-efficiency in
power conversion
CPUs
DRAM
Disks
Cooling
Closed Cooling System
Energy and power efficiency
● Measures are workload dependant
● Distinguish between three main factors:
● State-of-the-Art TPUE = PUE x SPUE around 1.44
● Average data centers have TPUE = 3.2
Efficiency
1
SPUE
1
PUE
C
TEEC
Facility Server Computing
For each productive watt, 2.2 more are consumed!
Sources of Efficiency Losses
IT
Equipment
Cooling
UPSAir movement
Workload
Large continuous
batch
Mix: online services
Energy proportionality
Energy efficiency key factors
● Efficient load distribution: Live migration and
Google File System
● Idle times must be little
● Energy-proportional computing
● Workload peaks prediction models (complex)
Energy efficiency Benchmarks
● LINPACK: world’s top supercomputers
● JouleSort
● SPECpower
● Emerald
● SP C-2/E
● SPECpower_ssj2008: based on a broad class of
server workloads
Storage: # of transactions per Watt
Server-level: performance-to-power
Dealing with failures and repairs
System
Available @ 99.9%
Unavailable
FailureHW upgrade Maintenance
Tolerating faults, not hiding them
“A gracefully degraded service”
But how?
Fault-Tolerant SW Infrastructure
Requirements:
● HW faults can be tolerated
● HW level: its faults must
always be detected and
reported to software
● support a broad class of
operational procedures
inexpensive PC-class HW
costs saving and
optimization
Pros:
reactive containment and
recovery actions
turn in
Truly faulty
Main faults causes
@Google:
● Software errors
● Human mistakes
● Wrong
configurations
But also (10-25%):
● Hardware-related
○ Disk errors
○ DRAM soft errors
Config
SW
Human
HW
Net
Oth
World is not perfect, and holds on
And Google’s WSCs do so:
● 1.2-2 crashes per year (mature server)
● with 2,000 servers, approximately 1 crash every 2.5 h
(10 per day)
● ⅓ of servers is affected by correctable DRAM errors,
on average per year (1 error per server every 2.5 h)
● with ECC, only 1.3% of all machines ever experience
uncorrectable memory errors per year
Hardware
Google’s Availability
55%
6 30
25%
1% > 1 day!
99.84%
● Monitors servers’
configuration, activity,
environmental, and
error data
● Individual machine
diagnostics
● Stability of new system
software versions
● Suggest repairs action
Google System Health
Study case: web search
Web size?
Nobody knows it.
Classification?
Using PageRank.
QPS?
Not possible to
establish a priori
Logical view of a web index
Study case: web search - 2
No energy proportionality
Hour
CPU - energy proportionality
VFS solution
Trade-off
Performance vs.
Power consumption
A real life example
Benchmark for Enterprise applications
16 x DELL M1000e
14 x IBM Blade
Center Model
16 x HP C7000
What are we going to test?
SPECpower_ssj2008 description
How it’s composed ?
● New Order (30.3%)
● Payment (30.3%)
● Order Status (3.0%)
● Delivery (3.0%)
● Stock Level (3.0%)
● Customer Report (30.3%)
How does it work ?
Benchmark results
Lower is better
Benchmark results - 2
Higher is better
Conclusions
Internet grows tirelessly!
User side
● Services
● Price
● Latency
● Availability
WSC side
● Hardware
● Costs
● Performance
● Reliability and
fault tolerance
References
[1] Barroso, Clidaras, Hölzle, The Datacenter as a Computer: An
Introduction to the Design of Warehouse-Scale Machines, Morgan &
Claypool Publishers, 2013
[2]http://perspectives.mvdirona.com/2008/11/cost-of-power-in-large-
scale-data-centers/, James Hamilton, AWS Team
Thank you for
listening !

An introduction to the Design of Warehouse-Scale Computers

  • 1.
    An introduction tothe Design of Warehouse-Scale Computers Computer Architecture A.Y. 2014/2015 Authors: Piscione Pietro Villardita Alessio Degree: Computer Engineering
  • 2.
    What is aWSC Warehouse-Scale Computer ● Scalable ● Distributed ● Cost efficiency
  • 3.
  • 4.
    Why WSC Motivations: ● Cloudservices ● E-mail ● Social network ● News ● E-commerce and so on...
  • 5.
    Is WSC adata center Data centers: ● Not co-located ● Host services for multiple providers ● Third party SW solution WSCs: ● Co-located ● Single organization ● Homogenous SW and HW organization
  • 6.
    Cost efficiency atscale It requires more: ● Computing power ● Storage ● Throughput ● Reliability Morecosts
  • 7.
  • 8.
    WSC: SW andHW techniques ● Replication ● Error correction ● Sharding ● Load-balancing ● Health checking ● Compression ● Consistency ● Canaries
  • 9.
    ● Platform-level software:common firmware, kernel, operating system distribution, and libraries ● Cluster-level infrastructure software: MapReduce, BigTable, Hadoop, Spanner, etc. ● Application-level software: Google search, Gmail, Google Maps, etc. Software Layers
  • 10.
    Platform-level software Virtual machines Pro:Versatile, Reliable, Isolation, Performance, Encapsulation, Costs, Flexibility, Checkpointing, Live Migration. Cons: I/O intensive WL
  • 11.
    Hardware Building Blocks ●Server hardware ● Network fabric ● Storage hierarchy components
  • 12.
    Large SMP vslow-end server nodes Warehouse scale
  • 13.
    Limits of verylow-end cores ● Amdahl’s law: difficult to reduce serialization and communication overheads ● The larger # of threads, the larger the variability in response times Ex.: Web Server Latency per request High-End cores Low-End cores (3x slower) 1s/request (50% CPU) 2s/request (75% CPU)
  • 14.
    Network fabric ● Networkscalability: hard to put in practice; offloading some traffic to a special-purpose network ● Protocols: FCoE (FibreChannel over Ethernet) and iSCSI (SCSI over IP) ● Programmable network: OpenFlow and SDN
  • 15.
    WSC architecture overview- Network Characteristics Ethernet cable Optical fiber Performance (Gbs) 1-10 10-1000 MTBF (years) >45 >10 Costs ($/km) 200-500 700-1200 What protocol is used in the data center? Infiniband-Ethernet
  • 16.
  • 17.
    WSC architecture overview- Disks Characteristics HDD SDD Performance (MBs) R:59 W:60 R:100 W:80 Active Power (W) 3.86 1 MTBF (Mh) >2 <0.7 Costs ($/TB) 60-75 130-150 Which is the file system? GFS
  • 18.
    Modelling costs Total Cost=CapitalCost+Operational cost Capital cost depends from: ● Design ● Size ● Location ● Speed of construction Operational cost: It hardly depends from applications
  • 19.
    Capital Cost -example1 1 Ref. [2] Servers $2,997,090 Power & Cooling $1,296,902 Power $1,042,440 Other $284,686
  • 20.
    Operational Cost -example ● Power consumption ○ Cooling ○ Servers ○ Energy power efficiency ○ Workload ● Repairs and failure
  • 21.
    WSC Power Consumption:overview ● A datacenter uses 10-20% of the servers power ● Cooling ● High-efficiency in power conversion CPUs DRAM Disks Cooling
  • 22.
  • 23.
    Energy and powerefficiency ● Measures are workload dependant ● Distinguish between three main factors: ● State-of-the-Art TPUE = PUE x SPUE around 1.44 ● Average data centers have TPUE = 3.2 Efficiency 1 SPUE 1 PUE C TEEC Facility Server Computing For each productive watt, 2.2 more are consumed!
  • 24.
    Sources of EfficiencyLosses IT Equipment Cooling UPSAir movement
  • 25.
  • 26.
  • 27.
    Energy efficiency keyfactors ● Efficient load distribution: Live migration and Google File System ● Idle times must be little ● Energy-proportional computing ● Workload peaks prediction models (complex)
  • 28.
    Energy efficiency Benchmarks ●LINPACK: world’s top supercomputers ● JouleSort ● SPECpower ● Emerald ● SP C-2/E ● SPECpower_ssj2008: based on a broad class of server workloads Storage: # of transactions per Watt Server-level: performance-to-power
  • 29.
    Dealing with failuresand repairs System Available @ 99.9% Unavailable FailureHW upgrade Maintenance Tolerating faults, not hiding them “A gracefully degraded service” But how?
  • 30.
    Fault-Tolerant SW Infrastructure Requirements: ●HW faults can be tolerated ● HW level: its faults must always be detected and reported to software ● support a broad class of operational procedures inexpensive PC-class HW costs saving and optimization Pros: reactive containment and recovery actions turn in
  • 31.
    Truly faulty Main faultscauses @Google: ● Software errors ● Human mistakes ● Wrong configurations But also (10-25%): ● Hardware-related ○ Disk errors ○ DRAM soft errors Config SW Human HW Net Oth
  • 32.
    World is notperfect, and holds on And Google’s WSCs do so: ● 1.2-2 crashes per year (mature server) ● with 2,000 servers, approximately 1 crash every 2.5 h (10 per day) ● ⅓ of servers is affected by correctable DRAM errors, on average per year (1 error per server every 2.5 h) ● with ECC, only 1.3% of all machines ever experience uncorrectable memory errors per year Hardware
  • 33.
  • 34.
    ● Monitors servers’ configuration,activity, environmental, and error data ● Individual machine diagnostics ● Stability of new system software versions ● Suggest repairs action Google System Health
  • 35.
    Study case: websearch Web size? Nobody knows it. Classification? Using PageRank. QPS? Not possible to establish a priori Logical view of a web index
  • 36.
    Study case: websearch - 2 No energy proportionality Hour
  • 37.
    CPU - energyproportionality VFS solution Trade-off Performance vs. Power consumption
  • 38.
    A real lifeexample
  • 39.
    Benchmark for Enterpriseapplications 16 x DELL M1000e 14 x IBM Blade Center Model 16 x HP C7000 What are we going to test?
  • 40.
    SPECpower_ssj2008 description How it’scomposed ? ● New Order (30.3%) ● Payment (30.3%) ● Order Status (3.0%) ● Delivery (3.0%) ● Stock Level (3.0%) ● Customer Report (30.3%) How does it work ?
  • 41.
  • 42.
    Benchmark results -2 Higher is better
  • 43.
    Conclusions Internet grows tirelessly! Userside ● Services ● Price ● Latency ● Availability WSC side ● Hardware ● Costs ● Performance ● Reliability and fault tolerance
  • 44.
    References [1] Barroso, Clidaras,Hölzle, The Datacenter as a Computer: An Introduction to the Design of Warehouse-Scale Machines, Morgan & Claypool Publishers, 2013 [2]http://perspectives.mvdirona.com/2008/11/cost-of-power-in-large- scale-data-centers/, James Hamilton, AWS Team Thank you for listening !