Buy D-Link (India) as rollout of 4G services drives demand for networking
•
0 likes•155 views

D-Link (India) Limited reported financial results for the quarter ended March 31, 2015. Net profit jumped 65.91% to Rs. 53.09 million compared to Rs. 32 million in the prior year quarter. Revenue rose 29.91% to Rs. 1728.90 million. Earnings per share stood at Rs. 1.50, up 40.21% year-over-year. Profit before tax increased 68.98% to Rs. 82.65 million. For the full fiscal year 2015, net profit grew 57% to Rs. 213.29 million on net sales growth of 28% to Rs. 6253.23 million. The company is expected to grow net sales and profit at

Recommended
More Related Content
What's hot
What's hot (16)
Viewers also liked
Viewers also liked (12)
Similar to Buy D-Link (India) as rollout of 4G services drives demand for networking
Similar to Buy D-Link (India) as rollout of 4G services drives demand for networking (20)
More from IndiaNotes.com
More from IndiaNotes.com (20)
Recently uploaded
Recently uploaded (20)
Buy D-Link (India) as rollout of 4G services drives demand for networking
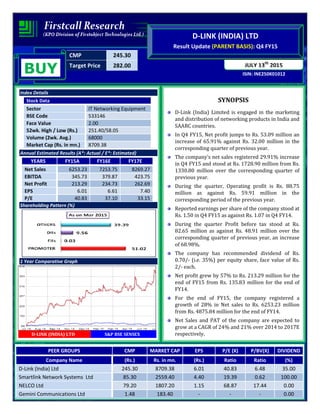
- 1. CMP 245.30 Target Price 282.00 ISIN: INE250K01012 JULY 13th 2015 D-LINK (INDIA) LTD Result Update (PARENT BASIS): Q4 FY15 BUY Index Details Stock Data Sector IT Networking Equipment BSE Code 533146 Face Value 2.00 52wk. High / Low (Rs.) 251.40/58.05 Volume (2wk. Avg.) 68000 Market Cap (Rs. in mn.) 8709.38 Annual Estimated Results (A*: Actual / E*: Estimated) YEARS FY15A FY16E FY17E Net Sales 6253.23 7253.75 8269.27 EBITDA 345.73 379.87 423.75 Net Profit 213.29 234.73 262.69 EPS 6.01 6.61 7.40 P/E 40.83 37.10 33.15 Shareholding Pattern (%) 1 Year Comparative Graph D-LINK (INDIA) LTD S&P BSE SENSEX SYNOPSIS D-Link (India) Limited is engaged in the marketing and distribution of networking products in India and SAARC countries. In Q4 FY15, Net profit jumps to Rs. 53.09 million an increase of 65.91% against Rs. 32.00 million in the corresponding quarter of previous year. The company’s net sales registered 29.91% increase in Q4 FY15 and stood at Rs. 1728.90 million from Rs. 1330.80 million over the corresponding quarter of previous year. During the quarter, Operating profit is Rs. 88.75 million as against Rs. 59.91 million in the corresponding period of the previous year. Reported earnings per share of the company stood at Rs. 1.50 in Q4 FY15 as against Rs. 1.07 in Q4 FY14. During the quarter Profit before tax stood at Rs. 82.65 million as against Rs. 48.91 million over the corresponding quarter of previous year, an increase of 68.98%. The company has recommended dividend of Rs. 0.70/- (i.e. 35%) per equity share, face value of Rs. 2/- each. Net profit grew by 57% to Rs. 213.29 million for the end of FY15 from Rs. 135.83 million for the end of FY14. For the end of FY15, the company registered a growth of 28% in Net sales to Rs. 6253.23 million from Rs. 4875.84 million for the end of FY14. Net Sales and PAT of the company are expected to grow at a CAGR of 24% and 21% over 2014 to 2017E respectively. PEER GROUPS CMP MARKET CAP EPS P/E (X) P/BV(X) DIVIDEND Company Name (Rs.) Rs. in mn. (Rs.) Ratio Ratio (%) D-Link (India) Ltd 245.30 8709.38 6.01 40.83 6.48 35.00 Smartlink Network Systems Ltd 85.30 2559.40 4.40 19.39 0.62 100.00 NELCO Ltd 79.20 1807.20 1.15 68.87 17.44 0.00 Gemini Communications Ltd 1.48 183.40 - - - 0.00
- 2. QUARTERLY HIGHLIGHTS (PARENT BASIS) Results Updates- Q4 FY15 D-Link (India) Limited is engaged in the marketing and distribution of networking products in India and SAARC countries has reported its financial results for the quarter ended 31st March, 2015. The company’s net profit jumps to Rs. 53.09 million against Rs. 32.00 million in the corresponding quarter ending of previous year, an increase of 65.91%. Revenue for the quarter rose by 29.91% to Rs. 1728.90 million from Rs. 1330.80 million, when compared with the prior year period. Reported earnings per share of the company stood at Rs. 1.50 a share during the quarter as against Rs. 1.07 over previous year period. Profit before interest, depreciation and tax is Rs. 88.75 million as against Rs. 59.91 million in the corresponding period of the previous year. Break up of Expenditure Months Mar-15 Mar-14 % Change Net Sales 1728.90 1330.80 29.91 PAT 53.09 32.00 65.91 EPS 1.50 1.07 40.21 EBITDA 88.75 59.91 48.14 Break up of Expenditure (Rs in millions) Q4 FY15 Q4 FY14 % CHNG Purchase of Traded Goods 1443.79 1014.40 42% Employee Benefit Expenses 75.70 56.98 33% Dep & Amortization Exp 3.87 4.23 -9% Other Expenses 136.83 105.06 30%
- 3. COMPANY PROFILE D-Link (India) Limited was incorporated in 2008. D-Link (India) Limited is a subsidiary of D-Link Holding Mauritius Inc. The company is engaged in the marketing and distribution of networking products in India and SAARC countries. It primarily offers digital home, easy portal, home servers, security box, Internet protocol (IP) device integration, and wireless routers, as well as carrier switches, broadband digital subscriber lines (DSL) and DSL access multiplexers, integrated access devices, cable modems, voice over IP, passive optical network, rural connective platform outdoor wireless bridges, digital home appliances, network storage, and IP surveillance and multimedia devices for customers and service providers. The company also provides metro network, access network, premises network, and home entertainment focusing on the provision of backend infrastructure services to customers at various levels, such as service distribution, aggregation, and access and premise networks. The company sells its networking products to distributors, original equipment manufacturers, and system integrators, as well as for the enterprise and small and medium business segments in the government, hospitability, and education sectors. It also exports its products. D-Link (India) Limited formerly known as Smartlink Network Systems Limited.
- 4. FINANCIAL HIGHLIGHT (PARENT BASIS) (A*- Actual, E* -Estimations & Rs. In Millions) Balance Sheet as at March 31, 2014 -2017E FY14A FY15A FY16E FY17E SOURCES OF FUNDS Shareholder's Funds Share Capital 60.01 71.01 71.01 71.01 Reserves and Surplus 936.97 1273.73 1508.46 1771.15 1. Sub Total - Net worth 996.98 1344.74 1579.47 1842.16 Non Current Liabilities Deferred Tax Liabilities 6.89 0.00 0.00 0.00 Other Long term liabilities 0.00 0.45 0.52 0.58 Long term Provisions 3.30 5.04 5.80 6.55 2. Sub Total - Non Current Liabilities 10.18 5.49 6.32 7.13 Current Liabilities Short term Borrowings 35.08 22.74 18.87 16.80 Trade Payables 801.57 1145.22 1328.46 1501.15 Other Current Liabilities 15.10 26.31 32.62 37.84 Short Term Provisions 24.25 58.98 71.96 82.03 3. Sub Total - Current Liabilities 875.99 1253.25 1451.91 1637.83 Total Liabilities (1+2+3) 1883.15 2603.48 3037.70 3487.12 APPLICATION OF FUNDS Non-Current Assets a) Fixed Assets 198.69 194.98 206.68 217.01 b) Non-current investments 0.00 165.00 173.25 183.65 c) Deferred tax Assets 0.00 15.91 17.82 19.60 d) Long Term loans and advances 33.68 25.33 26.60 28.19 1. Sub Total - Non Current Assets 232.37 401.22 424.34 448.45 Current Assets Inventories 631.74 781.22 929.65 1069.10 Trade receivables 945.26 1408.17 1668.33 1951.76 Cash and Bank Balances 31.25 1.72 2.44 2.81 Short-terms loans & advances 42.53 11.11 12.89 14.95 Other current assets 0.00 0.04 0.05 0.06 2. Sub Total - Current Assets 1650.78 2202.26 2613.36 3038.67 Total Assets (1+2) 1883.15 2603.48 3037.70 3487.12
- 5. Annual Profit & Loss Statement for the period of 2014 to 2017E Value(Rs.in.mn) FY14A FY15A FY16E FY17E Description 12m 12m 12m 12m Net Sales 4875.84 6253.23 7253.75 8269.27 Other Income 11.18 15.62 17.18 18.56 Total Income 4887.02 6268.85 7270.93 8287.83 Expenditure -4658.36 -5923.12 -6891.06 -7864.08 Operating Profit 228.66 345.73 379.87 423.75 Interest -8.20 -4.64 -4.92 -5.16 Gross profit 220.46 341.09 374.95 418.59 Depreciation -16.81 -17.02 -18.21 -19.67 Profit Before Tax 203.65 324.07 356.74 398.92 Tax -67.82 -110.78 -122.00 -136.23 Net Profit 135.83 213.29 234.73 262.69 Equity capital 60.01 71.01 71.01 71.01 Reserves 936.97 1273.73 1508.46 1771.15 Face value 2.00 2.00 2.00 2.00 EPS 4.53 6.01 6.61 7.40 Quarterly Profit & Loss Statement for the period of 30th Sep, 2014 to 30th Jun, 2015E Value(Rs.in.mn) 30-Sep-14 31-Dec-14 31-Mar-15 30-Jun-15E Description 3m 3m 3m 3m Net sales 1506.40 1607.78 1728.90 1815.35 Other income 5.52 1.35 8.68 5.64 Total Income 1511.92 1609.13 1737.58 1820.99 Expenditure -1434.04 -1525.47 -1648.83 -1724.58 Operating profit 77.88 83.66 88.75 96.41 Interest -0.05 -0.33 -2.23 -1.34 Gross profit 77.83 83.33 86.52 95.07 Depreciation -4.07 -3.98 -3.87 -4.37 Profit Before Tax 73.76 79.35 82.65 90.70 Tax -24.25 -26.96 -29.56 -30.97 Net Profit 49.51 52.39 53.09 59.72 Equity capital 71.01 71.01 71.01 71.01 Face value 2.00 2.00 2.00 2.00 EPS 1.39 1.48 1.50 1.68
- 6. Ratio Analysis Particulars FY14A FY15A FY16E FY17E EPS (Rs.) 4.53 6.01 6.61 7.40 EBITDA Margin (%) 4.69 5.53 5.24 5.12 PBT Margin (%) 4.18 5.18 4.92 4.82 PAT Margin (%) 2.79 3.41 3.24 3.18 P/E Ratio (x) 54.19 40.83 37.10 33.15 ROE (%) 13.62 15.86 14.86 14.26 ROCE (%) 23.78 26.53 24.91 23.85 Debt Equity Ratio 0.04 0.02 0.01 0.01 EV/EBITDA (x) 32.21 25.25 22.97 20.59 Book Value (Rs.) 33.23 37.87 44.49 51.88 P/BV 7.38 6.48 5.51 4.73 Charts
- 7. OUTLOOK AND CONCLUSION At the current market price of Rs. 245.30, the stock P/E ratio is at 37.10 x FY16E and 33.15 x FY17E respectively. Earnings per share (EPS) of the company for the earnings for FY16E and FY17E are seen at Rs. 6.61 and Rs. 7.40 respectively. Net Sales and PAT of the company are expected to grow at a CAGR of 24% and 21% over 2014 to 2017E respectively. On the basis of EV/EBITDA, the stock trades at 22.97 x for FY16E and 20.59 x for FY17E. Price to Book Value of the stock is expected to be at 5.51 x and 4.73 x for FY16E and FY17E respectively. We recommend ‘BUY’ in this particular scrip with a target price of Rs. 282.00 for Medium to Long term investment. INDUSTRY OVERVIEW The Indian networking industry is undergoing a rapid transformation with the advent of new technologies, higher bandwidth and high speed wireless connectivity. The growth is likely to be accelerated as the economy steadily moves to a higher gear in 2014-15 driven by a gradual revival in industrial production, stable agri-sector activity, steady services growth and easing inflation. With the economy poised to grow at a steady pace, Enterprises are investing towards setting up a strong networking infrastructure that can deliver reliable and efficient end-to-end solutions to eventually transform their business operations.
- 8. The roll out of 4G services and the significant government initiatives in aggressively promoting broadband usage in the country are driving the demand of networking products like routers, switches and access points to storage and surveillance products across all verticals. The number of computing devices, PCs, tablets, smart phones has increased rapidly and networks, especially wifi networks, need to be deployed to share information and resources across users and devices. Users are upgrading their networks to take advantage of complex applications, advanced communication capabilities and rich multimedia content. They need the convenience and flexibility of operating their various devices in an increasingly mobile or wireless manner. Similarly, market demand for television connectivity products has increased as users seek to connect their televisions to internet and for entertainment content. These developments augur well for D-Link India, and with the networking industry in an expansion mode, the company looks forward to sound long term growth prospects. The domestic IT business has remained muted in the last two fiscal years due to various reasons ranging from political to slowdown in the industrial sector. However, the software services body projects an end to the political uncertainties that have hampered the growth. Disclaimer: This document is prepared by our research analysts and it does not constitute an offer or solicitation for the purchase or sale of any financial instrument or as an official confirmation of any transaction. The information contained herein is from publicly available data or other sources believed to be reliable but we do not represent that it is accurate or complete and it should not be relied on as such. Firstcall Research or any of its affiliates shall not be in any way responsible for any loss or damage that may arise to any person from any inadvertent error in the information contained in this report. Firstcall Research and/ or its affiliates and/or employees will not be liable for the recipients’ investment decision based on this document.
- 9. Firstcall India Equity Research: Email – info@firstobjectindia.com C.V.S.L.Kameswari Pharma & Diversified U. Janaki Rao Capital Goods B. Anil Kumar Auto, IT & FMCG M. Vinayak Rao Diversified G. Amarender Diversified Firstcall Research Provides Industry Research on all the Sectors and Equity Research on Major Companies forming part of Listed and Unlisted Segments For Further Details Contact: Tel.: 022-2527 2510/2527 6077 / 25276089 Telefax: 022-25276089 040-20000235 /20000233 E-mail: info@firstobjectindia.com www.firstcallresearch.com