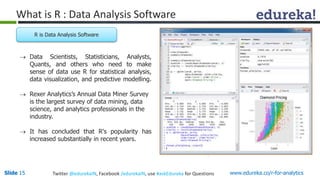
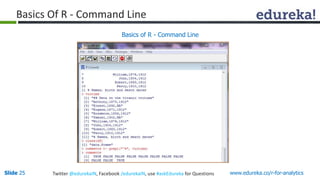
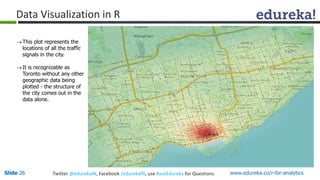
View Business Analytics with R Course at www.edureka.co/r-for-analytics 
www.edureka.co/r-for-analytics 
BUSINESS ANALYTICS WITH R
Objectives of this Session 
 What is Business Analytics? 
 Who uses R and How? 
 What is R? 
 Why to use R? 
 R Products 
 Job Trends in R 
 Get started with R 
 Use-case Implementation 
For Queries during the session and class recording: 
Post on Twitter @edurekaIN: #askEdureka 
Post on Facebook /edurekaIN 
Slide 2 www.edureka.co/r-for-analytics
Landscape of Big Data 
Source- http://www.mushroomnetworks.com/infographics/landscape-of-big-data 
Slide 3 Twitter @edurekaIN, Facebook /edurekaIN, use #askEdureka for Questions www.edureka.co/r-for-analytics
Business Analytics 
Why Business Analytics is getting popular these days ? 
Cost of storing data Cost of processing data 
Slide 4 Twitter @edurekaIN, Facebook /edurekaIN, use #askEdureka for Questions www.edureka.co/r-for-analytics
Cost of storing data ( 1980–2009) 
Slide 5 Twitter @edurekaIN, Facebook /edurekaIN, use #askEdureka for Questions www.edureka.co/r-for-analytics
Cost of processing Data ( 1992-2012) 
Slide 6 Twitter @edurekaIN, Facebook /edurekaIN, use #askEdureka for Questions www.edureka.co/r-for-analytics
Business Analytics 
Definition 
“Study of business data using statistical techniques and programming for creating decision support 
and insights for achieving business goals”. 
Who creates it? How? 
Business analytics solutions typically use statistical and quantitative analysis and fact-based data to 
measure past performance to guide an organization's business planning. 
Who uses it? How? 
Business analytics is used to evaluate organization-wide operations, and can be implemented in any 
department from sales to product development to customer service. 
Slide 7 Twitter @edurekaIN, Facebook /edurekaIN, use #askEdureka for Questions www.edureka.co/r-for-analytics
Who uses R? 
Slide 8 Twitter @edurekaIN, Facebook /edurekaIN, use #askEdureka for Questions www.edureka.co/r-for-analytics
Who Uses R : Domains 
 Telecom 
 Pharmaceuticals 
 Financial Services 
 Life Sciences 
 Education, etc 
Slide 9 Twitter @edurekaIN, Facebook /edurekaIN, use #askEdureka for Questions www.edureka.co/r-for-analytics
Who Uses R : Companies 
Consumer Financial Protection Bureau 
The Consumer Financial Protection Bureau uses R for data analysis 
John Deere 
Statisticians at John Deere use R for time series modeling and geospatial analysis in a 
reliable and reproducible way. The results are integrated with Excel and SAP 
Bank of America 
Bank of America uses R for reporting 
Foursquare 
R is part of technology stack behind Foursquare’s famed recommendation engine 
Slide 10 Twitter @edurekaIN, Facebook /edurekaIN, use #askEdureka for Questions www.edureka.co/r-for-analytics
Who Uses R : Companies 
ANZ Bank 
ANZ, the fourth largest bank in Australia, using R for credit risk analysis 
Google 
Google uses R to predict Economic Activity 
Mozilla 
Mozilla, the foundation responsible for the Firefox web browser, uses R to visualize Web 
activity 
Slide 11 Twitter @edurekaIN, Facebook /edurekaIN, use #askEdureka for Questions www.edureka.co/r-for-analytics
Who Uses R : Companies 
Corporate Clients of R 
http://www.revolutionanalytics.com/aboutus/our-customers.php 
Slide 12 Twitter @edurekaIN, Facebook /edurekaIN, use #askEdureka for Questions www.edureka.co/r-for-analytics
R : Characteristics 
“The great beauty of R is that you can modify it to do all sorts of things,” said Hal Varian, chief 
economist at Google. “And you have a lot of pre-packaged stuff that’s already available, so 
you’re standing on the shoulders of giants.” 
 R is open source and free. 
 R has lots of packages and multiple ways of doing the same thing. 
 By default stores memory in RAM. 
 R has the most advanced graphics. You need much better programming skills. 
 R has GUI to help make learning easier. 
 Customization needs command line. 
 R can connect to many database and data types. 
Slide 13 Twitter @edurekaIN, Facebook /edurekaIN, use #askEdureka for Questions www.edureka.co/r-for-analytics
What is R? 
Slide 14 Twitter @edurekaIN, Facebook /edurekaIN, use #askEdureka for Questions www.edureka.co/r-for-analytics
What is R : Data Analysis Software 
R is Data Analysis Software 
 Data Scientists, Statisticians, Analysts, 
Quants, and others who need to make 
sense of data use R for statistical analysis, 
data visualization, and predictive modelling. 
 Rexer Analytics’s Annual Data Miner Survey 
is the largest survey of data mining, data 
science, and analytics professionals in the 
industry. 
 It has concluded that R's popularity has 
increased substantially in recent years. 
Slide 15 Twitter @edurekaIN, Facebook /edurekaIN, use #askEdureka for Questions www.edureka.co/r-for-analytics
What is R : Programming Language 
R is Programming Language 
 You do data analysis in R by writing scripts and 
functions in the R programming language. 
 R has also quickly found the following because 
statisticians, engineers and scientists without 
computer programming skills find it easy to use. 
Do not get intimated by the 
term ‘Programming Language’, 
the concepts from the very 
basic will be taught during the 
course. 
Slide 16 Twitter @edurekaIN, Facebook /edurekaIN, use #askEdureka for Questions www.edureka.co/r-for-analytics
What is R : Environment for Statistical Analysis 
R is Environment for Statistical Analysis 
 R language consists of functions for almost 
every data manipulation, statistical model, or 
chart that a data analyst could ever need. 
 For statisticians, however, R is particularly 
useful because it contains a number of built-in 
mechanisms for organizing data, running 
calculations on the information and creating 
graphical representations of data sets. 
Slide 17 Twitter @edurekaIN, Facebook /edurekaIN, use #askEdureka for Questions www.edureka.co/r-for-analytics
What is R : Open-source Software Project 
R is Open-source Software Project 
 Not only does this mean that you can download 
and use R for free, but the source code is also 
open for inspection and modification to anyone 
who wants to see how the methods and 
algorithms work under the covers. 
 R is an open-source program, and its popularity 
reflects a shift in the type of software used 
inside corporations. 
Slide 18 Twitter @edurekaIN, Facebook /edurekaIN, use #askEdureka for Questions www.edureka.co/r-for-analytics
What is R : Community 
R is Community 
 Additional functionality contributed to the R 
language is by creating add-on "packages" for 
use by the 2 million users of R worldwide. As a 
result, there is a strong and vibrant community 
of R users on-line. 
 What makes R so useful — and helps explain its 
quick acceptance — is that statisticians, 
engineers and scientists can improve the 
software’s code or write variations for specific 
tasks. 
Slide 19 Twitter @edurekaIN, Facebook /edurekaIN, use #askEdureka for Questions www.edureka.co/r-for-analytics
Comparing R : Job Trends 
“R has really become the second 
language for people coming out of 
grad school now, and there’s an 
amazing amount of code being 
written for it,” said 
Max Kuhn, 
Associate Director of Nonclinical 
Statistics at Pfizer. 
Comparing R and others 
“You can look on the SAS 
message boards and see there 
is a proportional downturn in 
traffic.” 
http://r4stats.com/articles/popularity/ 
Slide 20 Twitter @edurekaIN, Facebook /edurekaIN, use #askEdureka for Questions www.edureka.co/r-for-analytics
Comparing R 
Tool usage comparison 
http://www.oreilly.com/data/free/files/stratasurvey.pdf 
Slide 21 Twitter @edurekaIN, Facebook /edurekaIN, use #askEdureka for Questions www.edureka.co/r-for-analytics
Comparing R 
"R skills attract the highest salaries" 
http://blog.revolutionanalytics.com/2014/02/r-salary-surveys.html 
Slide 22 Twitter @edurekaIN, Facebook /edurekaIN, use #askEdureka for Questions www.edureka.co/r-for-analytics
R Products 
Companies Developing ‘R’ Products 
Slide 23 Twitter @edurekaIN, Facebook /edurekaIN, use #askEdureka for Questions www.edureka.co/r-for-analytics
R Products 
Did you know Oracle creates a version of R? 
http://www.oracle.com/technetwork/topics/bigdata/r-offerings- 
1566363.html 
Did you know SAS Institute views R as an 
Opportunity? 
http://support.sas.com/rnd/app/studio/Rinterface2.h 
tml 
Did you know Teradata uses R for in-database 
analytics? 
http://developer.teradata.com/applications/articles/in-database- 
analytics-with-teradata-r 
http://downloads.teradata.com/download/applications 
/teradata-r 
Slide 24 Twitter @edurekaIN, Facebook /edurekaIN, use #askEdureka for Questions www.edureka.co/r-for-analytics
Basics Of R - Command Line 
Basics of R - Command Line 
Slide 25 Twitter @edurekaIN, Facebook /edurekaIN, use #askEdureka for Questions www.edureka.co/r-for-analytics
Data Visualization in R 
This plot represents the 
locations of all the traffic 
signals in the city. 
 It is recognizable as 
Toronto without any other 
geographic data being 
plotted - the structure of 
the city comes out in the 
data alone. 
Slide 26 Twitter @edurekaIN, Facebook /edurekaIN, use #askEdureka for Questions www.edureka.co/r-for-analytics
Use Cases 
Slide 27 Twitter @edurekaIN, Facebook /edurekaIN, use #askEdureka for Questions www.edureka.co/r-for-analytics
Use-Cases 
Use-Case #1 
Problem statement : A retailer is interested to find out the association between the products. If retailers know that 
which products are being bought together most of the time, then he can plan out the shelving of these products in 
store or he can offer some discount on combo purchase. 
We can run market basket analysis in R to find such kinds of pattern in data. 
Slide 28 Twitter @edurekaIN, Facebook /edurekaIN, use #askEdureka for Questions www.edureka.co/r-for-analytics
Use-Cases 
Use-Case #2 
Problem statement : Churn is the major problem for any telecommunication company. A telecom company wants to 
find out the attributes of potential churn so that they can approach them with right retention offer. 
For this we need to mine the historical data of previous churner & then we can run logistic regression to come up with a 
churn probability equation. 
Slide 29 Twitter @edurekaIN, Facebook /edurekaIN, use #askEdureka for Questions www.edureka.co/r-for-analytics
Use-Cases 
Use-Case #3 
Problem statement : LAPD (Los Angles Police department) wants to predict the crime before it occurred. 
They can use predictive modelling technique in R. 
Slide 30 Twitter @edurekaIN, Facebook /edurekaIN, use #askEdureka for Questions www.edureka.co/r-for-analytics
Use-Cases 
Use-Case #4 
Problem statement : Analyse the content of Obama's "Yes we can" speech. Mine this speech and find the most 
frequently used words in the speech. 
We can create a word cloud and represent the most frequently used words in the speech as bigger & bolder in the 
Word Cloud. 
Slide 31 Twitter @edurekaIN, Facebook /edurekaIN, use #askEdureka for Questions www.edureka.co/r-for-analytics
Demo 
Slide 32 Twitter @edurekaIN, Facebook /edurekaIN, use #askEdureka for Questions www.edureka.co/r-for-analytics
Twitter @edurekaIN, Facebook /edurekaIN, use #askEdureka for Questions www.edureka.co/r-for-analytics

Business Analytics with R - Webinar

  • 1.
    View Business Analyticswith R Course at www.edureka.co/r-for-analytics www.edureka.co/r-for-analytics BUSINESS ANALYTICS WITH R
  • 2.
    Objectives of thisSession  What is Business Analytics?  Who uses R and How?  What is R?  Why to use R?  R Products  Job Trends in R  Get started with R  Use-case Implementation For Queries during the session and class recording: Post on Twitter @edurekaIN: #askEdureka Post on Facebook /edurekaIN Slide 2 www.edureka.co/r-for-analytics
  • 3.
    Landscape of BigData Source- http://www.mushroomnetworks.com/infographics/landscape-of-big-data Slide 3 Twitter @edurekaIN, Facebook /edurekaIN, use #askEdureka for Questions www.edureka.co/r-for-analytics
  • 4.
    Business Analytics WhyBusiness Analytics is getting popular these days ? Cost of storing data Cost of processing data Slide 4 Twitter @edurekaIN, Facebook /edurekaIN, use #askEdureka for Questions www.edureka.co/r-for-analytics
  • 5.
    Cost of storingdata ( 1980–2009) Slide 5 Twitter @edurekaIN, Facebook /edurekaIN, use #askEdureka for Questions www.edureka.co/r-for-analytics
  • 6.
    Cost of processingData ( 1992-2012) Slide 6 Twitter @edurekaIN, Facebook /edurekaIN, use #askEdureka for Questions www.edureka.co/r-for-analytics
  • 7.
    Business Analytics Definition “Study of business data using statistical techniques and programming for creating decision support and insights for achieving business goals”. Who creates it? How? Business analytics solutions typically use statistical and quantitative analysis and fact-based data to measure past performance to guide an organization's business planning. Who uses it? How? Business analytics is used to evaluate organization-wide operations, and can be implemented in any department from sales to product development to customer service. Slide 7 Twitter @edurekaIN, Facebook /edurekaIN, use #askEdureka for Questions www.edureka.co/r-for-analytics
  • 8.
    Who uses R? Slide 8 Twitter @edurekaIN, Facebook /edurekaIN, use #askEdureka for Questions www.edureka.co/r-for-analytics
  • 9.
    Who Uses R: Domains  Telecom  Pharmaceuticals  Financial Services  Life Sciences  Education, etc Slide 9 Twitter @edurekaIN, Facebook /edurekaIN, use #askEdureka for Questions www.edureka.co/r-for-analytics
  • 10.
    Who Uses R: Companies Consumer Financial Protection Bureau The Consumer Financial Protection Bureau uses R for data analysis John Deere Statisticians at John Deere use R for time series modeling and geospatial analysis in a reliable and reproducible way. The results are integrated with Excel and SAP Bank of America Bank of America uses R for reporting Foursquare R is part of technology stack behind Foursquare’s famed recommendation engine Slide 10 Twitter @edurekaIN, Facebook /edurekaIN, use #askEdureka for Questions www.edureka.co/r-for-analytics
  • 11.
    Who Uses R: Companies ANZ Bank ANZ, the fourth largest bank in Australia, using R for credit risk analysis Google Google uses R to predict Economic Activity Mozilla Mozilla, the foundation responsible for the Firefox web browser, uses R to visualize Web activity Slide 11 Twitter @edurekaIN, Facebook /edurekaIN, use #askEdureka for Questions www.edureka.co/r-for-analytics
  • 12.
    Who Uses R: Companies Corporate Clients of R http://www.revolutionanalytics.com/aboutus/our-customers.php Slide 12 Twitter @edurekaIN, Facebook /edurekaIN, use #askEdureka for Questions www.edureka.co/r-for-analytics
  • 13.
    R : Characteristics “The great beauty of R is that you can modify it to do all sorts of things,” said Hal Varian, chief economist at Google. “And you have a lot of pre-packaged stuff that’s already available, so you’re standing on the shoulders of giants.”  R is open source and free.  R has lots of packages and multiple ways of doing the same thing.  By default stores memory in RAM.  R has the most advanced graphics. You need much better programming skills.  R has GUI to help make learning easier.  Customization needs command line.  R can connect to many database and data types. Slide 13 Twitter @edurekaIN, Facebook /edurekaIN, use #askEdureka for Questions www.edureka.co/r-for-analytics
  • 14.
    What is R? Slide 14 Twitter @edurekaIN, Facebook /edurekaIN, use #askEdureka for Questions www.edureka.co/r-for-analytics
  • 15.
    What is R: Data Analysis Software R is Data Analysis Software  Data Scientists, Statisticians, Analysts, Quants, and others who need to make sense of data use R for statistical analysis, data visualization, and predictive modelling.  Rexer Analytics’s Annual Data Miner Survey is the largest survey of data mining, data science, and analytics professionals in the industry.  It has concluded that R's popularity has increased substantially in recent years. Slide 15 Twitter @edurekaIN, Facebook /edurekaIN, use #askEdureka for Questions www.edureka.co/r-for-analytics
  • 16.
    What is R: Programming Language R is Programming Language  You do data analysis in R by writing scripts and functions in the R programming language.  R has also quickly found the following because statisticians, engineers and scientists without computer programming skills find it easy to use. Do not get intimated by the term ‘Programming Language’, the concepts from the very basic will be taught during the course. Slide 16 Twitter @edurekaIN, Facebook /edurekaIN, use #askEdureka for Questions www.edureka.co/r-for-analytics
  • 17.
    What is R: Environment for Statistical Analysis R is Environment for Statistical Analysis  R language consists of functions for almost every data manipulation, statistical model, or chart that a data analyst could ever need.  For statisticians, however, R is particularly useful because it contains a number of built-in mechanisms for organizing data, running calculations on the information and creating graphical representations of data sets. Slide 17 Twitter @edurekaIN, Facebook /edurekaIN, use #askEdureka for Questions www.edureka.co/r-for-analytics
  • 18.
    What is R: Open-source Software Project R is Open-source Software Project  Not only does this mean that you can download and use R for free, but the source code is also open for inspection and modification to anyone who wants to see how the methods and algorithms work under the covers.  R is an open-source program, and its popularity reflects a shift in the type of software used inside corporations. Slide 18 Twitter @edurekaIN, Facebook /edurekaIN, use #askEdureka for Questions www.edureka.co/r-for-analytics
  • 19.
    What is R: Community R is Community  Additional functionality contributed to the R language is by creating add-on "packages" for use by the 2 million users of R worldwide. As a result, there is a strong and vibrant community of R users on-line.  What makes R so useful — and helps explain its quick acceptance — is that statisticians, engineers and scientists can improve the software’s code or write variations for specific tasks. Slide 19 Twitter @edurekaIN, Facebook /edurekaIN, use #askEdureka for Questions www.edureka.co/r-for-analytics
  • 20.
    Comparing R :Job Trends “R has really become the second language for people coming out of grad school now, and there’s an amazing amount of code being written for it,” said Max Kuhn, Associate Director of Nonclinical Statistics at Pfizer. Comparing R and others “You can look on the SAS message boards and see there is a proportional downturn in traffic.” http://r4stats.com/articles/popularity/ Slide 20 Twitter @edurekaIN, Facebook /edurekaIN, use #askEdureka for Questions www.edureka.co/r-for-analytics
  • 21.
    Comparing R Toolusage comparison http://www.oreilly.com/data/free/files/stratasurvey.pdf Slide 21 Twitter @edurekaIN, Facebook /edurekaIN, use #askEdureka for Questions www.edureka.co/r-for-analytics
  • 22.
    Comparing R "Rskills attract the highest salaries" http://blog.revolutionanalytics.com/2014/02/r-salary-surveys.html Slide 22 Twitter @edurekaIN, Facebook /edurekaIN, use #askEdureka for Questions www.edureka.co/r-for-analytics
  • 23.
    R Products CompaniesDeveloping ‘R’ Products Slide 23 Twitter @edurekaIN, Facebook /edurekaIN, use #askEdureka for Questions www.edureka.co/r-for-analytics
  • 24.
    R Products Didyou know Oracle creates a version of R? http://www.oracle.com/technetwork/topics/bigdata/r-offerings- 1566363.html Did you know SAS Institute views R as an Opportunity? http://support.sas.com/rnd/app/studio/Rinterface2.h tml Did you know Teradata uses R for in-database analytics? http://developer.teradata.com/applications/articles/in-database- analytics-with-teradata-r http://downloads.teradata.com/download/applications /teradata-r Slide 24 Twitter @edurekaIN, Facebook /edurekaIN, use #askEdureka for Questions www.edureka.co/r-for-analytics
  • 25.
    Basics Of R- Command Line Basics of R - Command Line Slide 25 Twitter @edurekaIN, Facebook /edurekaIN, use #askEdureka for Questions www.edureka.co/r-for-analytics
  • 26.
    Data Visualization inR This plot represents the locations of all the traffic signals in the city.  It is recognizable as Toronto without any other geographic data being plotted - the structure of the city comes out in the data alone. Slide 26 Twitter @edurekaIN, Facebook /edurekaIN, use #askEdureka for Questions www.edureka.co/r-for-analytics
  • 27.
    Use Cases Slide27 Twitter @edurekaIN, Facebook /edurekaIN, use #askEdureka for Questions www.edureka.co/r-for-analytics
  • 28.
    Use-Cases Use-Case #1 Problem statement : A retailer is interested to find out the association between the products. If retailers know that which products are being bought together most of the time, then he can plan out the shelving of these products in store or he can offer some discount on combo purchase. We can run market basket analysis in R to find such kinds of pattern in data. Slide 28 Twitter @edurekaIN, Facebook /edurekaIN, use #askEdureka for Questions www.edureka.co/r-for-analytics
  • 29.
    Use-Cases Use-Case #2 Problem statement : Churn is the major problem for any telecommunication company. A telecom company wants to find out the attributes of potential churn so that they can approach them with right retention offer. For this we need to mine the historical data of previous churner & then we can run logistic regression to come up with a churn probability equation. Slide 29 Twitter @edurekaIN, Facebook /edurekaIN, use #askEdureka for Questions www.edureka.co/r-for-analytics
  • 30.
    Use-Cases Use-Case #3 Problem statement : LAPD (Los Angles Police department) wants to predict the crime before it occurred. They can use predictive modelling technique in R. Slide 30 Twitter @edurekaIN, Facebook /edurekaIN, use #askEdureka for Questions www.edureka.co/r-for-analytics
  • 31.
    Use-Cases Use-Case #4 Problem statement : Analyse the content of Obama's "Yes we can" speech. Mine this speech and find the most frequently used words in the speech. We can create a word cloud and represent the most frequently used words in the speech as bigger & bolder in the Word Cloud. Slide 31 Twitter @edurekaIN, Facebook /edurekaIN, use #askEdureka for Questions www.edureka.co/r-for-analytics
  • 32.
    Demo Slide 32Twitter @edurekaIN, Facebook /edurekaIN, use #askEdureka for Questions www.edureka.co/r-for-analytics
  • 33.
    Twitter @edurekaIN, Facebook/edurekaIN, use #askEdureka for Questions www.edureka.co/r-for-analytics