Download to read offline
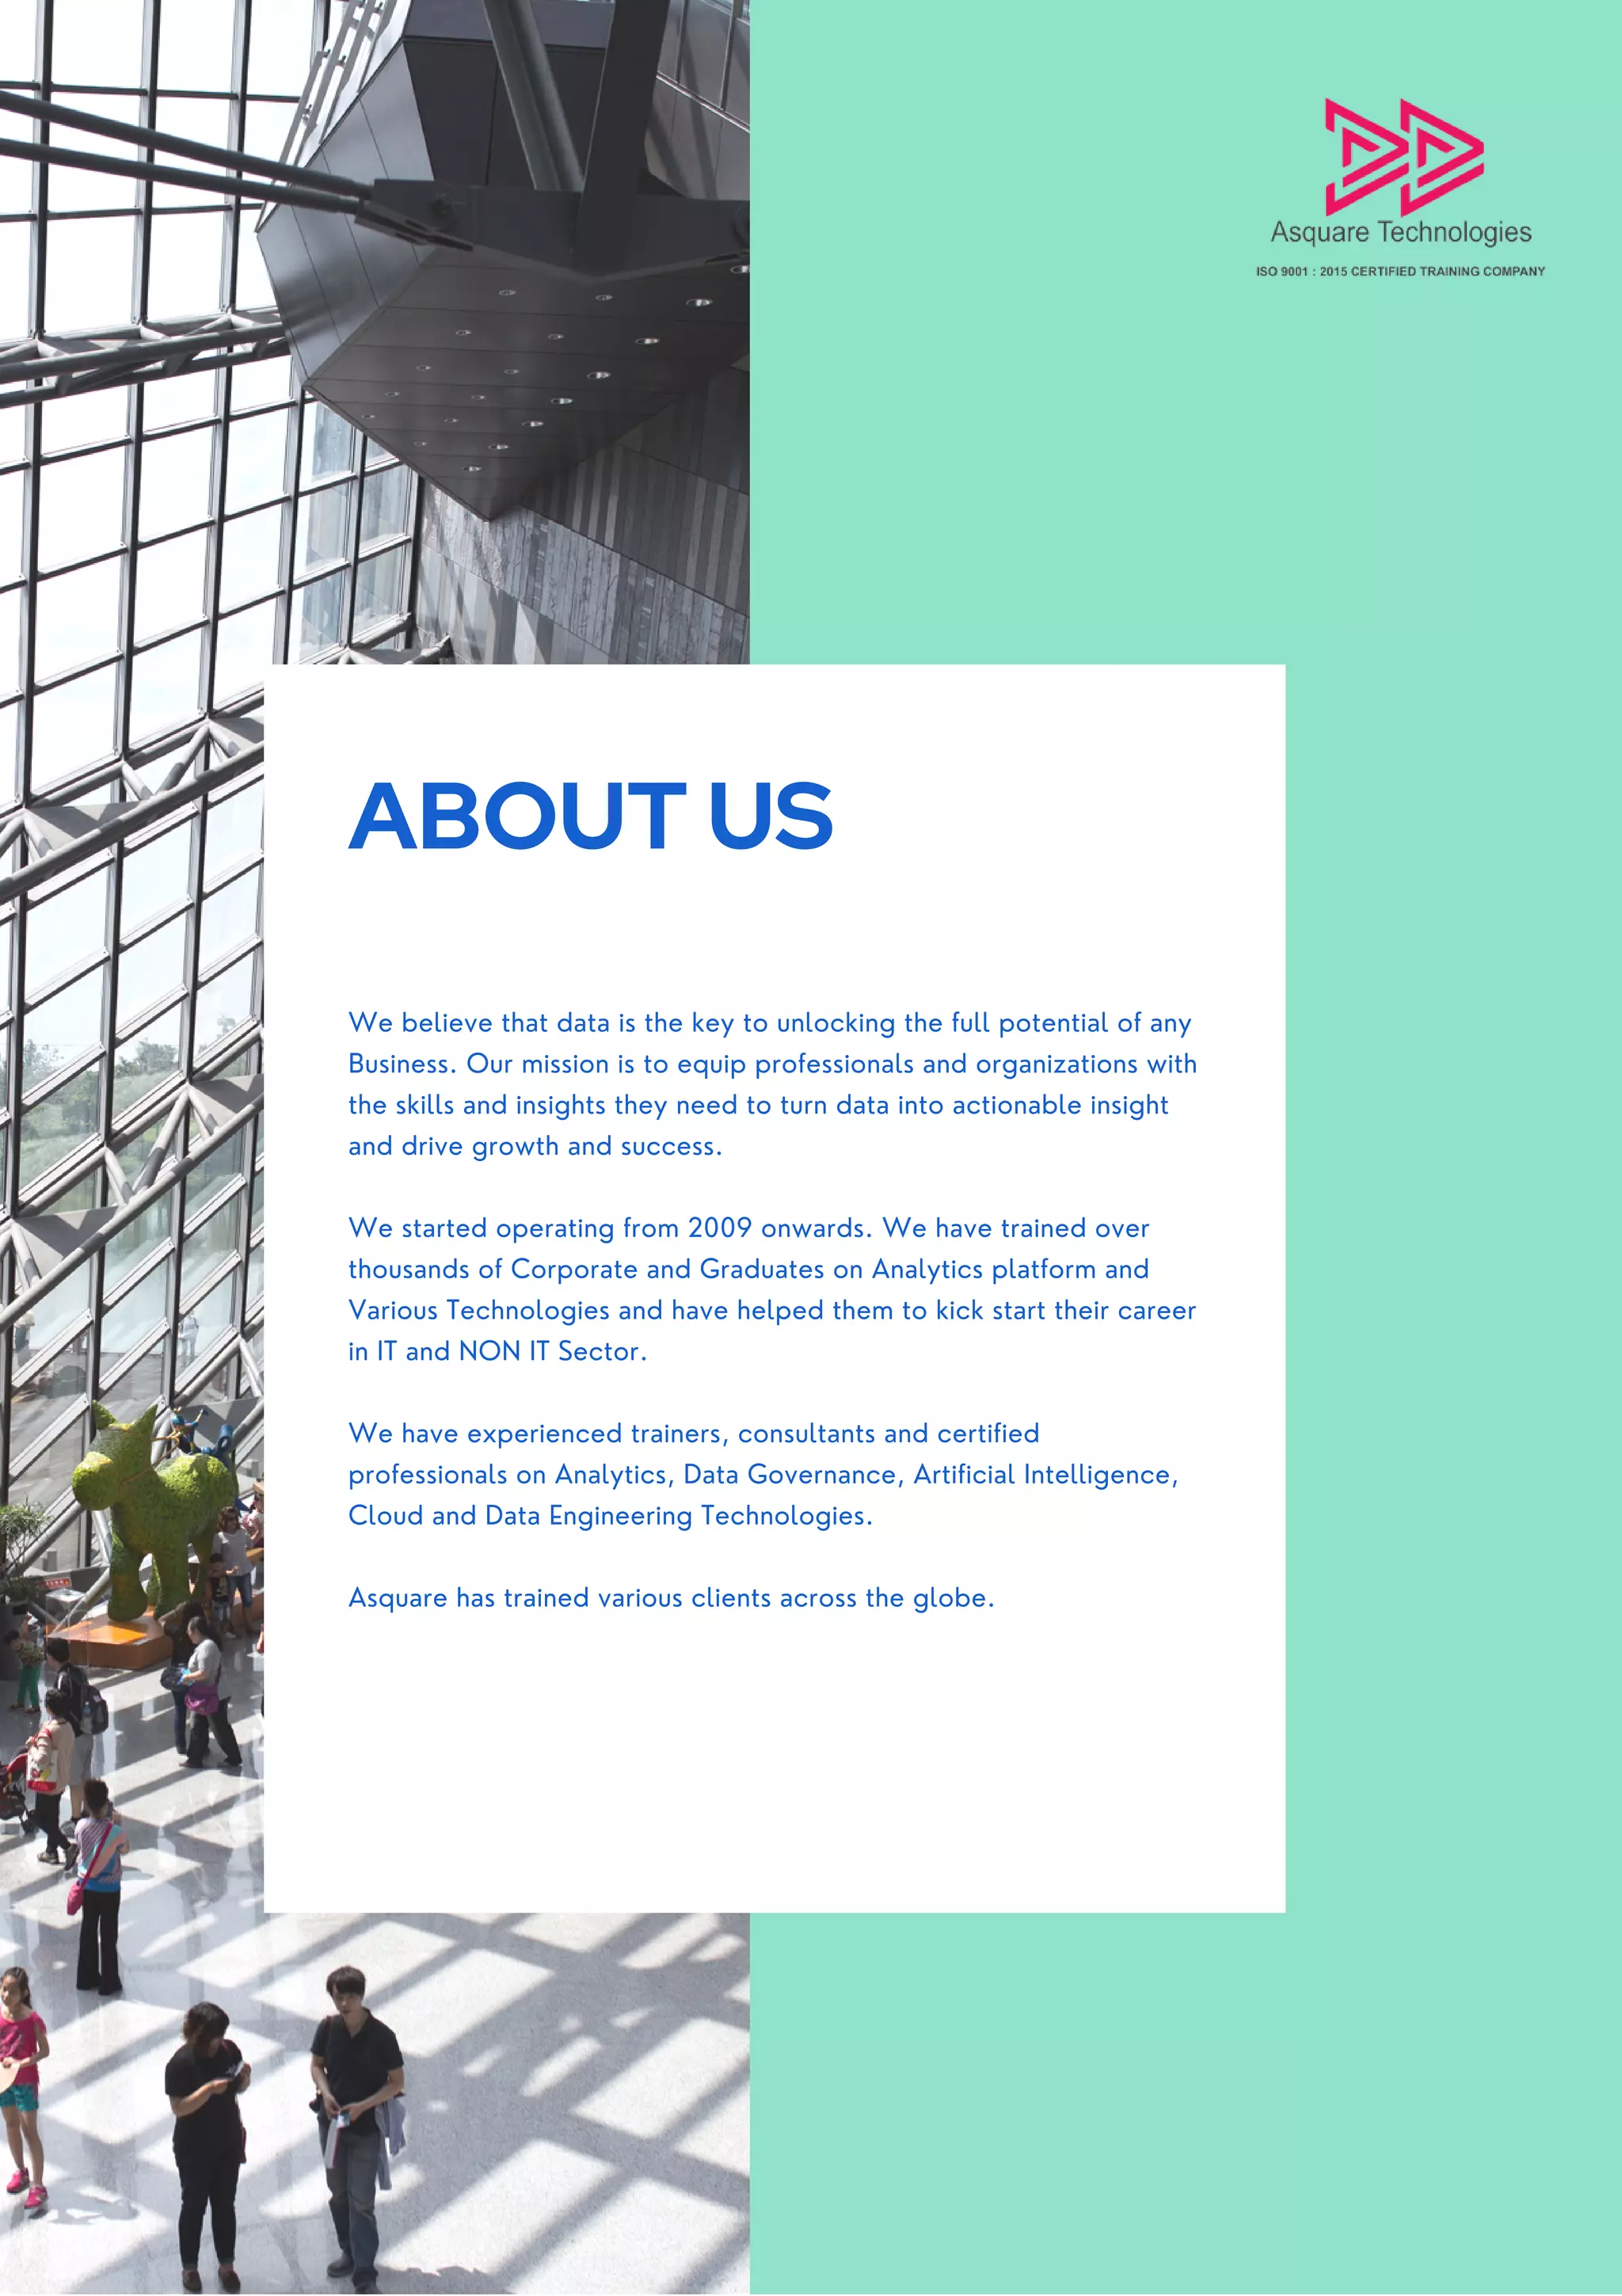
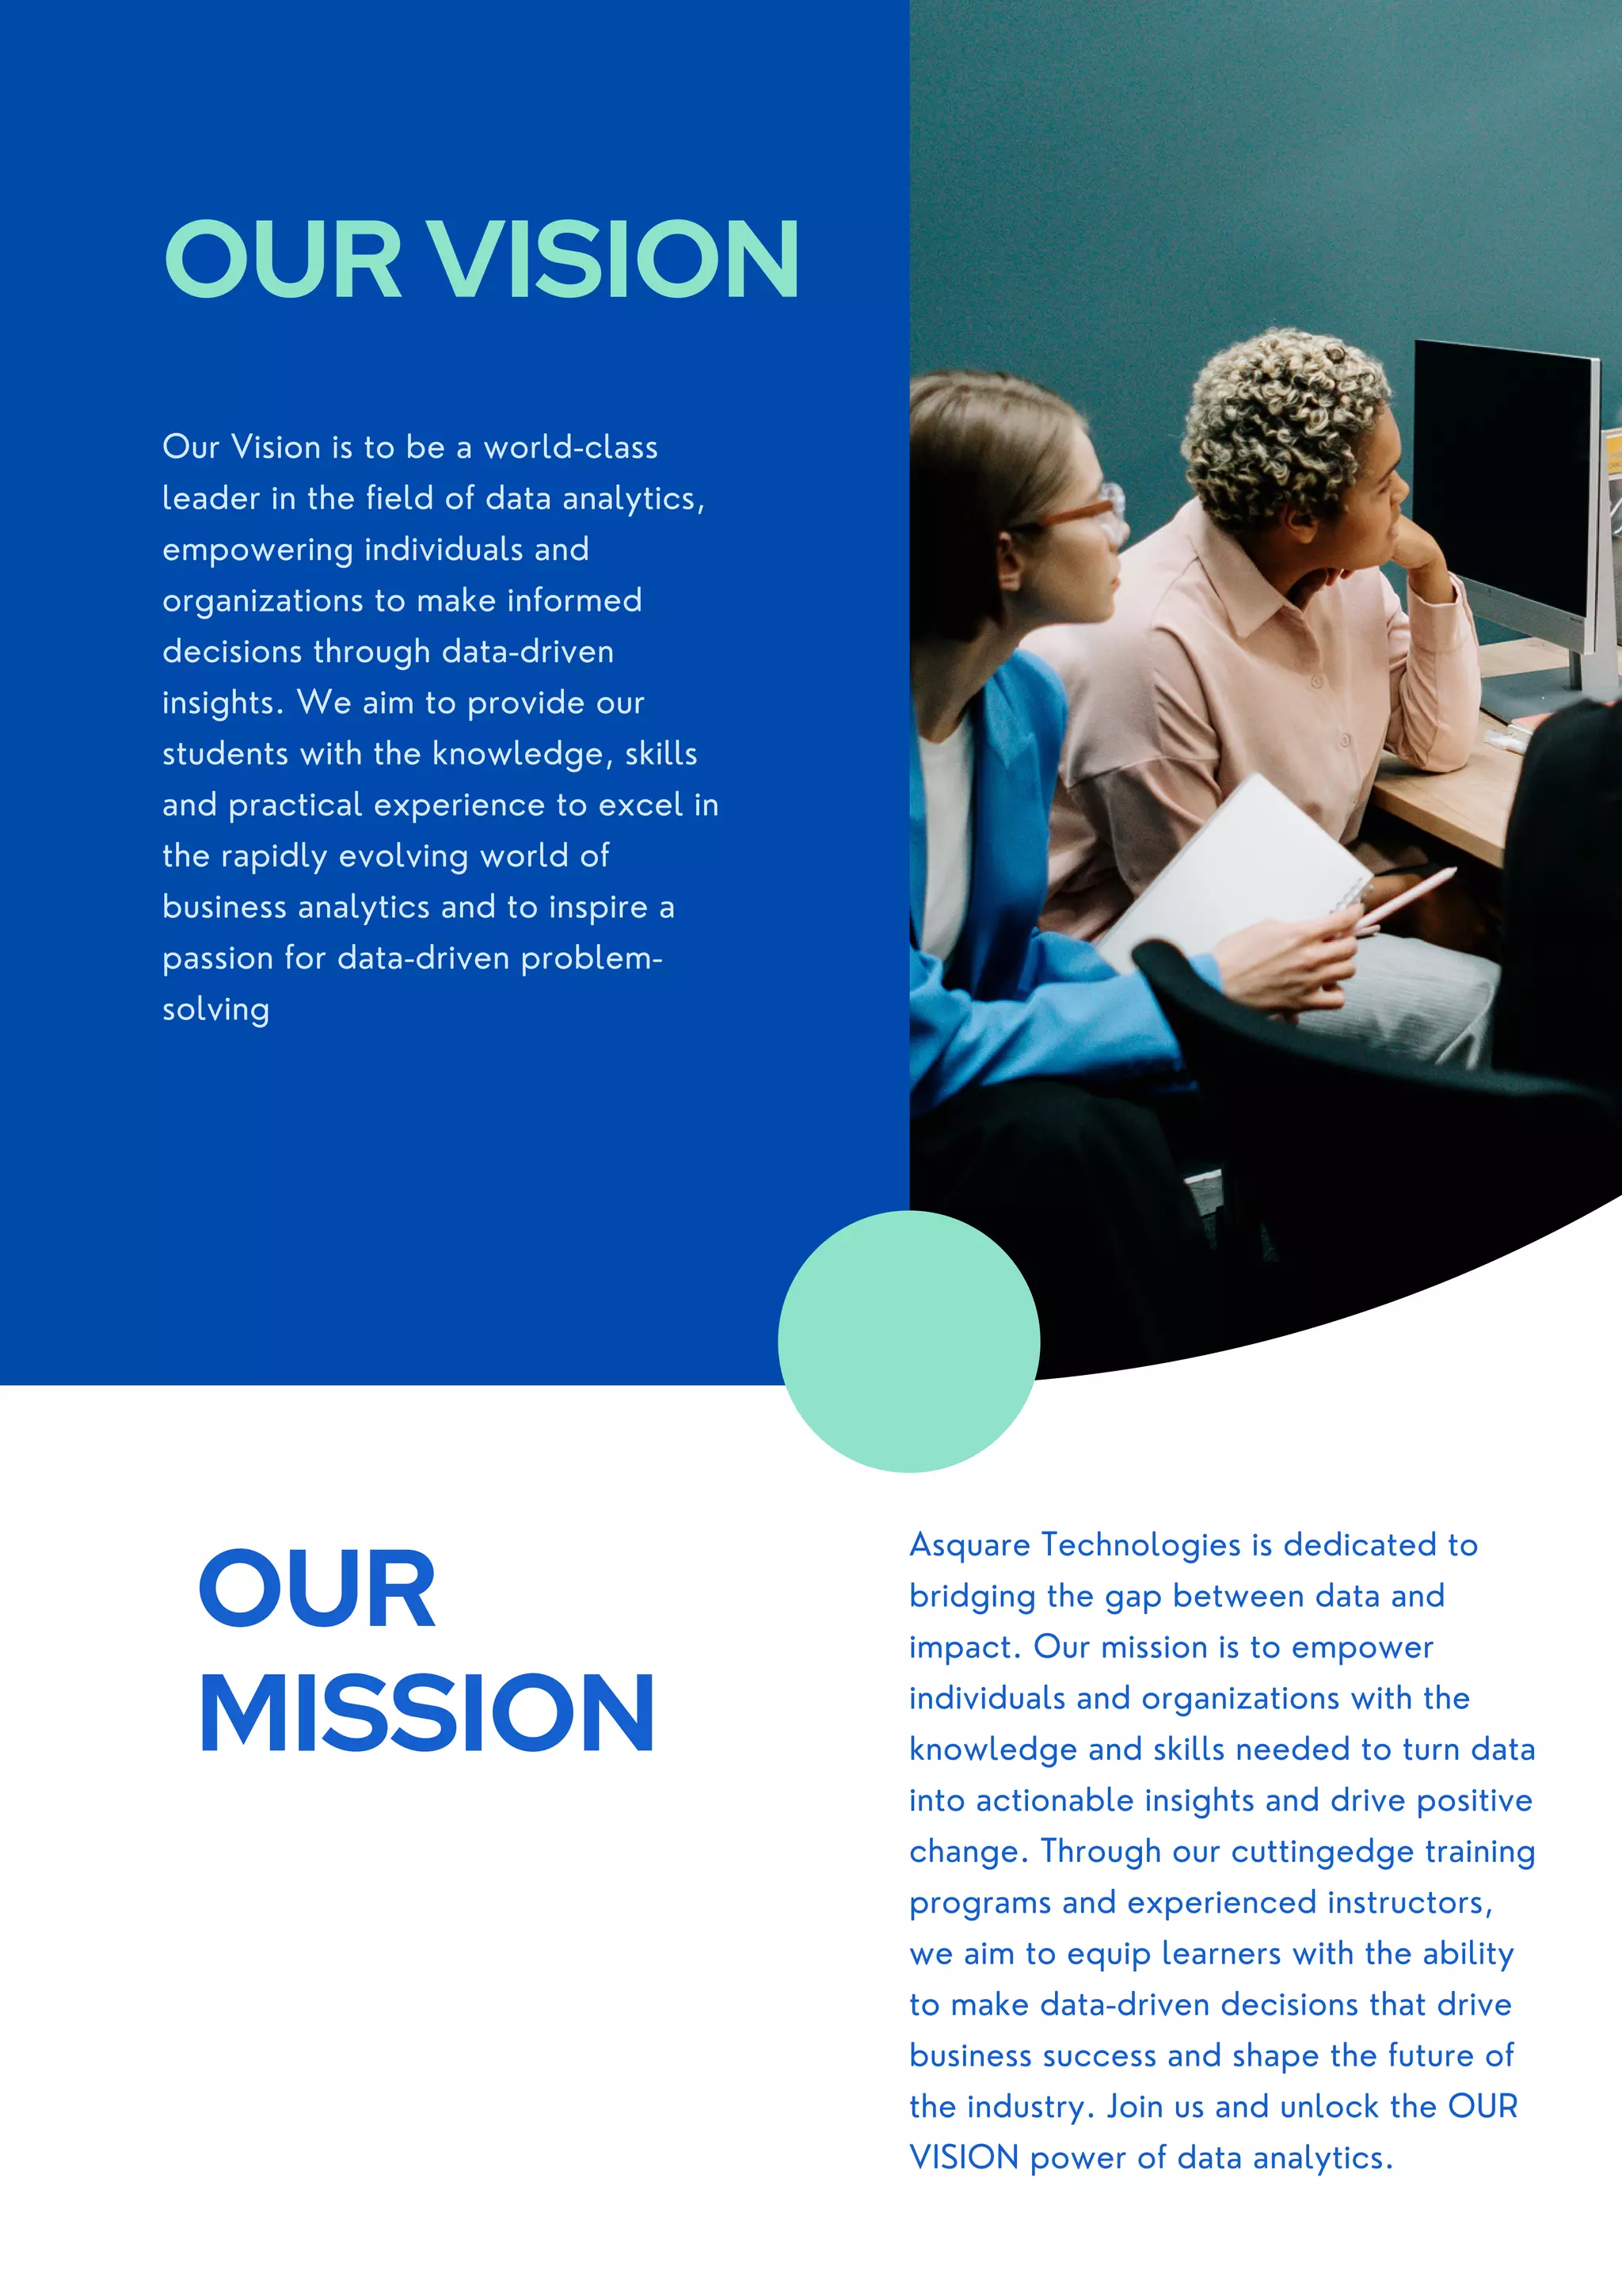


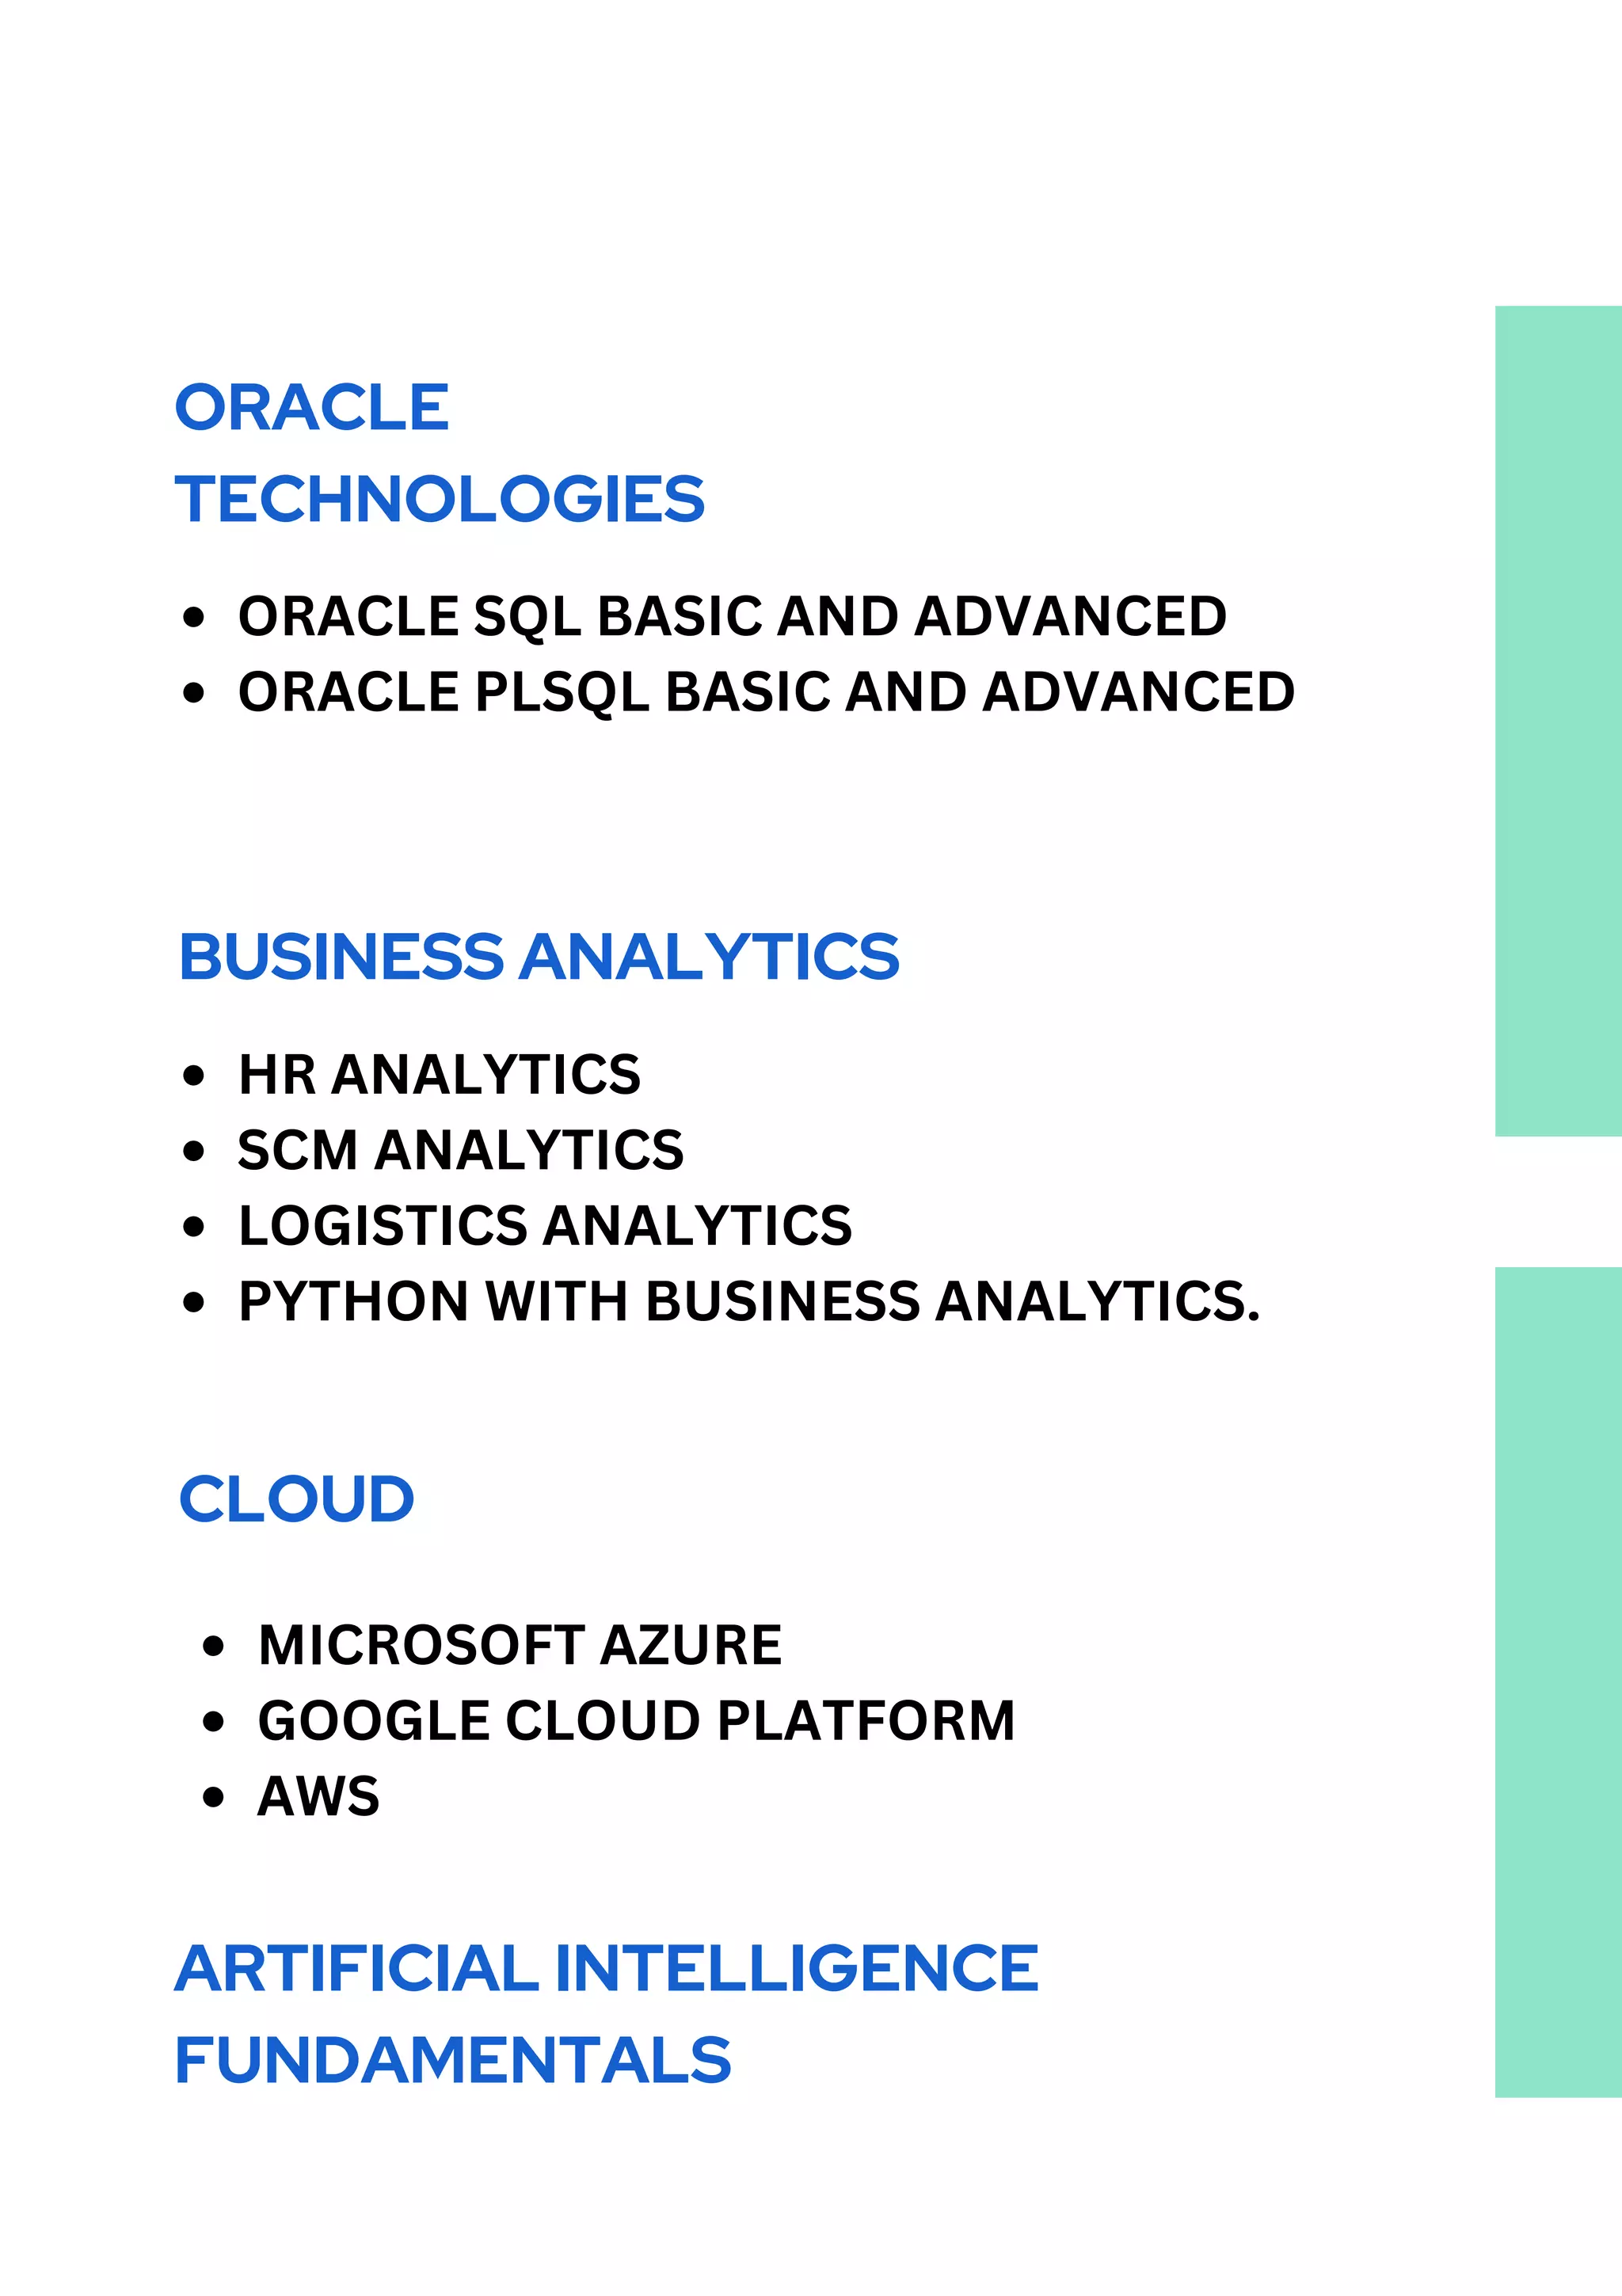

Asquare Technologies is an ISO 9001:2015 certified analytics training company founded in 2009, dedicated to empowering professionals with data skills for informed decision-making. The organization offers a range of courses in business analytics and data analytics, catering to various levels and using hands-on project work to enhance learning. Their mission is to bridge the gap between data and impact, helping individuals and organizations achieve success through data-driven insights.