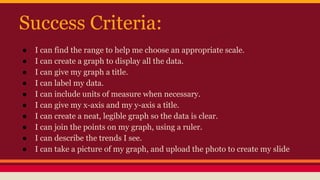
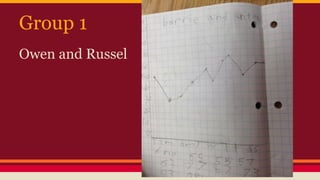
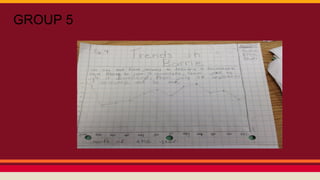
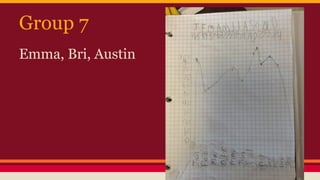
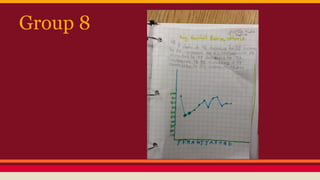
Creating Broken-line
Graphs on Chart Paper
Learning Goals:
● Create a broken-line graph on chart paper.
● Describe trends in the data.
● Upload photo of graph to create presentation slide.
Success Criteria:
●
●
●
●
●
●
●
●
●
●

I can find the range to help me choose an appropriate scale.
I can create a graph to display all the data.
I can give my graph a title.
I can label my data.
I can include units of measure when necessary.
I can give my x-axis and my y-axis a title.
I can create a neat, legible graph so the data is clear.
I can join the points on my graph, using a ruler.
I can describe the trends I see.
I can take a picture of my graph, and upload the photo to create my slide
Group 1
Owen and Russel
Group 2
Group 3
Group 4
GROUP 5

Group 5
Group 6 Matty, Lucas, Haden
Group 7
Emma, Bri, Austin
Group 8
GROUP 9

stuti, ellie, and
katie

we made our graph, we
labeled our x and y
axis, we described the
trends, we added a title
and we made it neat.
GROUP 10
GROUP 11
Thomas Y
Do you have any questions
about today’s lesson?
Question Board

Broken line graph on chart paper