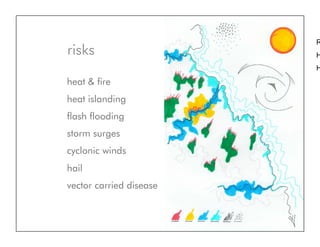
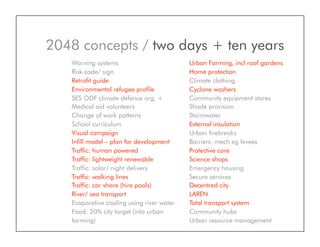
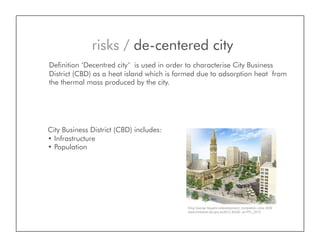
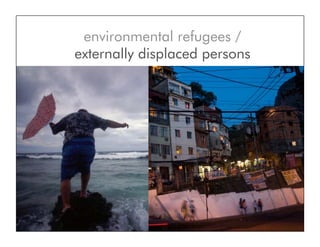
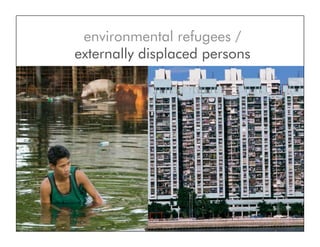
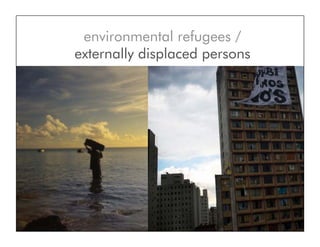
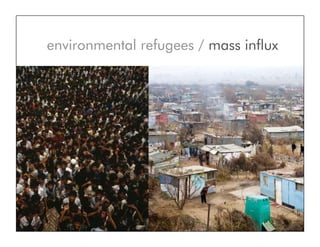
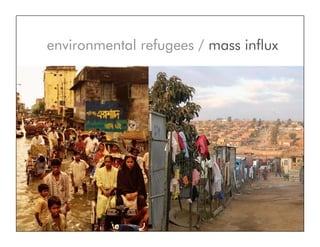
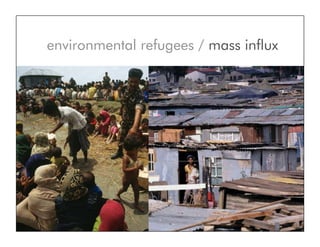
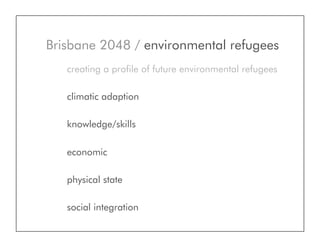
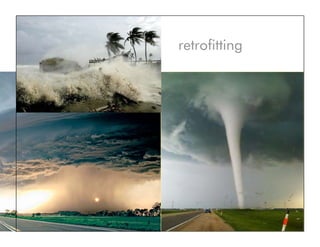
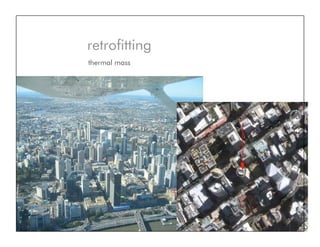
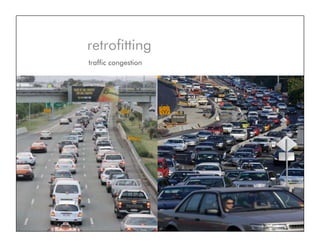
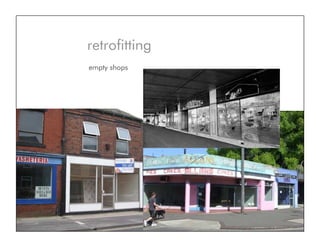
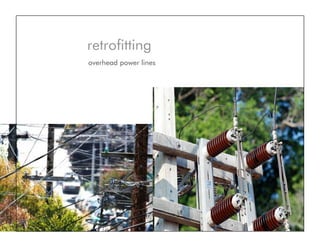
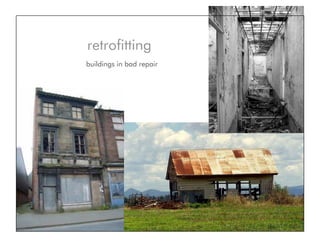
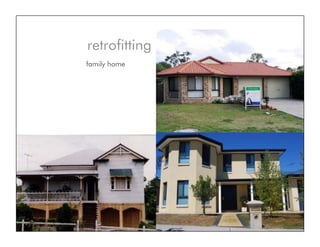
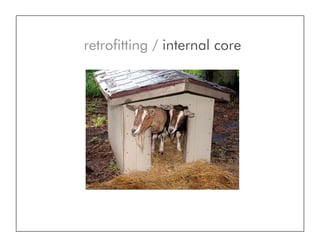
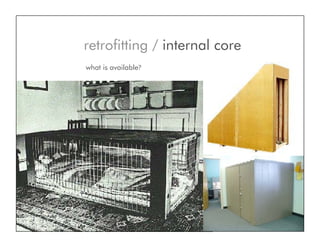
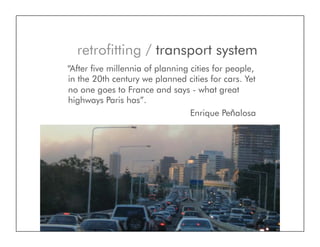
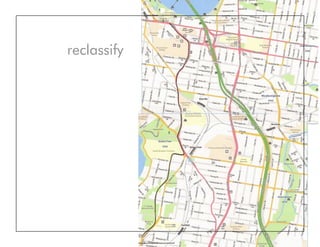
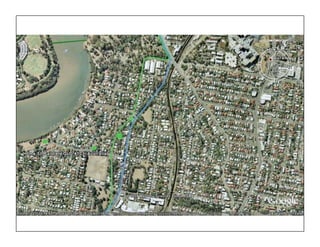
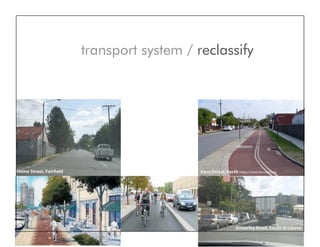
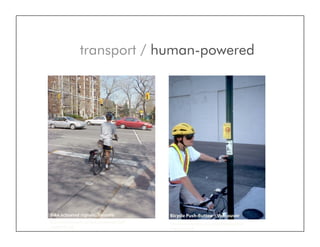
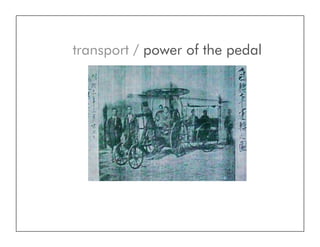
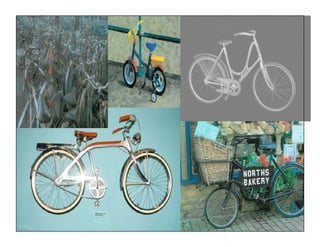
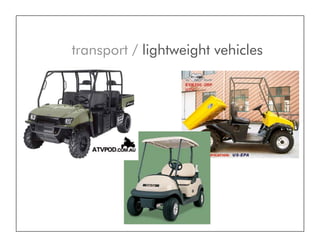
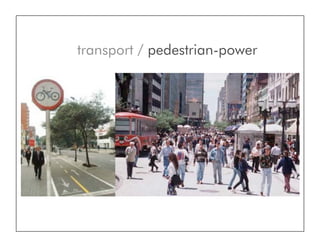
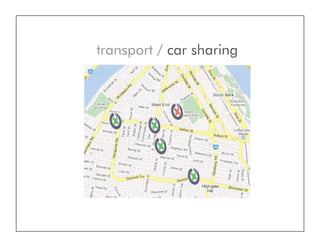
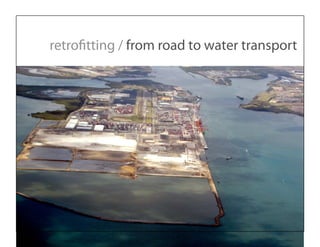
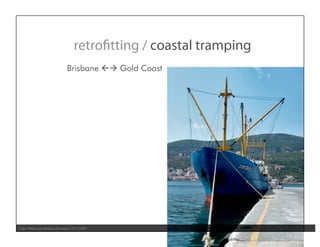
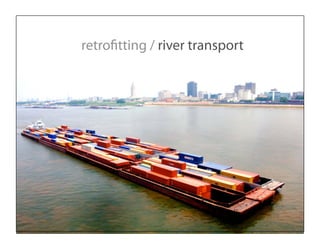
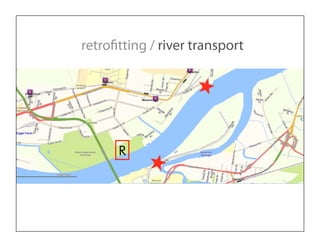
This presentation documents the results of a two day workshop themed Brisbane 2048 in which a group of six designers, academics and planners addressed the threats posed by climate change. Convened by QCA Design Futures Lecturer, Dr Tony Fry, the seminar and workshop aim to communicate the scale of the problems we face in South East Queensland as a result of climate change while also engaging the community with appropriate and affirmative responses. The workshop addressed the large scale impacts and threats of climate change, including environmental refugees, fires, floods, storms and cyclones and disease patterns. The six participants in the workshop – Larry Vint, Petra Perolini, Will Odom, Coral Gillett, Nora Kinnunen and Linda Carroli – developed three types of responses: preparatory actions, protective technologies and affirmative sustainable actions.
Convened by QCA Design Futures Lecturer, Dr Tony Fry, the seminar and workshop aim to communicate the scale of the problems we face in South East Queensland as a result of climate change while also engaging the community with appropriate and affirmative responses. Produced in October 2008 by workshop participants and Tony Fry.
Peter Jones, Smriti Shakdher, Prateeksha Singh
Clinical Synthesis Map: Cancer Care Pathways in Canadian Healthcare
Jones PH, Shakdher S and Singh P. Systemic visual knowledge translation for breast and colorectal cancer research. Current Oncology 2017 (in press).
The Clinical Map visually represents breast and colorectal cancer processes across Canadian provincial and territorial systems. A roadmap metaphor illustrates a system-wide view of patient flow across the stages of cancer care. Green “road signs” identify clinical cancer stages across the roadmap: Pre-Diagnosis, Peri-Diagnosis, Diagnostic Interval, Diagnosis, Treatment, Rehabilitation, After Care, and Survivorship (with Palliative Care expressed as an end point). The visual metaphor of seasonal trees visually connects these stages to the patient’s cancer journey from pre-diagnosis (summer) through treatment (winter), followed by new growth (spring) in survivorship.
The levels of primary, secondary and tertiary care guide the vertical dimension. Information and communications technology reaches across levels and stages, but is shown disconnected from primary care. The road-like pathways are colour-coded where experts differentiated care pathways between breast cancer (pink) and colorectal (blue). Where not distinguished (white), the pathways indicate current practices shared across the cancer journeys.
Yellow navigation signs indicate cancer events across primary care pathways. Starting with Prevention and ending with Long-term Care, these events show points for primary care continuity during cancer treatment. A parallel path below the stages indicates where some patients may also employ complementary or alternative therapies.
Significant areas of complexity generalized across cancer care are revealed in peri-diagnosis and the diagnostic interval pathways. A patient can be screen-detected (and then present to a family physician, shown in the breast cancer pathway) or may be initially diagnosed in primary care (white pathway). The circular pathways in the diagnostic cycle suggest multiple possible tests within primary care. With a primary care diagnosis, patients are referred and flow to secondary/tertiary cancer care. The stages of intake, biopsy, pathology, and confirmed diagnosis are shown, and the complex pathways of cancer treatment, shown on the map in a typical (not definitive) order of surgery, radiation/chemotherapy, and continuing treatment through assessment of outcome.
Paul McArthur, Jerry Koh, Vani Jain and Mali Bain
System Insights from ‘WellAhead’: A Social Innovation Lab Approach to Advance the Prioritization and Sustained Integration of Student Social and Emotional Wellbeing in K-12 Schools:
By Peter Stoyko
Complex systems are difficult to understand without the
aid of visuals. There are too many moving parts to mentally
keep track of. The parts interact in too many ways. The whole
system is cognitively overwhelming insofar as it cannot be
absorbed in one go without the aid of an external reference.
That is partly due to humans' inability to juggle more than
a few complicated ideas in working memory at one time.
Thus, visuals are a simplifying and organizing device that
complements the way human naturally think if they are
designed well. This poster is an early glimpse of a larger
project (called SystemViz) that explores what it means to
design such visuals well.
Resiliency Resources and Case Studies for your Architectural Practicegarrjacobs
This is a presentation given by Illya Azaroff from New York about his work with resilient housing and practice. Architects are being asked to understand where and how to build better in the face of mass migration, population growth, resource stress and associated risks posed by natural disasters and climate risk. The AIA and its members are at the forefront of addressing these issues highlighted by a commitment to the New Urban Agenda that aims to provide quality housing to people and communities around the world. Here in the US, we are coming to grips with the transformation of communities and the way we build to ensure a the health, safety and welfare of all.
CSCR Business #3: Green Buildings, Resilient Infrastructure, Climate Smart De...Sustainable Tompkins
Climate Smart & Climate Ready Conference Business Track #3 on April 20, 2013 at Tompkins County Public Library in Ithaca, NY. Graham Gillespie, HOLT Architects. CLIMATE THERAPY: Green Buildings, Resilient Infrastructure, and Climate Smart Design.
The New Photonomy - offering an exponentially fruitful abundance worldwide, P...Michael P Totten
Elevated solar photovoltaics sited on a fraction of existing cultivated lands, technically referred to as Agrivoltaic microgrids (plus batteries-controls), promises enhanced economic security for farmers, who generate onsite power and export excess power, while continuing to grow crops, pasture grasses and livestock grazing below the solar panels. Energy security is also enhanced as a result of the distributed design, or what the U.S. rural electric cooperatives call the new "agile fractal grid." The model builds upon the U.S. Dept. of Defense decree that all military bases transition to islandable microgrids capable of operation when the grid or pipelines collapse (whether due to physical attacks, cyberterrorism, cybercrime, or climate-triggered catastrophes). Recent analysis found it would only take a couple of percent of existing cultivated lands sited with agrivoltaics to generate nearly 100 of total global energy demand for all purposes. This 84-slide presentation provides both overview and details about this multi-benefits accruing energy service option: collapsing most GHG emissions from the energy sector (which now comprises 3/4th of total global emissions), a dozen other energy-spewed chemical SCARs ("social cost of atmospheric releases), eliminate need for massive land conversion to biofuels and threats to biodiversity destruction, and 90 percent decline in water extraction. All documented with citations and references.
Building cities and creating urban heat islandsKella Randolph
Urban areas are warmer than rural areas because of pavement, sidewalks brick buildings and such. They become urban heat islands and that can affect the weather nearby.
In March this year, Harbinger Consultants trialled an initiative in health promotion to raise awareness of dementia. The initiative sought to: raise money for dementia research through a sponsored 50km bike ride; and raise awareness of brain health and dementia through a BBQ breakfast event. Based on an action research approach, the idea of the Brainy Breakfast BBQ was to bring people together in a convivial environment to exchange information, share stories and generally catch up. This document reports on the event and provides recommendations for ongoing development of this initiative.
This pamphlet by Linda Carroli & JM John Armstrong captures scenes from our locality which show some of the nuances and subtleties of suburban environments. While there has been a blossoming of engagement with DIY and tactical urbanism, it tends to overlook the complexity and difficulty of suburban contexts. It also tends to overlook the activity that is already part of the suburban environment. This project endeavours to present personal accounts and narratives as a counter to the sometimes anti-suburban tone of current design, planning and academic discourse. It presents small scale encounters that indicate the suburbs operate at multiple scales and offer a diverse palette of engagements and actions.
This document may be edited, altered and updated from time to time. So please check back to redownload and re-read.
Harbinger Consultants delivers projects with the goal of positive impact and vibrant communities for regions, towns and cities. Our work includes research, strategic planning and stakeholder engagement and we develop social, urban, regional and cultural strategy. With a track record of projects founded on values based and integrated methods, we apply place-based and innovative approaches to realise community wellbeing and prosperity.
This presentation was prepared for DAB220 Placemaking in Architecture, QUT School of Design, to assist students with Project Two. It provides images of pedestrian shelters and urban interventions. Used for education and teaching purposes only.
Long Time No See Project: participation designlinda carroli
Long Time No See? is a new project supported by the Australia Council for the Arts Special National Broadband Initiative to create an innovative 'next generation' artwork optimised for the forthcoming National Broadband Network (NBN).
We will create a living work that develops dialogs around time, community and futures, working with a range of nascent communities of interest, initially drawn from NBN connected locations, students and special interest groupings such as Festival audiences.
The most boring powerpoint in the world. Prepared for DAB220 Placemaking in Architecture (QUT) tutorial. For teaching purposes only, using sketches and drawings sourced from internet searches.
'Speak: a hypertext essay' reproduces texts and images from an electronic literary work exploring the essay form using multimedia developed in 2001 - http://ensemble.va.com.au/speak. The book was produced in the following year. It also explores identity through a shifting personal and critical voice; intentionally abstract and experiential; highly constructed but somehow formless. The essay is structured as a series of fragments that are hyperlinked in their online form. Aptly described by one critic as booklike, the work is a simple experiment in engaging the idea of the book that isn't.
Suburban Train Station as Community Hub: Proposal for Carseldine Stationlinda carroli
I've been working on this study of a local train station in support of Transit Oriented Development. In it, I propose that community infrastructure (e.g. community spaces and offices for non-profit organisations) and design for sustainability should be provided at train stations. If more parking is required then those structures can and should also accommodate community uses.
I have also posted this to Live Local as my first experiment. Live Local is an online social networking place to share stories and ideas about improving your community. I will be blogging about this venture for Placed.
http://www.livelocal.org.au/experiment/126/precinct-study-carseldine-train-station
This presentation was developed for a guest lecture at QUT in April 2009 for a subject about cultural futures. It asks the question, 'how are we to live?' and considers urban innovation and creativity. However, it does not really attempt to answer that question.
This presentation was prepared to support the induction process of new Board members of a Board I chaired for several years. It presents basic and introductory information sourced from various experts. It was intended to help Board members understand the role of the Board, their role as Board members and the difference between Board/policy and Operational roles. Feel free to use and adapt this slide show. I know how hard it is to Chair a volunteer Board and how frustrating it can be having to reinvent the wheel for processes like Board member induction. Some pictures would probably help this. A manual was also produced for distribution to Board members and that has been uploaded to Scribd.
This slide presentation accompanies the various reports and proposals about QUT Carseldine. The State Government Community Forum proposed that QUT Carseldine, a university campus located in Brisbane's northern suburbs, be repurposed as a social enterprise and social innovation hub. The slide presentation scopes the context and highlights the diversity and dynamism of the social enterprise sector in the Greater Brisbane region.
Indigenous Business Development :: JM John Armstronglinda carroli
JM John Armstrong is the Principal of Harbinger Consultants. He has spent many years working with Indigenous enterprises and entrepreneurs. In his work with Blak Business Smart Business, he developed the Business Readiness Assessment method as a culturally appropriate and responsive approach to business development with Indigenous entrepreneurs and communities. This presentation for the IQPC Conference themed "strengthening Indigenous communities" describes the Assessment process, as a capacity building method, and the achievements of Blak Business.
This presented was developed for the Ministerial Regional Community Forum for Greater Brisbane, now called the State Government Community Forum. It accompanied a paper that proposed that the State Government's Centre of Excellence for Climate Change directly engage with artistic practice and practitioners to develop interdisciplinary spaces for exploring climate science. The proposal attracted a great deal of community interest, but was not pursued by the government.
EASY TUTORIAL OF HOW TO USE CAPCUT BY: FEBLESS HERNANEFebless Hernane
CapCut is an easy-to-use video editing app perfect for beginners. To start, download and open CapCut on your phone. Tap "New Project" and select the videos or photos you want to edit. You can trim clips by dragging the edges, add text by tapping "Text," and include music by selecting "Audio." Enhance your video with filters and effects from the "Effects" menu. When you're happy with your video, tap the export button to save and share it. CapCut makes video editing simple and fun for everyone!
Storytelling For The Web: Integrate Storytelling in your Design ProcessChiara Aliotta
In this slides I explain how I have used storytelling techniques to elevate websites and brands and create memorable user experiences. You can discover practical tips as I showcase the elements of good storytelling and its applied to some examples of diverse brands/projects..
Book Formatting: Quality Control Checks for DesignersConfidence Ago
This presentation was made to help designers who work in publishing houses or format books for printing ensure quality.
Quality control is vital to every industry. This is why every department in a company need create a method they use in ensuring quality. This, perhaps, will not only improve the quality of products and bring errors to the barest minimum, but take it to a near perfect finish.
It is beyond a moot point that a good book will somewhat be judged by its cover, but the content of the book remains king. No matter how beautiful the cover, if the quality of writing or presentation is off, that will be a reason for readers not to come back to the book or recommend it.
So, this presentation points designers to some important things that may be missed by an editor that they could eventually discover and call the attention of the editor.
Fonts play a crucial role in both User Interface (UI) and User Experience (UX) design. They affect readability, accessibility, aesthetics, and overall user perception.
Maximize Your Content with Beautiful Assets : Content & Asset for Landing Page pmgdscunsri
Figma is a cloud-based design tool widely used by designers for prototyping, UI/UX design, and real-time collaboration. With features such as precision pen tools, grid system, and reusable components, Figma makes it easy for teams to work together on design projects. Its flexibility and accessibility make Figma a top choice in the digital age.
Can AI do good? at 'offtheCanvas' India HCI preludeAlan Dix
Invited talk at 'offtheCanvas' IndiaHCI prelude, 29th June 2024.
https://www.alandix.com/academic/talks/offtheCanvas-IndiaHCI2024/
The world is being changed fundamentally by AI and we are constantly faced with newspaper headlines about its harmful effects. However, there is also the potential to both ameliorate theses harms and use the new abilities of AI to transform society for the good. Can you make the difference?
1. Brisbane 2048
these times they are a changing
Master of Design Futures Program
Queensland College of Art
2. R
risks H
H
heat & fire
heat islanding
flash flooding
storm surges
cyclonic winds
hail
vector carried disease
3. 2048 concepts / two days + ten years
Urban Farming, incl roof gardens
Warning systems
Home protection
Risk code/ sign
Climate clothing
Retrofit guide
Cyclone washers
Environmental refugee profile
Community equipment stores
SES ODF climate defence org. +
Shade provision
Medical aid volunteers
Stormwater
Change of work patterns
External insulation
School curriculum
Urban firebreaks
Visual campaign
Barriers: mech eg levees
Infill model – plan for development
Protective core
Traffic: human powered
Science shops
Traffic: lightweight renewable
Emergency housing
Traffic: solar/ night delivery
Secure services
Traffic: walking lines
Decentred city
Traffic: car share (hire pools)
LAREN
River/ sea transport
Total transport system
Evaporative cooling using river water
Community hubs
Food: 20% city target (into urban
Urban resource management
farming)
4. risks / de-centered city
Definition ‘Decentred city’ is used in order to characterise City Business
District (CBD) as a heat island which is formed due to adsorption heat from
the thermal mass produced by the city.
City Business District (CBD) includes:
• Infrastructure
• Population
King George Square redevelopment; completion June 2009
www.brisbane.qld.gov.au/BCC:BASE::pc=PC_2072
5. de-centered city/ thermal mass
Causes:
• building materials
• building and street design
Result:
• heat islanding
• little day and night temperature difference
• a warming of 20 from 2048
• +100 temperature difference from outer suburbs and the city centre
7. de-centered city/ thermal mass
stage 1:
• money leaving
stage 2:
• rush of departures
• business closures
stage 3:
• poor move in
8. de-centered city/ thermal mass
stage 4:
• poor move out
• CBD becomes too uncomfortable
for the poor
stage 5:
• hyper neglect
• very undesirable place
flickr.com/photos/craigjewell/2185542104/
Abandoned Albion Flour Mill ,Brisbane
9. de-centered city/ thermal mass
stage 6:
• demolition
• city is getting flattened
stage 7:
• recolonise city in a climate adaptive
infrastructure.
flickr.com/photos/81021905@N00/427863618/
Bellevue Hotel demolished 20 April 1979
10. Tokyo
www.skyscrapercity.com/showthread.php?
t=2008
40. Brisbane 2048 / external insulation
retrofitting external insulation…
onto existing buildings…
to reduce heat load on building envelope…
and reduce energy consumed through
cooling…
58. retrofitting / urban farming
cultivating,
processing and
distributing food
in or around a city
Bailkey, M. and J. Nasr. 2000. From Brownfields to Greenfields: Producing Food in North American Cities.
Community Food Security News. Fall 1999/Winter 2000:6
59. 50% of the world’s population lives in cities;
by 2015 26 cities exceed 10 Million People
60. average produce item travels 1500 miles
4 liters of fuel / 100 lbs when shipped by truck
71. retrofitting / transport system
“After five millennia of planning cities for people,
in the 20th century we planned cities for cars. Yet
no one goes to France and says - what great
highways Paris has”.
Enrique Pe alosa
72. retrofitting / transport system
reclassify streets for a more efficient traffic flow
scenario which caters to alternative forms of transport
adjust power balance of existing forms of transport
explore and encourage alternative forms of transport
build responsive infrastructure
build amenities along bicycle and pedestrian paths
adopt a new culture
75. transport system / reclassify
Home Street, Fairfield Kent Street, Perth http://www.bv.com.au
Annerley Road, South Brisbane
76. transport / human-powered
Bike actuated signals, Toronto Bicycle Push-Button – Vancouver
http://www.toronto.ca/cycling/bikeplan/pdf/ http://www.toronto.ca/cycling/bikeplan/pdf/
chapter04.pdf chapter04.pdf