Brightness at Varying Distances Lab
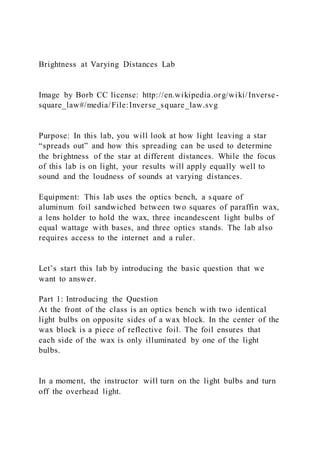
Image by Borb CC license: http://en.wikipedia.org/wiki/Inverse-square_law#/media/File:Inverse_square_law.svg
Purpose: In this lab, you will look at how light leaving a star “spreads out” and how this spreading can be used to determine the brightness of the star at different distances. While the focus of this lab is on light, your results will apply equally well to sound and the loudness of sounds at varying distances.
Equipment: This lab uses the optics bench, a square of aluminum foil sandwiched between two squares of paraffin wax, a lens holder to hold the wax, three incandescent light bulbs of equal wattage with bases, and three optics stands. The lab also requires access to the internet and a ruler.
Let’s start this lab by introducing the basic question that we want to answer.
Part 1: Introducing the Question
At the front of the class is an optics bench with two identical light bulbs on opposite sides of a wax block. In the center of the wax block is a piece of reflective foil. The foil ensures that each side of the wax is only illuminated by one of the light bulbs.
In a moment, the instructor will turn on the light bulbs and turn off the overhead light.
1. How does the brightness of each side of the wax block compare when the bulbs are both equal
distances from the wax?
a) Both sides of the wax are approximately the same brightness
b) The left side of the wax is noticeably brighter
c) The right side of the wax is noticeably brighter
Your question for this experiment is: If we add a second identical light bulb to the left side of the optics track, how far must the two light bulbs be from the wax in order to make both sides of the wax appear equally bright?
2. What is your prediction? If the single light bulb on the right side is 20 cm from the wax, how
far away do you think the two light bulbs will need to be from the wax in order to produce an
equal amount of brightness on their side of the wax?
Part 2: Computer Simulation
Open your internet browser and go to the online Flux Simulator at http://astro.unl.edu/classaction/animations/stellarprops/lightdetector.html. The simulation shows two light bulbs and two light sensors. The number on the sensors can be considered a numerical value of the brightness at that location. Take a few minutes to play around with the controls and see what you can do to increase and decrease the brightness readings.
3*. Set the wattage of the top bulb to 50 and use the simulation and your calculator to fill in the
table below. For columns 3 and 4, note that B1 is always 3.979.
Distance from bulb
Brightness Value
B1/R
B1/R2
R = 1.0
B1 = 3.979
R = 2.0
B =
R = 3.0
B =
R = 4.0
B =
R = 5.0
B =
*Note that in the last column, only R is squared, B1 is not being squared.
4. The brightness value at R = 2.0 is:
a) approximately half of the brightness value at R = 1.0
b) significantly more than hal ...
1The Luminosity of the Sun – due Oct 4 if we observe on .docxjoyjonna282
1
The Luminosity of the Sun – due Oct 4 if we observe on Sep 27
This activity including the homework will be worth a total of 35 points.
READ AT LEAST PAGES 1-4 OF THE HANDOUT BEFORE THE LAB SESSION!
Make sure you understand 1) the quantities that will be measured, and 2) what a photometer is. You will need to
use the quantities that you measure in the last section of the lab that you will do outside of class as homework
During the lab session, you will make some measurements. All of your data should be recorded in the appropriate
places on sheet given out during the lab . Afterwards, you will be asked to answer relevant questions and perform
some calculations using the data. Please place your answers in the spaces provided in the handout. You will share
data with members of your observing group but all calculations and answers to questions should be done by you
alone.
Checklist for work to be completed during the lab session: (order of the activities is not important)
1) With members of your observing group, set-up your light bulb, baffle, and paraffin block facing the Sun as
sketched in Figure 4. Page 3 gives detailed instructions.
2) With members of your observing group, make the measurements to fill in the table on the data sheet passed
out at the start of the lab.
3) Look through the telescopes that are set up just outside the lecture hall. Answer questions and make the
drawing on the data sheet.
4) Listen to a mini-lecture on the Sun in the Lecture Hall
Due date for turning in the lab assignment is one week after the lab session (October 4, if it is clear on
September 27 ).
1. Introduction
The temperature of the Earth is determined by the luminosity of the Sun. Although Earth has a hot molten core,
the Sun contributes 99.98% of the energy that heats our planet. The next largest heat source (< 0.02%) is the
decay of long-lived radioactive isotopes in Earth's interior. If the Sun were to turn off suddenly, the Earth's
surface temperature would drop by ~ 250oC and all the water on Earth would turn to ice. On the other hand, if
the Sun were much brighter, or much closer to the Earth, solar radiation would raise the planet's surface
temperature and all our rivers, lakes and oceans would vanish in a puff of steam.
The total amount of energy that the Sun radiates into space per second is called the solar luminosity (Lsun), which
is measured in energy per unit time, or Watts, just like a light bulb. The solar energy reaching the Earth is
measured by the solar constant, FSC. The solar constant is defined as the total amount of solar energy that enters
the top of the Earth's atmosphere per unit time per unit area, with an average distance of the Earth from the Sun of
“The Sun, with all the planets revolving around it, and depending on it, can still ripen a bunch of grapes as
though it had nothing else in the Universe to do.”
--Galileo Galilei
IF THE WEATHER IS BAD ...
Chapter 1924. If you dip your finger repeatedly into a puddle of.docxcravennichole326
Chapter 19
24. If you dip your finger repeatedly into a puddle of water, it creates waves. What happens to the wavelength if you dip your finger more frequently?
Chapter 20
29. What two physics mistakes occur in a science fiction movie that shows a distant explosion in outer space, where you see and hear the explosion at the same time?
Chapter 21
26. Tom Senior makes music by setting small columns of air into vibration by blowing across the ends of drinking straws of various lengths. Which straws, the short ones or the long ones, produce lower pitch? What would you expect of the pitch produced by the much larger musical instrument behind Tom that uses resonant air columns excited by striking the ends of the tubes with paddles?
Chapter 26
5. Which has the shorter wavelengths, ultraviolet or infrared? Which has the higher frequencies?
Chapter 27
17. On a TV screen, red, green, and blue spots of fluorescent materials are illuminated at a variety of relative intensities to produce a full spectrum of colors. What dots are activated to produce yellow? Magenta? White?
Chapter 28
7. Why is the lettering on the front of some vehicles “backward”?
Chapter 29
3. Why do radio waves diffract around buildings, while light waves do not?
Chapter 30
4. Ultraviolet light causes sunburns, whereas visible light, even of greater intensity, does not. Why is this so?
32. Cite at least two reasons for predicting that LEDs will emerge as more popular than CFLs.
Name
Date
Class
Lab 28: Diffraction and Interference
Purpose
To study single slit diffraction and double slit interference patterns
Background
It has long been known that if you shine light through narrow slits that are spaced at small intervals, the light will form a diffraction pattern. A diffraction pattern is a series of light and dark areas caused by wave interference. The
wave interference can be either constructive (light areas) or destructive (dark areas). In this experiment, you will shine a laser through a device with two slits where the spacing can be adjusted and investigate the patterns that are
produced on the far side of the slits.
Skills Focus
Predicting, drawing conclusions, observing, interpreting data, making generalizations, applying concepts
Procedure
1. Start Virtual Physics and select Diffraction and Interference from the list of assignments. The lab will open in the Quantum laboratory.
2. A laser is used as the light source in this experiment because it has a single wavelength. Therefore, you will not see diffraction patterns from other wavelengths interfering in the image. What is the wavelength of the laser?
What is the spacing of the two slits on the two slit device? This is the gap
between the two different slits. How do the wavelength of the laser and the spacing of the slits compare?
3. Predicting
How will the diffraction pattern change as the wavelength is
made smaller and the slit spacing remains the same? Hint: Think about the spacing as an obstacle that ...
1.Matching How do astronomers determine the physical char.docxgasciognecaren
1.
Matching:
How do astronomers determine the physical characteristics of stars? Match each characteristic of stars with an important technique that astronomers use to determine that characteristic. Refer to Table 18.2 and page 660 in Chapter 19 when answering this question. Each answer will be used once.
How do Astronomers determine the …
of a star?
Technique
Surface temperature
Radial Velocity
Mass
Diameter
Luminosity
Distance
Techniques
for Question 1: Measure the apparent brightness and determine the distance to the star / Measure the Doppler shift / Measure the light curves and Doppler shifts for eclipsing binary stars / Measure the star’s parallax / Measure the peak wavelength of the star’s spectrum and apply Wien’s Law / Measure the period and radial velocity curves for spectroscopic binary stars
2. Matching:
(Review Question 4 on page 682 in OSA) Which method would you use to obtain the distance to each of the following? Choose the best answer below:
Method
A.
An asteroid crossing Earth’s orbit
B.
A star astronomers believe to be no more than 50 light-years from the Sun
C.
A tight group of stars in the Milky Way Galaxy that includes a significant number of variable stars.
D.
A star that is not variable but for which you can obtain a clearly defined spectrum.
Methods
for Question 2: RR Lyrae and/or Cepheid variable stars can be used to determine the distance / Measure the parallax of the object and calculate the distance by triangulation / The information you have is sufficient to allow you to place the star in the correct location on the H-R diagram; this allows you to accurately estimate the object’s luminosity and, using the inverse-square law, its distance / Send a radar beam toward the object and measure the return time
†
3.
(Review Question 5 on page 682 in OSA) What are the luminosity class and spectral type of a star with an effective temperature of 5000 K and a luminosity of 100 Lsun?
A.
First, calculate the radius of the star relative to the Sun using the equation L*/Lsun = (R*/Rsun)2 (T*/Tsun)4. The radius of this star is ( 1/100 times / 1/10 times / 1/5.5 times / the same as / 10 times / 13.5 times / 100 times) the radius of the Sun.
B.
The luminosity class of this star is ( Ia / Ib / II / III / IV / V / wd ). This indicates that it is a ( Bright Supergiant / Less Luminous Supergiant / Bright Giant / Giant / Subgiant / Main Sequence / White Dwarf ) star. If you need help, refer to page 676 in OSA.
C.
The spectral type of this star is ( O / B / A / F / G / K / M ). If you need help, refer to Table 17.2 on page 601 in OSA.
†
4.
What are the spectral type and luminosity class of the star Regulus which has a surface temperature of 10,750 K and a luminosity of 220 Lsun? Regulus is in the constellation Leo and represents the Lion’s Heart.
A.
First, calculate the radius of Regulus relative to the Sun using the equation L*/Lsun = (R*/Rsun)2 (T.
Background MaterialAnswer the following questions after revi.docxwilcockiris
Background Material
Answer the following questions after reviewing the “Kepler's Laws and Planetary Motion” and “Newton and Planetary Motion” background pages.
Question 1: Draw a line connecting each law on the left with a description of it on the right.
planets move faster when close to the sun
planets orbit the sun in elliptical paths
planets with large orbits take a long time to complete an orbit
Question 2: When written as P2 = a3 Kepler's 3rd Law (with P in years and a in AU) is applicable to …
a) any object orbiting our sun.
b) any object orbiting any star.
c)
any object orbiting any other object.
Question 3: The ellipse to the right has an eccentricity of about … a) 0.25
b) 0.5
c) 0.75
d) 0.9
Question 4: For a planet in an elliptical orbit to “sweep out equal areas in equal amounts of time” it must …
a) move slowest when near the sun.
b) move fastest when near the sun.
c) move at the same speed at all times.
d) have a perfectly circular orbit.
Question 5: If a planet is twice as far from the sun at aphelion than at perihelion, then the strength of the gravitational force at aphelion will be as it is at perihelion.
a) four times as much
b) twice as much
c) the same
d) one half as much
e) one quarter as much
Kepler’s 1st Law
If you have not already done so, launch the NAAP
Planetary Orbit Simulator
.
·
Tip:
You can change the value of a slider by clicking on the slider bar or by entering a number in the value box.
Open the Kepler’s 1st Law tab if it is not already (it’s open by default).
· Enable all 5 check boxes.
· The white dot is the “simulated planet”. One can click on it and drag it around.
· Change the size of the orbit with the semimajor axis slider. Note how the background grid indicates change in scale while the displayed orbit size remains the same.
· Change the eccentricity and note how it affects the shape of the orbit.
Be aware that the ranges of several parameters are limited by practical issues that occur when creating a simulator rather than any true physical limitations. We have limited the semi-major axis to 50 AU since that covers most of the objects in which we are interested in our solar system and have limited eccentricity to 0.7 since the ellipses would be hard to fit on the screen for larger values. Note that the semi-major axis is aligned horizontally for all elliptical orbits created in this simulator, where they are randomly aligned in our solar system.
· Animate the simulated planet. You may need to increase the animation rate for very large orbits or decrease it for small ones.
· The planetary presets set the simulated planet’s parameters to those like our solar system’s planets. Explore these options.
Question 6: For what eccentricity is the secondary focus (which is usually empty) located at the sun? What is the shape of this orbit?
Question 7: Create an orbit with a = 20 AU and e = 0. Drag the planet first to the far left of the ellip.
Materials RequiredComputer and internet accessDrawing mate.docxjessiehampson
Materials Required
Computer and internet access
Drawing materials
Metric ruler
Calculator
Download and print out the attached file documents; 1)
Sunspot Tracking Images
, and the 2)
Structure of the Sun Diagram
. (attached below)
Digital camera or scanner
Time Required:
approximately 2-3 hours
Part I. Structure of the Sun
We'll start by looking at the solar interior more closely. Study the materials you'll find at the
Solar Interior
If you enlarge the image (by clicking on it), it shows you the various layers of the Sun. You can use this image along with your textbook to draw and label your diagram with both the inner and outer layers of the Sun.
Hand draw a diagram of the Sun on the Structure of the Sun Diagram, and label each of the layers (which should include: core, radiation zone, convection zone, photosphere, chromosphere, corona). Take an image of this to insert it into your lab report.
Now use the website to read about what is occurring in each layer, and how we know this information.
In your lab report below your inserted drawing, type a brief (1 or 2 sentences) description in your own words of what’s happening in each layer. Be sure to include all of the layers included in the interior and atmosphere of the Sun.
Part 2. Using Sunspots to Measure Solar Rotation
In 1611 Galileo first looked at the Sun with his telescope and was surprised to view several dark blemishes on its surface which came to be known as “Sunspots." Upon additional observations Galileo was able to determine that these sunspots were moving across the Sun’s surface indicating that the Sun, like the Earth, was rotating on its axis. The rate that sunspots move across the Sun’s surface can be used to determine the velocity of the Sun’s rotation.
On the
Sunspot Tracking Images sheet
are solar images for six consecutive days of several sunspot groups moving across the surface of the Sun taken by a NASA solar satellite known as SOHO, Solar and Heliospheric Observatory. You will be tracking three of these groups with this part of the activity. Sunspot group 1731 (near the equatorial area to the far left of the April 25th image), Sunspot group 1728 (above and to the right of Group 1731), & Sunspot Group 1730 (below and to the right of group 1731).
Important:
In your typed lab report, clearly label all of your answers to the following questions. For any calculations below, be sure to show all of you work and not just the end answer. Make sure your worded answers are in full sentences. Any data in tables should be typed.
Identify and mark the same sunspot groups on each image (for the larger sunspot groups draw a circle around the whole group and mark a dot at the center of the circle as a reference point for your measurements). For reference, the North Pole of the Sun is the top of each image with the South Pole at the bottom. East is to the left of each image and West is to the right of each image.
Which direction do the sunspots move .
Transcript PHY 21041 Lab 8 Hi again! Well back in Lab 4, y.docxturveycharlyn
Transcript: PHY 21041 Lab 8
Hi again! Well back in Lab 4, you measured the speed of sound in two different ways.
That’s quite an accomplishment because sound travels as fast as a bullet or a jet plane.
In this lab, your mission‐ should you decide to accept it‐ is to measure the speed of light!
Light‐ about a million times faster than sound. And it may sound crazy, but one way to
do that‐to measure the speed of light‐ is to use a microwave safe plate, and uh,
marshmallows, or chocolate chips, or a candy car. This one fell over. I’ll just eat.
Okay, not the speed of light, exactly, but of microwaves, a cousin of light. Use an
ordinary microwave oven, take out the tray inside and the roller mechanism, so it won’t
rotate, put the plate of marshmallows or chocolate inside, set it for about thirty seconds
or so and let it run. What you’ll see when you take the plate out, is little melted spots in
the marshmallows or chocolate. They correspond to the locations of the antinode of
the standing wave inside the oven. You want to measure the distance in centimeters
between those hot spots as accurately as you can, then follow the directions in Learn.
And believe it or not, you’ll be able to calculate the speed of microwaves, and the speed
of light! You’ll also see from this of course, why it is that microwave ovens have those
turntables to move the food through those antinode hot spots to heat it more evenly.
We have a more high‐tech way to measure the speed of light directly, as well, with this
equipment. On the left we have a precision, high speed oscilloscope. In the center; a
speed of light module kit; on the right side, a spool of 20 meters of fiber optic cable‐ it
looks like wire, but it’s actually plastic fiber. Here we have a little light emitting diode
that gives off very brief, very rapid pulses of light. If you looked inside the hole, here,
you’d see a steady red light because it happens too fast for us to see.
The light travels out of here, around and around and around this fiber optic cable‐ 20
meters of cable, a little more than 60 feet of cable, comes back in here, where if you
see, by a photo transistor. All this circuitry just runs these two devices here. These
wires bring the signals over to the oscilloscope.
On the oscilloscope, the top track shows the pulse as being sent out, and the bottom
track or graph shows the pulse being received. There will be a picture of this in the
instructions on Learn, and from that you’ll be able to measure the time delay between
here and here. That’s the time it took for light to travel 20 meters. It’s amazing we can
measure something as fast as light going in such a short distance as 20 meters, just
amazing!
macaulay.cuny.edu
Kent State University
Act IIILab 8 Lab 8
Measuring the speed of light
The idea: Part 1 of this lab is short and sweet – literally! Part 2 is not bad either.
There is something special about the speed of ligh ...
Materials RequiredComputer and internet accessCalculator.docxwkyra78
Materials Required:
Computer and internet access
Calculator
Pen/pencil
Digital camera or scanner
Download and print the
Hubble Diagram Sheet
(as an additional option, you can create your graph with the Excel program or create your own graph by hand)
Total Time Required:
Approximately 2-3 Hours
Part 1. The Doppler Effect
Note:
For your lab report, only include your clearly labeled answers to the below questions in all parts. Copy/paste in your photos or diagrams when needed.
Among the great achievements of Einstein was his understanding of the speed of light. The speed of light, in a vacuum, is a constant at ~ 300,000 kilometers/second (the actual velocity is 299,792.458 km/s). The speed of light is essential to the viability of both Einstein’s theories of Special and General Relativity (since the speed of light is a constant it has been given its own mathematical symbol, c). If the speed of light is not constant than neither of Einstein’s theories are credible and would not be accurate in describing physics at the larger-scales of the Universe and objects moving at high velocities close to the speed of light.
Therefore, since the speed of light is a constant any motion by an object emitting light has no effect on the lights velocity nor does an object seeing light from a source moving towards it measure any change in the speed of the light coming towards it. For example, a car is driving at night with its headlights on at a speed of 75 miles per hour. What is the speed of the light coming from the headlights? Common sense would give its speed as the speed of light plus 75 miles per hour (c + 75) but the measured speed is still the speed of light ( c ). Something had to change in this situation however and in in this part of the lab you will be investigating the change that is occurring here which is known as the Doppler Effect.
Use this link to the
Doppler Shift Demonstrator Animation.
Click on the ‘Help’ button for instructions on how to run the animation. (Below is a screenshot of the Doppler Shift Demonstrator).
Click and move the emitting source towards the middle, left side of the screen and click and move the observer to the opposite side. You can control the frequency of the emitted wave with the rate slider bar and can move either the source or object by left-clicking, holding, and dragging the object towards the direction you want it to move. Answer the following questions based on the simulations being viewed.
With the emitting source and the observer on the opposite side of the screen press the ‘start emission’ button. Record your observations of the wave and its wavelength as seen by
both
the emitting source and the observer (be as detailed as possible).
Now click, hold, and drag the observer so it is moving to the left, towards the emitting source. Record your observations of the wave and its wavelength as seen by
both
the emitting source and the observer (try to make the motion as uniform as poss.
A power point for a high school astronomy class which includes some basic information about stars in general including some links to other information.
Exercise 1Using the data above in Table 1, make a plot of right .docxrhetttrevannion
Exercise 1
Using the data above in Table 1, make a plot of right ascension versus declination on your printed out Milky Way Globular Clusters Distribution Graph (Diagram 1-the top plot). RA is along the x-axis and goes from 0 to 24 hours, Dec is on the y-axis and goes from +90 to 0 to –90 degrees.) Insert the plot into your lab report with your signature and date.
You will type your answers to the below questions in your lab report and then scan/photo your graph(s) and insert them into your lab document. Again, it would be helpful to review the Exploration from Module 1: “Math Primer for Astronomy” (note this contains link for a free online scientific calculator). There are also good math examples in the Appendix of our eText.
Would you describe the distribution of clusters on the plot as random, or is there a pattern (explain your answer)?
Now look at your plot and point in the direction in which you see most of the globular clusters. This is the general direction of the Galactic Center. Estimate the center of the distribution of the globular clusters. Also estimate (no calculation required — just an educated estimate) the accuracy of determining this center. You have now determined the rough center of our Galaxy!
RA = ____________________ ± ________________
Dec = ____________________ ± ________________
Shapely was correct in thinking that the distribution of globular clusters could reveal something about the Galaxy as a whole. He went one step further. He used the locations of the globular clusters to determine the distance to the Galactic Center. His result was surprisingly accurate and differed from the modern value by less than 10%. So, let’s follow in his footsteps.
The next step is to determine the distance to the clusters. Shapely did this by using RR Lyrae stars. These are variable stars, which have a relatively narrow range of luminosities. From the difference between the apparent magnitudes (measured from his photographic plates) and the absolute magnitudes (calculated from the luminosities), he calculated the distances in parsecs to the star (via: m - M = 5log10(d) + 5). So now we have the distances and the directions of the globular clusters and we can determine the 3-dimensional distributions of the globular clusters relative to us.
However, we will use a different coordinate system that is based on galactic latitude and longitude rather than RA and Dec. The plane of the Galaxy is designated as “0 latitude”. Why would we want to do this? RA and Dec is a messy coordinate system that depends on our orientation in space and the earth’s rotation around its axis. The system based on galactic latitude and longitude is therefore simpler. However, it means that we have to transform the measured RA and DEC positions of the globular clusters and galactic latitude and longitude. To simplify things even further, let’s express the galactic latitude and longitude in terms of x, y, and z coordinates. The advantage of this is that x,.
6) A beam of light with red and blue components of wavelengths.docxalinainglis
6) A beam of light with red and blue components of wavelengths 670 nm and 425 nm,
respectively, strikes a slab of fused quartz at an incident angle of 30o. On refraction, the
different components are separated by an angle of 0.001312 rad. If the index of
refractions of the red light is 1.4925, what is the index of refraction of the blue light?
Week 5 Assignment
Early Quantum Theory
Please solve the following problems. You must show all work for full/partial credit.
When complete, attach a typed cover sheet and submit to the assignment drop-box.
1) The walls of a blackbody cavity are at a temperature of 27o C. What is the frequency
of the radiation of maximum intensity?
2) Assume that a 100 – W light bulb gives off 2.50% of its energy as visible light. How
many photons of visible light are given off in 1.00 min? (Use an average visible
wavelength of 550 nm)
3) What is the energy of photons (joules) emitted by an 107.5-MHz FM radio station?
4) What is the longest wavelength of light that will emit electrons from a metal whose
work function is 3.50 eV?
5) A metal with a work function of 2.40 eV is illuminated by a beam of monochromatic
light. If the stopping potential is 2.5V, what is the wavelength of the light?
6) What is the de Broglie wavelength of a 1000 kg car moving at a velocity of 25 m/s?
7) A hydrogen atom in its ground state is excited to the n = 5 level. It then makes a
transition directly to the n = 2 level before returning to the ground state.
a) What are the wavelengths of the emitted photons?
b) Would any of the emitted wavelengths be in the visible region?
8) What is the longest wavelength light capable of ionizing a hydrogen atom in the
ground state?
Week 6 Assignment
Quantum Mechanics of Atoms
Please solve the following problems. You must show all work for full/partial credit.
When complete, attach a typed cover sheet and submit to the assignment drop-box.
1) What is the minimum uncertainty in the velocity of an electron that is known to be
somewhere between 0.050 nm and 0.10 nm from a proton?
2) The energy of the first excited state of a hydrogen atom is -0.34 eV ± 0.0003 eV.
What is the average lifetime of for this state?
3) Knowing that a free neutron has a mean life of 900 s and a mass of m = 1.67 x 10-
27kg, what is the uncertainty in its mass in kg?
4) For n = 5, l = 4, what are the possible values of and ml and ms?
5) Draw the ground state energy level diagrams for nitrogen (N) and potassium (K).
6) Calculate the magnitude of the angular momentum of an electron in the n = 7, l= 5
state of hydrogen.
Week 7 Assignment
Nuclear Physics
Please solve the following problems. You must show all work for full/partial credit.
When complete, attach a typed cover sheet and submit to the assignment drop-box.
1) What is the approximate atomic radius of
2) What is the approximate radius of a nucleus?
(b) Approximately what is the value.
LIT 2001 FINAL EXAMPlease respond with a complete, thoughtful an.docxSHIVA101531
LIT 2001 FINAL EXAM
Please respond with a complete, thoughtful answer. Be sure to provide detail by referring to specific examples. DO NOT USE OUTSIDE RESEARCH SOURCES.
PART ONE: Answer ONE of the following questions:
1. Describe Langston Hughes’ view of America by tracing at least three of his poems. Also, describe the controversy around the manner in which Hughes portrayed African Americans in his poems.
2. William Carlos Williams uses an “open” style and format and Robert Frost uses a more “constructed”? What are the characteristics of each style – i.e., rhyme, etc. Use examples from their poems.
PART TWO: POEM ANALYSIS
DO NOT USE OUTSIDE RESEARCH SOURCES.
Critically analyze this poem by discussing three major components of analysis: Please read all 7 stanzas of the poem.
1. What are some of the structural elements of the poem? Metaphor, rhyme, symbols, sounds, etc.
2. What does the poem mean? Explain the content of the poem.
3. What is the theme of the poem?
To An Athlete Dying Young by A.E.Housman
The time you won our town the race
We chaired you through the market place;
Man and boy stood cheering by,
And home we brought you shoulder-high.
Today, the road all runners come,
Shoulder-high we bring you home,
And set you at your threshold down,
Townsman of a stiller town.
Smart lad, to slip betimes away
From fields where glory does not stay,
And early though the laurel grows
It withers quicker than the rose.
Eyes the shady night has shut
Cannot see the record cut,
And silence sounds no worse than cheers
After earth has stopped the ears:
Now you will not swell the rout
Of lads that wore their honors out,
Runners whom renown outran
And the name died before the man.
So set, before its echoes fade,
The fleet foot on the sill of shade,
And hold to the low lintel up
The still-defended challenge cup.
And round that early-laureled head
Will flock to gaze the strengthless dead
And find unwithered on its curls
The garland briefer than a girl’s.
Hubble's Law and the Expansion Rate of the Universe
This lab is based on the University of Washington’s “Hubble’s Law and the Expansion of
the Universe” lab. The website where the images and spectra are located is maintained
by the University of Washington Astronomy Department.
Learning Objectives
Using analyses of images and spectra of selected galaxies, you will
1. measure angular sizes of galaxies and find their distances,
2. measure the redshifts of galaxy spectral lines and find the recessional velocities
of the galaxies,
3. create a Hubble Plot to determine a value for Hubble's constant,
4. estimate the age of the Universe from this constant and compare that to the age
of the Sun and the Milky Way,
5. and summarize how our view of the Universe has changed as the value of the
Hubble constant has improved.
Background and Theory
In the 1920's, Edwin P. Hubble discovered a relationship, now known as Hubble' ...
This paper shows my findings for determining the grating constant of a diffraction grating, the wavelengths of each line of the spectrum of hydrogen, and experimentally calculating the Rydberg constant.
Intro to astrophysics nis grade 11 by mr marty, visible brightness = apparent...Michael Marty
History of magnitude scales; brightness, luminosity, and Power of a star; Stefan-Boltzmann Law; Stellar Parallax; and Wien's Displacement Law of blackbody radiation.
12 pages12 New Times Roman fontdue July 18 include turnitin re.docxChereCoble417
12 pages
12 New Times Roman font
due July 18
include turnitin report
Social Impacts of Cyber Crime
Cyber criminals take advantage of the fast paced advancement of technology and the individuals who are unsophisticated and have no idea where the Internet fits into their world.
Thieves have become very skilled in using the anonymity of the Internet to trick victims into giving them what they want.
“The scammer tries to prey on victims who are kind of in tune with what’s going on in the world. The scam changes, but ultimately they’re preying on the good will of people” (Donnelly, 2011).
No matter what aspect of cyber crime that happens to an individual, or if restitution was made, the effects of cyber crime can be devastating.
Cyber crime: concepts methodologies, tools, and applications
Types of Cyber Crime
Cyber –Tresspass ( Viruses, Denial of Service attacks)
Cyber –deceptions (identity theft, fraud, piracy)
Cyber-pornography
Cyber-violence (cyberbullying, cyber stalking)
Scope of Cyber Crime
International Cyber crime(transnational)
The challenges and the future of Cyber crime
Conclusion
.
100 wordsThe Internet provides a vast variety of information, .docxChereCoble417
100 words
The Internet provides a vast variety of information, but not all information is accurate, reliable, or safe to access.
discuss the dangers of using the Internet for information and discuss various options for making sure that the information you find is accurate.
.
More Related Content
Similar to Brightness at Varying Distances LabImage by Borb CC license
Materials RequiredComputer and internet accessDrawing mate.docxjessiehampson
Materials Required
Computer and internet access
Drawing materials
Metric ruler
Calculator
Download and print out the attached file documents; 1)
Sunspot Tracking Images
, and the 2)
Structure of the Sun Diagram
. (attached below)
Digital camera or scanner
Time Required:
approximately 2-3 hours
Part I. Structure of the Sun
We'll start by looking at the solar interior more closely. Study the materials you'll find at the
Solar Interior
If you enlarge the image (by clicking on it), it shows you the various layers of the Sun. You can use this image along with your textbook to draw and label your diagram with both the inner and outer layers of the Sun.
Hand draw a diagram of the Sun on the Structure of the Sun Diagram, and label each of the layers (which should include: core, radiation zone, convection zone, photosphere, chromosphere, corona). Take an image of this to insert it into your lab report.
Now use the website to read about what is occurring in each layer, and how we know this information.
In your lab report below your inserted drawing, type a brief (1 or 2 sentences) description in your own words of what’s happening in each layer. Be sure to include all of the layers included in the interior and atmosphere of the Sun.
Part 2. Using Sunspots to Measure Solar Rotation
In 1611 Galileo first looked at the Sun with his telescope and was surprised to view several dark blemishes on its surface which came to be known as “Sunspots." Upon additional observations Galileo was able to determine that these sunspots were moving across the Sun’s surface indicating that the Sun, like the Earth, was rotating on its axis. The rate that sunspots move across the Sun’s surface can be used to determine the velocity of the Sun’s rotation.
On the
Sunspot Tracking Images sheet
are solar images for six consecutive days of several sunspot groups moving across the surface of the Sun taken by a NASA solar satellite known as SOHO, Solar and Heliospheric Observatory. You will be tracking three of these groups with this part of the activity. Sunspot group 1731 (near the equatorial area to the far left of the April 25th image), Sunspot group 1728 (above and to the right of Group 1731), & Sunspot Group 1730 (below and to the right of group 1731).
Important:
In your typed lab report, clearly label all of your answers to the following questions. For any calculations below, be sure to show all of you work and not just the end answer. Make sure your worded answers are in full sentences. Any data in tables should be typed.
Identify and mark the same sunspot groups on each image (for the larger sunspot groups draw a circle around the whole group and mark a dot at the center of the circle as a reference point for your measurements). For reference, the North Pole of the Sun is the top of each image with the South Pole at the bottom. East is to the left of each image and West is to the right of each image.
Which direction do the sunspots move .
Transcript PHY 21041 Lab 8 Hi again! Well back in Lab 4, y.docxturveycharlyn
Transcript: PHY 21041 Lab 8
Hi again! Well back in Lab 4, you measured the speed of sound in two different ways.
That’s quite an accomplishment because sound travels as fast as a bullet or a jet plane.
In this lab, your mission‐ should you decide to accept it‐ is to measure the speed of light!
Light‐ about a million times faster than sound. And it may sound crazy, but one way to
do that‐to measure the speed of light‐ is to use a microwave safe plate, and uh,
marshmallows, or chocolate chips, or a candy car. This one fell over. I’ll just eat.
Okay, not the speed of light, exactly, but of microwaves, a cousin of light. Use an
ordinary microwave oven, take out the tray inside and the roller mechanism, so it won’t
rotate, put the plate of marshmallows or chocolate inside, set it for about thirty seconds
or so and let it run. What you’ll see when you take the plate out, is little melted spots in
the marshmallows or chocolate. They correspond to the locations of the antinode of
the standing wave inside the oven. You want to measure the distance in centimeters
between those hot spots as accurately as you can, then follow the directions in Learn.
And believe it or not, you’ll be able to calculate the speed of microwaves, and the speed
of light! You’ll also see from this of course, why it is that microwave ovens have those
turntables to move the food through those antinode hot spots to heat it more evenly.
We have a more high‐tech way to measure the speed of light directly, as well, with this
equipment. On the left we have a precision, high speed oscilloscope. In the center; a
speed of light module kit; on the right side, a spool of 20 meters of fiber optic cable‐ it
looks like wire, but it’s actually plastic fiber. Here we have a little light emitting diode
that gives off very brief, very rapid pulses of light. If you looked inside the hole, here,
you’d see a steady red light because it happens too fast for us to see.
The light travels out of here, around and around and around this fiber optic cable‐ 20
meters of cable, a little more than 60 feet of cable, comes back in here, where if you
see, by a photo transistor. All this circuitry just runs these two devices here. These
wires bring the signals over to the oscilloscope.
On the oscilloscope, the top track shows the pulse as being sent out, and the bottom
track or graph shows the pulse being received. There will be a picture of this in the
instructions on Learn, and from that you’ll be able to measure the time delay between
here and here. That’s the time it took for light to travel 20 meters. It’s amazing we can
measure something as fast as light going in such a short distance as 20 meters, just
amazing!
macaulay.cuny.edu
Kent State University
Act IIILab 8 Lab 8
Measuring the speed of light
The idea: Part 1 of this lab is short and sweet – literally! Part 2 is not bad either.
There is something special about the speed of ligh ...
Materials RequiredComputer and internet accessCalculator.docxwkyra78
Materials Required:
Computer and internet access
Calculator
Pen/pencil
Digital camera or scanner
Download and print the
Hubble Diagram Sheet
(as an additional option, you can create your graph with the Excel program or create your own graph by hand)
Total Time Required:
Approximately 2-3 Hours
Part 1. The Doppler Effect
Note:
For your lab report, only include your clearly labeled answers to the below questions in all parts. Copy/paste in your photos or diagrams when needed.
Among the great achievements of Einstein was his understanding of the speed of light. The speed of light, in a vacuum, is a constant at ~ 300,000 kilometers/second (the actual velocity is 299,792.458 km/s). The speed of light is essential to the viability of both Einstein’s theories of Special and General Relativity (since the speed of light is a constant it has been given its own mathematical symbol, c). If the speed of light is not constant than neither of Einstein’s theories are credible and would not be accurate in describing physics at the larger-scales of the Universe and objects moving at high velocities close to the speed of light.
Therefore, since the speed of light is a constant any motion by an object emitting light has no effect on the lights velocity nor does an object seeing light from a source moving towards it measure any change in the speed of the light coming towards it. For example, a car is driving at night with its headlights on at a speed of 75 miles per hour. What is the speed of the light coming from the headlights? Common sense would give its speed as the speed of light plus 75 miles per hour (c + 75) but the measured speed is still the speed of light ( c ). Something had to change in this situation however and in in this part of the lab you will be investigating the change that is occurring here which is known as the Doppler Effect.
Use this link to the
Doppler Shift Demonstrator Animation.
Click on the ‘Help’ button for instructions on how to run the animation. (Below is a screenshot of the Doppler Shift Demonstrator).
Click and move the emitting source towards the middle, left side of the screen and click and move the observer to the opposite side. You can control the frequency of the emitted wave with the rate slider bar and can move either the source or object by left-clicking, holding, and dragging the object towards the direction you want it to move. Answer the following questions based on the simulations being viewed.
With the emitting source and the observer on the opposite side of the screen press the ‘start emission’ button. Record your observations of the wave and its wavelength as seen by
both
the emitting source and the observer (be as detailed as possible).
Now click, hold, and drag the observer so it is moving to the left, towards the emitting source. Record your observations of the wave and its wavelength as seen by
both
the emitting source and the observer (try to make the motion as uniform as poss.
A power point for a high school astronomy class which includes some basic information about stars in general including some links to other information.
Exercise 1Using the data above in Table 1, make a plot of right .docxrhetttrevannion
Exercise 1
Using the data above in Table 1, make a plot of right ascension versus declination on your printed out Milky Way Globular Clusters Distribution Graph (Diagram 1-the top plot). RA is along the x-axis and goes from 0 to 24 hours, Dec is on the y-axis and goes from +90 to 0 to –90 degrees.) Insert the plot into your lab report with your signature and date.
You will type your answers to the below questions in your lab report and then scan/photo your graph(s) and insert them into your lab document. Again, it would be helpful to review the Exploration from Module 1: “Math Primer for Astronomy” (note this contains link for a free online scientific calculator). There are also good math examples in the Appendix of our eText.
Would you describe the distribution of clusters on the plot as random, or is there a pattern (explain your answer)?
Now look at your plot and point in the direction in which you see most of the globular clusters. This is the general direction of the Galactic Center. Estimate the center of the distribution of the globular clusters. Also estimate (no calculation required — just an educated estimate) the accuracy of determining this center. You have now determined the rough center of our Galaxy!
RA = ____________________ ± ________________
Dec = ____________________ ± ________________
Shapely was correct in thinking that the distribution of globular clusters could reveal something about the Galaxy as a whole. He went one step further. He used the locations of the globular clusters to determine the distance to the Galactic Center. His result was surprisingly accurate and differed from the modern value by less than 10%. So, let’s follow in his footsteps.
The next step is to determine the distance to the clusters. Shapely did this by using RR Lyrae stars. These are variable stars, which have a relatively narrow range of luminosities. From the difference between the apparent magnitudes (measured from his photographic plates) and the absolute magnitudes (calculated from the luminosities), he calculated the distances in parsecs to the star (via: m - M = 5log10(d) + 5). So now we have the distances and the directions of the globular clusters and we can determine the 3-dimensional distributions of the globular clusters relative to us.
However, we will use a different coordinate system that is based on galactic latitude and longitude rather than RA and Dec. The plane of the Galaxy is designated as “0 latitude”. Why would we want to do this? RA and Dec is a messy coordinate system that depends on our orientation in space and the earth’s rotation around its axis. The system based on galactic latitude and longitude is therefore simpler. However, it means that we have to transform the measured RA and DEC positions of the globular clusters and galactic latitude and longitude. To simplify things even further, let’s express the galactic latitude and longitude in terms of x, y, and z coordinates. The advantage of this is that x,.
6) A beam of light with red and blue components of wavelengths.docxalinainglis
6) A beam of light with red and blue components of wavelengths 670 nm and 425 nm,
respectively, strikes a slab of fused quartz at an incident angle of 30o. On refraction, the
different components are separated by an angle of 0.001312 rad. If the index of
refractions of the red light is 1.4925, what is the index of refraction of the blue light?
Week 5 Assignment
Early Quantum Theory
Please solve the following problems. You must show all work for full/partial credit.
When complete, attach a typed cover sheet and submit to the assignment drop-box.
1) The walls of a blackbody cavity are at a temperature of 27o C. What is the frequency
of the radiation of maximum intensity?
2) Assume that a 100 – W light bulb gives off 2.50% of its energy as visible light. How
many photons of visible light are given off in 1.00 min? (Use an average visible
wavelength of 550 nm)
3) What is the energy of photons (joules) emitted by an 107.5-MHz FM radio station?
4) What is the longest wavelength of light that will emit electrons from a metal whose
work function is 3.50 eV?
5) A metal with a work function of 2.40 eV is illuminated by a beam of monochromatic
light. If the stopping potential is 2.5V, what is the wavelength of the light?
6) What is the de Broglie wavelength of a 1000 kg car moving at a velocity of 25 m/s?
7) A hydrogen atom in its ground state is excited to the n = 5 level. It then makes a
transition directly to the n = 2 level before returning to the ground state.
a) What are the wavelengths of the emitted photons?
b) Would any of the emitted wavelengths be in the visible region?
8) What is the longest wavelength light capable of ionizing a hydrogen atom in the
ground state?
Week 6 Assignment
Quantum Mechanics of Atoms
Please solve the following problems. You must show all work for full/partial credit.
When complete, attach a typed cover sheet and submit to the assignment drop-box.
1) What is the minimum uncertainty in the velocity of an electron that is known to be
somewhere between 0.050 nm and 0.10 nm from a proton?
2) The energy of the first excited state of a hydrogen atom is -0.34 eV ± 0.0003 eV.
What is the average lifetime of for this state?
3) Knowing that a free neutron has a mean life of 900 s and a mass of m = 1.67 x 10-
27kg, what is the uncertainty in its mass in kg?
4) For n = 5, l = 4, what are the possible values of and ml and ms?
5) Draw the ground state energy level diagrams for nitrogen (N) and potassium (K).
6) Calculate the magnitude of the angular momentum of an electron in the n = 7, l= 5
state of hydrogen.
Week 7 Assignment
Nuclear Physics
Please solve the following problems. You must show all work for full/partial credit.
When complete, attach a typed cover sheet and submit to the assignment drop-box.
1) What is the approximate atomic radius of
2) What is the approximate radius of a nucleus?
(b) Approximately what is the value.
LIT 2001 FINAL EXAMPlease respond with a complete, thoughtful an.docxSHIVA101531
LIT 2001 FINAL EXAM
Please respond with a complete, thoughtful answer. Be sure to provide detail by referring to specific examples. DO NOT USE OUTSIDE RESEARCH SOURCES.
PART ONE: Answer ONE of the following questions:
1. Describe Langston Hughes’ view of America by tracing at least three of his poems. Also, describe the controversy around the manner in which Hughes portrayed African Americans in his poems.
2. William Carlos Williams uses an “open” style and format and Robert Frost uses a more “constructed”? What are the characteristics of each style – i.e., rhyme, etc. Use examples from their poems.
PART TWO: POEM ANALYSIS
DO NOT USE OUTSIDE RESEARCH SOURCES.
Critically analyze this poem by discussing three major components of analysis: Please read all 7 stanzas of the poem.
1. What are some of the structural elements of the poem? Metaphor, rhyme, symbols, sounds, etc.
2. What does the poem mean? Explain the content of the poem.
3. What is the theme of the poem?
To An Athlete Dying Young by A.E.Housman
The time you won our town the race
We chaired you through the market place;
Man and boy stood cheering by,
And home we brought you shoulder-high.
Today, the road all runners come,
Shoulder-high we bring you home,
And set you at your threshold down,
Townsman of a stiller town.
Smart lad, to slip betimes away
From fields where glory does not stay,
And early though the laurel grows
It withers quicker than the rose.
Eyes the shady night has shut
Cannot see the record cut,
And silence sounds no worse than cheers
After earth has stopped the ears:
Now you will not swell the rout
Of lads that wore their honors out,
Runners whom renown outran
And the name died before the man.
So set, before its echoes fade,
The fleet foot on the sill of shade,
And hold to the low lintel up
The still-defended challenge cup.
And round that early-laureled head
Will flock to gaze the strengthless dead
And find unwithered on its curls
The garland briefer than a girl’s.
Hubble's Law and the Expansion Rate of the Universe
This lab is based on the University of Washington’s “Hubble’s Law and the Expansion of
the Universe” lab. The website where the images and spectra are located is maintained
by the University of Washington Astronomy Department.
Learning Objectives
Using analyses of images and spectra of selected galaxies, you will
1. measure angular sizes of galaxies and find their distances,
2. measure the redshifts of galaxy spectral lines and find the recessional velocities
of the galaxies,
3. create a Hubble Plot to determine a value for Hubble's constant,
4. estimate the age of the Universe from this constant and compare that to the age
of the Sun and the Milky Way,
5. and summarize how our view of the Universe has changed as the value of the
Hubble constant has improved.
Background and Theory
In the 1920's, Edwin P. Hubble discovered a relationship, now known as Hubble' ...
This paper shows my findings for determining the grating constant of a diffraction grating, the wavelengths of each line of the spectrum of hydrogen, and experimentally calculating the Rydberg constant.
Intro to astrophysics nis grade 11 by mr marty, visible brightness = apparent...Michael Marty
History of magnitude scales; brightness, luminosity, and Power of a star; Stefan-Boltzmann Law; Stellar Parallax; and Wien's Displacement Law of blackbody radiation.
12 pages12 New Times Roman fontdue July 18 include turnitin re.docxChereCoble417
12 pages
12 New Times Roman font
due July 18
include turnitin report
Social Impacts of Cyber Crime
Cyber criminals take advantage of the fast paced advancement of technology and the individuals who are unsophisticated and have no idea where the Internet fits into their world.
Thieves have become very skilled in using the anonymity of the Internet to trick victims into giving them what they want.
“The scammer tries to prey on victims who are kind of in tune with what’s going on in the world. The scam changes, but ultimately they’re preying on the good will of people” (Donnelly, 2011).
No matter what aspect of cyber crime that happens to an individual, or if restitution was made, the effects of cyber crime can be devastating.
Cyber crime: concepts methodologies, tools, and applications
Types of Cyber Crime
Cyber –Tresspass ( Viruses, Denial of Service attacks)
Cyber –deceptions (identity theft, fraud, piracy)
Cyber-pornography
Cyber-violence (cyberbullying, cyber stalking)
Scope of Cyber Crime
International Cyber crime(transnational)
The challenges and the future of Cyber crime
Conclusion
.
100 wordsThe Internet provides a vast variety of information, .docxChereCoble417
100 words
The Internet provides a vast variety of information, but not all information is accurate, reliable, or safe to access.
discuss the dangers of using the Internet for information and discuss various options for making sure that the information you find is accurate.
.
100 words for itYou have heard the expression Nine Eleven in r.docxChereCoble417
100 words for it
You have heard the expression "Nine Eleven" in relationship to an historical event. How does that awareness affect your understanding of the play titled "Nine Ten"? Discuss in relation to each of the characters in the play, and what they are trying to do. Have you ever been called for jury selection? What did you notice about the others also there for the same reason?
.
100 words -- a reference in each paragraph--APA formatEthics an.docxChereCoble417
100 words -- a reference in each paragraph--APA format
"Ethics and Security" Please respond to the following:
Organizational end users are generally in the background when it comes to protecting the IT infrastructure. As the chief security officer (CSO), develop a security awareness training communication plan for these users. Your plan must be in nontechnical terms to the user population that incorporates the confidentiality, integrity, and availability of the organization’s information assets.
.
100 to 200 words1. Identify one (1) evidentiary issue that could b.docxChereCoble417
100 to 200 words
1. Identify one (1) evidentiary issue that could be presented regarding the admission of digital evidence at trial. Next, suggest one (1) way in which the court could take to resolve the issue that you have identified. Include one (1) example of such issue and your suggestion action to support your response.
Per the text, there is probable cause to search a computer or electronic media when one believes that the computer or related media either contains or is contraband evidence of a crime, fruits of crime, or instrumentality of a crime. Identify at least two (2) types of warrantless searches that investigators can conduct while collecting digital evidence, and explain the main reasons why you believe the types of searches in question are warrantless. Justify your response.
PLEASE KEEP COMPLETELY SEPARATE FROM 1 AND THIS IS A RESPONSE TO THE POST BELOW 50 to 75 words
2.
One evidentiary issue that could be presented regarding the admission of digital evidence at trial is if the evidence is clear and convincing. For example, When looking channel 7; when someone is maybe breaking into someone's house or breaking into a store. I have seen video feed thats just a shadow, or maybe the person has on something that hides their face. They willstill ask if you reconize that person. Unfortunately, it's hard to figure out who the suspect is because the image maybe bad or they may becovered. There is no way to solve this issue unless they have some kind of tattoo or scar that could be pointed out.
Two types of warrentless searches are: Plain-view search and Exigent circumstances. Plain-view search, a warrent isn't required for this because; if your investigating someone and you see criminal activity on their computersc, no matter what it is; you can use that informaton because as long it can be seen by the general public. Exigent circumstances, a warrent isn't required for this because; it may an immediate emergency. For example, a murder, kidnap, robbery or anyother type of crime.
.
100 essayPromptTopic One of the areas learned in Module 1 wa.docxChereCoble417
100 essay
Prompt/Topic
: One of the areas learned in Module 1 was how to customize the Word toolbar. Why is it important to customize your toolbar? What changes did you make to the toolbar?
(Mdodule 1 )Getting Started with Windows 8 and Creating Documents with Word 2013
Microsoft
®
Office 2013 is a group of software programs designed to help you create documents, collaborate with co-workers, and track and analyze information. You use different Office programs to accomplish specific tasks, such as writing a letter or producing a sales presentation, yet all the programs have a similar look and feel.
The programs in Office are bundled together in a group called a suite. Microsoft
®
Office Word 2013 is used to create any kind of text-based document. Themes are predesigned combinations of color and formatting attributes you can apply and are available in most Office programs. Microsoft
®
Office Excel
®
2013 is used to work with numeric values and make calculations. Microsoft
®
Office PowerPoint
®
2013 is used to create presentations, complete with graphics, transitions, and even a soundtrack. Microsoft
®
Office Access 2013 helps keep track of large amounts of quantitative data.
Because the Office suite programs have a similar interface (look and feel), it is easy to learn the program tools. Office documents are compatible (easy to incorporate or integrate) with one another.
The first step in using an Office program is to open or launch it on the computer. The easiest way to launch a program is to click the Start button on the Windows taskbar or double-click an icon on the desktop. A user interface is a collective term for all the ways you interact with a software program. A file is a stored collection of data. Saving a file enables you to work on a project now and then put it away and work on it again later. Printing can be a simple or complex task. It helps to preview a document to see exactly what a document will look like when it is printed. Each Microsoft
®
Office program allows you to switch among various views of the document windows. A screen capture is a snapshot of your screen.
Microsoft
®
Office Word 2013 is a word processing program that makes it easy to create a variety of professional-looking documents. A word processing program is a software program that includes tools for entering, editing, and formatting text and graphics. The electronic files you create using Word are called documents.
Word Wrap
Those students who learned to type on a typewriter are used to pressing the Return key each time the typewriter carriage approaches the right margin of your paper. Normally, the typewriter bell would "ding," and you would shortly thereafter press the Return key to send the carriage to the start of the next line. Break that habit!
When using a word processing program like Microsoft
®
Word, the word wrap feature will automatically position the insertion point at the beginning of the next line whenever the inse.
11. As you can see, development is better understood by examining bo.docxChereCoble417
11. As you can see, development is better understood by examining both human welfare and economic dimensions. Answer the following question in a one page response (at least two paragraphs) and submit it via the link to Project 2 on Blackboard. (10 points)
What are the long-term ramifications for a society investing heavily in economic production at the expense of human welfare investment?
For two people, so it has to be diffrent papers?
.
100 AccurateWeek 2 Wiley Plus Quiz Study GuideACC561.docxChereCoble417
100% Accurate
Week 2 Wiley Plus Quiz Study Guide
ACC/561
September 1, 2015
Question 1
The relationship between current assets and current liabilities is important in evaluating a company's
Question 2
Which of the following is a measure of liquidity?
Question 3
Current assets divided by current liabilities is known as the
Question 4
Danner Corporation reported net sales of $600,000, $680,000, and $800,000 in the years 2011, 2012, and 2013, respectively. If 2011 is the base year, what percentage do 2013 sales represent of the base?
.
100-250 words for each response.1An international team was.docxChereCoble417
100-250 words for each response.
1
An international team was gathered to discuss how funding should be spent to eliminate human infections. There is only enough funding to eliminate one disease. How would the scientists go about choosing the next disease to be eliminated from the planet? Which one should it be?
2
Infections with hepatitis B and hepatitis C viruses usually take years, even decades, before visible signs of hepatitis manifest themselves. Epidemiological, how does it influenza our ability to track such diseases in a population and prevent transmissions?
3
How are computer viruses similar to biological viruses? Are computer viruses alive? Why or why not?
.
100-200 words, in college writing, information search via internet a.docxChereCoble417
100-200 words, in college writing, information search via internet and in APA reference.
The Omnibus Budget Reconciliation Act mandated that hospitals use CPT to report outpatient services. Why? What are the differences between ICD-10 (or ICD-9-CM) and CPT? Why was CPT even created?
.
100 ACCURACYNEEDED in 30MINS to 1HRQuestion1.Sugar al.docxChereCoble417
100% ACCURACY
NEEDED in 30MINS to 1HR
Question
1.
Sugar alcohols are likely to be found in:
a.
b.
c.
d.
2.
An example of a meal or snack that contains complementary proteins is:
a.
b.
c.
d.
3.
The second most common type of malnutrition worldwide is:
a.
b.
c.
d.
4.
A type of exercise that is considered to be aerobic for amateur athletes is:
a.
b.
c.
d.
5.
Home-canned foods should be boiled for 10 minutes before eating to help prevent:
a.
b.
c.
d.
6.
Potent environmental carcinogens include:
a.
b.
c.
d.
7.
The fetal origins hypothesis supports the idea that nutrition during gestation may affect:
a.
b.
c.
d.
8.
The kidney structure that is responsible for filtering the blood is the:
a.
b.
c.
d.
9.
Older adults have lower energy requirements than younger adults because they have:
a.
b.
c.
d.
10.
A characteristic clinical symptom of gallbladder inflammation or gallstones is:
a.
b.
c.
d.
11.
A severe tyramine reaction may cause a crisis due to:
a.
b.
c.
d.
12.
A nutrient that delays gastric emptying time, thereby creating more optimal saturation rates for drug absorption is:
a.
b.
c.
d.
13.
One effect of impaired blood circulation through the liver caused by fibrous tissue is the development of:
a.
b.
c.
d.
14.
A factor that influences the protein needs of older adults is:
a.
b.
c.
d.
15.
One way in which oral hypoglycemic drugs act to lower elevated blood glucose levels is by:
a.
b.
c.
d.
16.
It is important that energy needs in pregnancy are met so that:
a.
b.
c.
d.
17.
Cancer generally begins with disruptions in:
a.
b.
c.
d.
18.
Three key concepts included in the total diet approach to improving nutrient intake are:
a.
b.
c.
d.
19.
Foods and drugs used to enhance athletic performance are known as:
a.
b.
c.
d.
20.
A major benefit of fluoride is:
a.
b.
c.
d.
21.
Pepsinogen secreted by the gastric cells is converted into pepsin by:
a.
b.
c.
d.
22.
In the colon, resistant starch is digested by:
a.
b.
c.
d.
23.
A food choice equivalent to one serving from the Protein group of MyPlate is:
a.
b.
c.
d.
24.
Synthesis of protein is governed by:
a.
b.
c.
d.
25.
The effect of trans fatty acids on blood cholesterol is similar to that of:
a.
b.
c.
d.
26.
Physiologic functions of potassium include:
a.
b.
c.
d.
27.
Aerobic capacity is the greatest in a person with:
a.
b.
c.
d.
28.
Important functions of food additives include:
a.
b.
c.
d.
29.
Patients who undergo pancreatectomy are likely to develop:
a.
b.
c.
d.
30.
A special therapeutic diet may be modified in:
a.
b.
c.
d.
31.
Preschool children often prefer foods that are:
a.
b.
c.
d.
32.
Drugs that can depress appetite include:
a.
b.
c.
d.
33.
Subjective global assessment relies on information from:
a.
b.
c.
d.
34.
Diagnosis of celiac disease is confirmed using:
a.
b.
c.
d.
35.
Entitlement programs include:
a.
b.
c.
d.
36.
Risk of b.
10.2The cost of providing public services at a local hospital ha.docxChereCoble417
10.2
The cost of providing public services at a local hospital has been scrutinized by manage- ment. Although these services are used as marketing tools for the hospital, the cost and availability of scarce resources require their optimal allocation while minimizing costs. Two popular programs being assessed for this purpose are “Family Planning” (FP) and “Health-Drive-Screenings” (HDS); their costs to the hospital for each offering are $200 and $400, respectively. The health care manager in charge of operations found three common patterns of resource consumption for each of these services and the available resources, shown in Table EX 10.2.
.
100 AccurateWeek 4 Wiley Plus Quiz Study GuideACC561.docxChereCoble417
100% Accurate
Week 4 Wiley Plus Quiz Study Guide
ACC/561
September 1, 2015
Question 1
A variable cost is a cost that
Question 2
An increase in the level of activity will have the following effects on unit costs for variable and fixed costs:
Question 3
A fixed cost is a cost which
Question 4
Hollis Industries produces flash drives for computers, which it sells for $20 each. Each flash drive costs $14 of variable costs to make. During April, 1,000 drives were sold. Fixed costs for March were $2 per unit for a total of $1,000 for the month. How much is the contribution margin ratio?
.
10.Which standard C++ library function allows you to compare two.docxChereCoble417
10.
Which standard C++ library function allows you to compare two strings?
11.
What is the ASCII collating sequence?
12.
Which standard C++ library function allows you to paste one string onto the end of another? What must you be careful of when using this function?
13. What header file must you include to use the standard library character classification functions?
14.
Name as many of the character classification functions as you can and what they are used for.
15.
What are the character conversion functions?
16.
What are the numeric conversion functions and what does each do? Which header file must
you include to use them?
17.
What is meant by dynamic memory allocation?
18.
What is the heap? How does heap storage differ from static and automatic storage?
19.
How can you allocate memory from the heap? How can you deallocate memory from the heap?
.
10 Things to Know About the Psychology of CultsBoth terrifying a.docxChereCoble417
10 Things to Know About the Psychology of Cults
Both terrifying and utterly fascinating, cults have a tendency to capture the attention of just about everyone. Questions abound: Where do these people come from? What are they really doing inside those secluded compounds? Most interesting, perhaps, are the psychological components of cult life, questions such as: Who in the world would fall for that? In an effort to answer these questions and more, we’ve listed 10 things to know about the psychology of cults.
Cults are attractive because they promote an illusion of comfort.
Humans desire comfort, and in a fearful and uncertain world many turn to cults because they tend to promote exactly that. Jon-Patrik Pedersen, a psychologist at CalTech, has pointed out that cult leaders often make promises that are totally unattainable, but also offered by no other group in society. Such things might include financial security, total health, constant peace of mind, and eternal life — the things every human desires at the deepest level.
Cults satisfy the human desire for absolute answers.
Today’s world is a tough one, with more abstract issues than there are issues that are black and white. As Dr. Adrian Furnham describes in
Psychology Today
, humans crave clarity. Many people join cults because they believe they’re being offered solid, absolute answers for questions such as good vs. evil, religion, the meaning of life, politics, etc. Many cult leaders promote messages that are simple and seem to make sense, the exact opposite of what we’re often provided with in typical, everyday life.
Those with low self-esteem are more likely to be persuaded by a cult environment.
People are often surprised to learn that those who join cults are, for the most part, average people. They come from all backgrounds, all zip codes, and all tax brackets. But research done in the past two decades has found an interesting pattern: many people successfully recruited by cults are said to have low self-esteem. Cults generally do not look to recruit those with certain handicaps or clinical depression. However, people with low self-esteem are easier to break down, then build back up in an effort to teach them that the cult is the supportive environment they’re looking for.
New recruits are “love bombed.”
Once people have been recruited by a cult, they are often “love bombed.” This odd phrase is commonly used to describe the ways in which someone with low self-esteem is consistently flattered, complimented, and seduced in order to train their brain to associate the cult with love and acceptance.
Women are more likely than men to join a cult.
According to various research, women make up a whopping 70% of cult members around the globe. Psychologists have different ideas about why more women than men join cults. Dr. David Bromley of Virginia Commonwealth University points out that women simply attend more social gatherings, either religious or otherwise. This makes wom.
10 pages double spaced paper about the religion in Cuba. How was rel.docxChereCoble417
10 pages double spaced paper about the religion in Cuba. How was religion under Bautista? How did it change when Castro took charge? Why do Cuban practice santeria? Where is catholicism in Cuba now? The body should include what you ave discovered, its implications, and consequences. Explain why the topic is worth sharing and what we appreciate?
.
10-12 slides with 100-150 words per slideThe CEO heard about your .docxChereCoble417
10-12 slides with 100-150 words per slide
The CEO heard about your lunchtime discussion with the supervisors and managers when metrics were discussed. He would like you to help him prepare a PowerPoint presentation that he could use at the next board of directors meeting to link the day-to-day new metrics you suggested using to the bigger picture metrics that CEOs, CFOs and Board members would better relate to.
Create a presentation using the following format:
10 to 12 PowerPoint slides
Eye-catching graphics, clip art, and charts
A minimum of 100 to 150 words per slide of speaker notes
Content should include the following:
Specifically describe the linkage between the following pairs of metrics (Note: In each pair, the first metric is the kind of measurement the supervisors and managers would monitor and be evaluated on, and the second is the bigger picture metric the CEO, CFO, and board of directors may monitor.):
Dollar amount of WIP inventory:
Return On Assets
(
ROA
)
Order lead time to customers: Cash flow requirements or cash conversion cycle
Cycle time:
Return On Assets
(
ROA
)
Changeover time: Inventory turn
Inventory turn: Profit
For each pair, describe how a meaningful change in the first metric will impact the second metric.
.
1. Kaplan argues that the polarity structure or configuration of th.docxChereCoble417
1. Kaplan argues that the polarity structure or configuration of the international system influences or constrains the actions of large and small states. Do you agree with his assertion? If so how, if not why not?
2. The
issues of preserving and enhancing the biosphere and the role of humans in. How has the international community sought creating or exacerbating these issues pose a significant problem for the international community to address these issues and why have these issues proven so difficult to address?
3. What factors are most important in causing political actors to resort to terrorism? What options do the nations of the world have to address the problem of terrorism and which of these options do you believe to be most effective and why?
.
1. How long is a RIFS A. 2 microsecondsB. .docxChereCoble417
1.
How long is a RIFS?
A. 2 microseconds
B. 10 microseconds
C. 16 microseconds
D. 9 microseconds
2. What guard interval is used with 64-QAM by 802.11n HT devices to reach 600 Mbps data rates?
A. 800 ns
B. 200 ns
C. 100 ns
D. 400 ns
3. When two RF signals on the same frequency arrive at a receiver at the exact same time and their peaks and valleys are in alignment, what is true about these signals? (choose all that apply)
A. They are 180 degrees out of phase
B. They are 90 degrees out of phase
C. They have 0 degrees of separation
D. They are in phase
4. What is the cause of Free Space Path Loss?
A. Beam Reflection
B. Beam Absorption
C. Beam Diffraction
D. Beam Divergence
5. Which of the following are units of power?
A. dBi
B. Watt
C. Milliwatt
D. dBd
E. dBm
6. A single milliwatt = 0 decibels of change.
A. True
B. False
7. Which of the following increase amplitude?
A. Lightning arrestors
B. RF Cables
C. Pig tail adaptors
D. Antennae
E. Amplifiers
8. More than 40% blockage in the Fresnel Zone will not impede an RF link.
A. True
B. False
9. Which of the following describes a behavior of waves?
A. Frequency
B. Phase
C. Modulation
D. Amplitude
10. Phase is a standard measurement of RF wave size.
A. True
B. False
11. In an ERP 802.11 network, there are two mandated spread spectrum technologies.
A. True
B. False
12. ERP-OFDM stations can not connect with OFDM AP’s because the use different __________.
A. Contention methods
B. Modulation techniques
C. Frequencies
D. Coordination functions
13. Which data rates are supported by PBCC?
A. 6, 12, and 24 Mbps
B. 36, 48 and 54 Mbps
C. 1, 2, 5.5 and 11 Mbps
D. 22 and 33 Mbps
E. 1, 2, 5.5, 11, 22, and 33 Mbps
14. How many adjacent non-overlapping channels may be used in the same physical area using the 2.4 GHz spectrum?
A. 14
B. 11
C. 6
D. 3
15. The area of coverage provided by an AP is called which of the following?
A. BSS
B. ESS
C. BSA
D. WLAN
16. The function of an AP is most closely related to which wired networking device?
A. A Switch
B. A Hub
C. A router
D. A firewall
17. What is the largest channel size possible with 802.11ac?
A. 40 MHz
B. 80 MHz
C. 120 MHz
D. 160 MHz
18. What is required for stations to use 256-QAM?
A. they must have a firmware upgrade
B. there can be no more then 2 stations
C. they must be very close to the AP.
Palestine last event orientationfvgnh .pptxRaedMohamed3
An EFL lesson about the current events in Palestine. It is intended to be for intermediate students who wish to increase their listening skills through a short lesson in power point.
Students, digital devices and success - Andreas Schleicher - 27 May 2024..pptxEduSkills OECD
Andreas Schleicher presents at the OECD webinar ‘Digital devices in schools: detrimental distraction or secret to success?’ on 27 May 2024. The presentation was based on findings from PISA 2022 results and the webinar helped launch the PISA in Focus ‘Managing screen time: How to protect and equip students against distraction’ https://www.oecd-ilibrary.org/education/managing-screen-time_7c225af4-en and the OECD Education Policy Perspective ‘Students, digital devices and success’ can be found here - https://oe.cd/il/5yV
Welcome to TechSoup New Member Orientation and Q&A (May 2024).pdfTechSoup
In this webinar you will learn how your organization can access TechSoup's wide variety of product discount and donation programs. From hardware to software, we'll give you a tour of the tools available to help your nonprofit with productivity, collaboration, financial management, donor tracking, security, and more.
Ethnobotany and Ethnopharmacology:
Ethnobotany in herbal drug evaluation,
Impact of Ethnobotany in traditional medicine,
New development in herbals,
Bio-prospecting tools for drug discovery,
Role of Ethnopharmacology in drug evaluation,
Reverse Pharmacology.
Operation “Blue Star” is the only event in the history of Independent India where the state went into war with its own people. Even after about 40 years it is not clear if it was culmination of states anger over people of the region, a political game of power or start of dictatorial chapter in the democratic setup.
The people of Punjab felt alienated from main stream due to denial of their just demands during a long democratic struggle since independence. As it happen all over the word, it led to militant struggle with great loss of lives of military, police and civilian personnel. Killing of Indira Gandhi and massacre of innocent Sikhs in Delhi and other India cities was also associated with this movement.
Model Attribute Check Company Auto PropertyCeline George
In Odoo, the multi-company feature allows you to manage multiple companies within a single Odoo database instance. Each company can have its own configurations while still sharing common resources such as products, customers, and suppliers.
How to Create Map Views in the Odoo 17 ERPCeline George
The map views are useful for providing a geographical representation of data. They allow users to visualize and analyze the data in a more intuitive manner.
This is a presentation by Dada Robert in a Your Skill Boost masterclass organised by the Excellence Foundation for South Sudan (EFSS) on Saturday, the 25th and Sunday, the 26th of May 2024.
He discussed the concept of quality improvement, emphasizing its applicability to various aspects of life, including personal, project, and program improvements. He defined quality as doing the right thing at the right time in the right way to achieve the best possible results and discussed the concept of the "gap" between what we know and what we do, and how this gap represents the areas we need to improve. He explained the scientific approach to quality improvement, which involves systematic performance analysis, testing and learning, and implementing change ideas. He also highlighted the importance of client focus and a team approach to quality improvement.
Brightness at Varying Distances LabImage by Borb CC license
1. Brightness at Varying Distances Lab
Image by Borb CC license: http://en.wikipedia.org/wiki/Inverse-
square_law#/media/File:Inverse_square_law.svg
Purpose: In this lab, you will look at how light leaving a star
“spreads out” and how this spreading can be used to determine
the brightness of the star at different distances. While the focus
of this lab is on light, your results will apply equally well to
sound and the loudness of sounds at varying distances.
Equipment: This lab uses the optics bench, a square of
aluminum foil sandwiched between two squares of paraffin wax,
a lens holder to hold the wax, three incandescent light bulbs of
equal wattage with bases, and three optics stands. The lab also
requires access to the internet and a ruler.
Let’s start this lab by introducing the basic question that we
want to answer.
Part 1: Introducing the Question
At the front of the class is an optics bench with two identical
light bulbs on opposite sides of a wax block. In the center of the
wax block is a piece of reflective foil. The foil ensures that
each side of the wax is only illuminated by one of the light
bulbs.
In a moment, the instructor will turn on the light bulbs and turn
off the overhead light.
2. 1. How does the brightness of each side of the wax block
compare when the bulbs are both equal
distances from the wax?
a) Both sides of the wax are approximately the same
brightness
b) The left side of the wax is noticeably brighter
c) The right side of the wax is noticeably brighter
Your question for this experiment is: If we add a second
identical light bulb to the left side of the optics track, how far
must the two light bulbs be from the wax in order to make both
sides of the wax appear equally bright?
2. What is your prediction? If the single light bulb on the right
side is 20 cm from the wax, how
far away do you think the two light bulbs will need to be
from the wax in order to produce an
equal amount of brightness on their side of the wax?
Part 2: Computer Simulation
Open your internet browser and go to the online Flux Simulator
at
http://astro.unl.edu/classaction/animations/stellarprops/lightdete
ctor.html. The simulation shows two light bulbs and two light
3. sensors. The number on the sensors can be considered a
numerical value of the brightness at that location. Take a few
minutes to play around with the controls and see what you can
do to increase and decrease the brightness readings.
3*. Set the wattage of the top bulb to 50 and use the simulation
and your calculator to fill in the
table below. For columns 3 and 4, note that B1 is always
3.979.
Distance from bulb
Brightness Value
B1/R
B1/R2
R = 1.0
B1 = 3.979
R = 2.0
B =
R = 3.0
B =
R = 4.0
B =
R = 5.0
B =
4. *Note that in the last column, only R is squared, B1 is not being
squared.
4. The brightness value at R = 2.0 is:
a) approximately half of the brightness value at R = 1.0
b) significantly more than half of the brightness value at R =
1.0
c) significantly less than half of the brightness value at R =
1.0
Your answer to Question 4 tells us that the brightness does not
decrease linearly with distance. The brightness decreases faster
than linearly.
5*. Use your table to determine which equation below best
represents the brightness at different
distances.
6*. Let’s try out our equation. Calculate what you think B
would be at a distance of R = 2.3.
Show your work.
Move the sensor in the simulation to R = 2.3 and check that you
get the same result as from your calculation above.
7*. Calculate what you think the brightness value would be at R
= 7.0. Show your work.
5. 8*. Based on your results so far, make another prediction about
the opening question. Do you
think the two light bulbs will need to be:
a) less than 40 cm from the wax block
b) approximately 40 cm from the wax block
c) more than 40 cm from the wax block
9*. Discuss your answer above with the instructor and obtain
his/her initials indicating that you
have considered how your results above relate to our
opening question.
Let’s try to model our opening question is the simulation. Set
the top bulb to 50 Watts and the bottom bulb to 25 Watts. Try to
use the simulation to answer our opening question.
10*. Describe how you used the simulation to answer our
opening question. Where did you
move each object? What values are you comparing?
6. 11*. Based on your simulation results: If a single bulb is 20 cm
from the wax block, what
distance from the wax block should the two bulbs be in
order to produce equal brightness on
the wax?
12. Compare your answer for Question 11 with another group.
Do your answers agree? Did you
do the same thing in the simulation to determine your
answers?
**Once everyone is ready, the instructor will turn off the
classroom lights and demonstrate the two bulbs vs. one bulb
arrangement either confirming or contradicting your answer
above.
Let’s use our new understanding of brightness at varying
distances to think about what the Sun would look like from
other planets. To help us answer these questions, let’s go back
and notice a pattern in your results from the simulation. Use the
results in your table above to fill in the following table:
R = 2.0 (twice as far away)
B/B1 =
1/22 =
R = 3.0 (three times as far away)
7. B/B1 =
1/32 =
R = 4.0 (four times as far away)
B/B1 =
1/42 =
R = 5.0 (five times as far away)
B/B1 =
1/52 =
This table shows us that if an object is three times farther away,
it will appear approximately
1/32 = 1/9th as bright. If an object is five times farther away, it
will appear approximately
1/52 = 1/25th as bright. And so on. This pattern even works for
moving objects closer. If an object is half as far away, it will
appear times as bright. Use this pattern of reasoning to answer
the next two questions.
13*. Neptune is 30 times farther from the Sun than the Earth.
How would the brightness of the
Sun viewed from Neptune compare to the brightness of the
Sun viewed from Earth? Your
answer should be a numerical value (1/2 as bright, 1/40 as
bright, something like that).
14*. Mercury is 4/10 as far from the Sun as the Earth. How
would the brightness of the Sun
8. viewed from Mercury compare to the brightness of the Sun
viewed from Earth? Your
answer should be a numerical value.
Why 1/r2?
Why does the brightness behave this way; why is the equation B
= B1/r2? It is because we live in a three-dimensional world.
Imagine turning the bulb on for a millisecond and then turning
it off again. During the millisecond that the bulb is on, it emits
a flash of light in all directions. As the light leaves the bulb, it
spreads out in all directions like an explosion. As the flash of
light travels outward in all directions, the light (electromagnetic
energy) becomes spread over the surface of a sphere. As the
light moves farther away from the bulb, the sphere and its
surface get larger causing the light energy to be more spread out
meaning less of the total light hits your eye or the wax block.
The surface area of a sphere is given by 4r2. This is where the
r2 in our brightness equation comes from. If we lived in a two-
dimensional world, then the light would spread out over the
surface of a circle and the equation would be B = B1/r. If we
lived in a four-dimensional world, then the light would spread
over the surface of a hypersphere and the equation would be
B = B1/r3. You could say that our experiment today proved that
we live in a three-dimensional world. (Or at least a world with
9. three dimensions large enough to be noticed.)
Part 2: Using Apparent Brightness to Estimate Stellar
Distances*
The apparent brightness of different celestial objects can vary
significantly, by many orders of magnitude. In order to have
smaller values and ranges of values to work with, astronomers
classify the apparent brightness of stars, planets, and other
celestial objects by a number called ‘apparent magnitude’. This
system was introduced about 2000 years ago with the
astronomer Hipparchus gave the brightest appearing stars a
value of 1. Stars that appeared somewhat dimmer were given
apparent magnitude values of 2 and so on so that the larger the
apparent magnitude, the dimmer the star appears. In the mid
19th century the apparent magnitude system was revised on a
more systematic basis. As a result, we now have apparent
magnitude values of zero and even negative values for stars that
appear very bright.
You know from the first part of this lab, that the apparent
brightness of a star depends on both its distance from us and its
wattage. The tables on the following page give some helpful
apparent magnitude and wattage values.
10. *Based on Using Apparent Brightness to Estimate Stellar
Distances from The Universe in Your Hands
Apparent Magnitude
Object
-26.7
Sun
-12.5
Full Moon
-2.5
Jupiter (at its brightest)
-1.5
Sirius (brightest star)
6.5
Limit with unaided eye on darkest night
13.0
Limit with 8-inch telescope
24.0
Limit with 200-inch telescope
28.0
Limit with Hubble Space Telescope
Wattage
Object
Watts
Sun
Watts
Trinity atom-bomb test
200 Watts
Light bulb
1 Watt
Candle
Watts
Firefly (lightning bug)
11. On the last page of this activity is a nomogram. The nomogram
is a chart that allows you to convert between wattage, apparent
magnitude, and distance using a ruler rather than an equation.
As long as you know two out of the three quantities (wattage,
apparent magnitude, and distance) you can use a ruler to
connect the two quantities you do know and read off the value
of the third unknown quantity.
1. Use the nomogram and the apparent magnitude and wattage
values above to determine the
distance to the Sun. Check your result with the instructor.
2*. What would be the apparent magnitude of a 200 Watt li ght
bulb if it were 100 m from you?
3*. What astronomical object has approximately the same
apparent magnitude as the light bulb
in Question 2?
4*. How far would you have to be from a burning candle for it
to be barely visible to the
unaided eye? (It’s surprisingly far.)
5. The distance in question 4 is surely much larger than you
would have guessed. Offer two
possible explanations for why the value in 4 is so
surprisingly large.
12. 6*. How far would you have had to be from the Trinity atom
bomb test for it to have had the
same apparent magnitude as the Sun?
7*. The distance from Earth to Sirius is about 9 light years
(l.y.). What is the wattage of Sirius?
8*. How far would you have to be from Sirius for it to appear as
bright as the Sun?
Howard Community College - ASTR 114 Page 8
Howard Community College - ASTR 114 Page 7
72
Factors Influencing Social Sustainable in Small and Medium-
13. Sized Enterprises in India: A Case Study of Food Industry of
India
Contents
5
7
8
8
10
10
13
14
16
23
23
24
24
24
25
25
27
28
28
30
30
30
31
33
33
34
35
41
43
47
48
50
14. 50
52
53
55
55
58
59
62
62
64
67
72
79
LIST OF FIGURES
LIST OF TABLES
LIST OF ABBREVIATIONSAcknowledgement
I would like to thank my sincere gratitude to my supportive
supervisor for the continuous support and guidance that he
provided me during the writing of this report. I would also like
to thank the librarian for the provision of relevant academic
sources without which, this research would have been a pipe
dream.
DECLARATION
INTELLECTUAL PROPERTY STATEMENTExecutive
summary
There are various aspects of the modern business, which can be
an important part in the process of attaining sustainability and
competitive advantage within the business. One of the keys in
this context would be the social sustainability of the business.
Social sustainability serves as a key factor for business
competitiveness especially for the SMEs where the proper
15. connection with the community is deemed extremely important
for attaining business success. As per the research of Trufil &
Hunter (2012), social sustainability in SMEs mainly seeks to
improve on the innovation capacity of the companies. This facts
informed this research paper and thus sort to answer the main
research question; which factors that are driving social
sustainability in small and medium-sized enterprises in India in
context of the food industry of the nation This research paper
through a case study approach collected data using, semi -
structured interviews, observations and literature review on the
state of food industry SMEs in India. The findings showed that
technology, government policies, external and internal work
dynamics and environment drive social sustainability in India’s
food industry.CHAPTER 1: INTRODUCTION Background of
the Study
In the contemporary era of business, it is important for
companies to operate in a manner that can enable them to be
more comprehensive in the competitive environment. There are
various aspects of the modern business, which can be an
important part in the process of attaining sustainability and
competitive advantage within the business. One of the keys in
this context would be the social sustainability of the business.
Correspondingly, this particular research focus has been mai nly
on analyzing and examining the impact of social sustainability
within the SME sector in India. For this particular research
study, the focus has mainly been considered towards analyzing
and understanding the factors driving social sustainability in
small and medium-sized enterprises in India in context of the
food industry of the nation. As per the research of Popovic & et.
al. (2017) social sustainability in business mainly refers to the
concept of the work process of business units towards
developing products and structures which not only meet the
present demands of the community, but can also serve as a key
proponent in terms of supporting the future generation. In a
similar context, the views of Ajmal & et al. (2017) has argued
16. that social sustainability is one of the major way forward for
modern business towards attaining overall business
sustainability. The study has defined social sustainability to be
the process or the approach through which companies seek to
identify the impact of the business on the community or the
customers both positively and negatively. Social sustainability
serves as a key factor for business competitiveness especially
for the SMEs where the proper connection with the community
is deemed extremely important for attaining business success.
As per the research of Trufil & Hunter (2012), social
sustainability in SMEs mainly seeks to improve on the
innovation capacity of the companies. This can further comprise
of improvising or utilizing the optimum use of natural resources
towards increasing the productivity resulting in better value for
money for the customers regarding goods and services used. In
this regard, Ciemleja & Lace (2014) has also argued that there
are mainly three dimensions of sustainability for SMEs
including social, economic and ecological sustainability. The
study has also argued that social sustainability is directly
relevant to social environments in which companies operate.
The social capital of SMEs is regarded to be an important
element for this social development. Sava & et al. (2011), has
also argued that promoting social responsibility is crucial for
assuring a sustainable performance of the business, especially
for the SMEs. It is also regarded as a part of the CSR of the
business where the focus is on positively contributing towards
the society. Social sustainability means adding value to the
services that are provided to the key statehooders of the SMEs
such as government, environment, customers, shareholders, and
others. In this study, the focus has been mainly on analyzing the
factors that influence social sustainability among the SMEs in
India within the Food industry. As per the research of Jayeola
(2015), one of the major factors is the financial performance of
the business that links with social sustainability. It has been
noted that financial performance of the business of SMEs
determines their approach towards the environment. It mainly
17. imbibes the scale of operations of the business to improve on
the social performance of the business. Agreeing to the views of
Jayeola (2015), Hosseininia & Ramezani (2016) has extended
discussion on the factors influencing the social sustainability of
the SMEs in the food industry of India. The study has discussed
that some of the factors comprise of the environmental and the
social elements. The environment factors comprise of setting up
the standards for dealing with environmental issues effectively,
setting standards for workplace and moving into the recycling
of waste for the better of the environment among others. On the
other hand, the social factors would comprise of getting social
support from the community on a consistent basis, customer
orientation and staff training among others. This study will
focus on elaborating on these factors by collecting data that is
specifically relevant to the Indian food industry.
Food Industry of India
The food industry of India has been on a constant boom in the
recent times. As per the data of IBEF (2017), the food industry
of India has been depicting a considerable fluctuation trend and
has poised to be with high growth prospects in recent years. It
has a major contribution to the global food trade each year. The
sector is further deemed to be highly productive and profitable
with a current valuation of US$ 39.71 billion with a
compounded annual growth of around 11%. Food and grocery
comprise 31% of the overall share of consumption of customers
in this particular market. Regarding food and grocery, India is
the sixth largest market in the world. It is forecasted that by the
end of the year 2020, the market is expected to reach a figure of
around US$ 894.98 billion.
Aims and Objectives
The prime aim of this particular research study is to analyze the
factors that influence the social sustainability of SMEs of India
especially in the context of the food industry.
18. SMEs have proven to be heavily dependent on the business
ecosystem in comparison to large companies. Due to their
internal constraints, it makes them more vulnerable to the
market failures, policy inefficiencies and inconsistencies.
Enation of structural reforms on SMEs is targeted to foster
innovation, sustain a culture of business dynamism, promote
skills development, increase the ease to access of finance and
enable an easy access to the available public markets.
In the Indian Economy, SMEs play an integral role in the
development as the key drivers of growth. SMEs are key
players in the sectors such as Manufacturing, Infrastructure,
Service industries, Food processing, Packaging, Chemicals and
IT which have proven to be the most dynamic engines of growth
in the Indian economy in the recent years. SMEs include self-
funded proprietary firms, private self-help groups, Khadi,
village, and Coir industries that provide huge employment
opportunities and ensure that there is industrialization in the
regions that are not highly developed. The number of SMEs in
India is estimated as 42.50 million that is a proportion of 95%
of the total industrial units in the country. In terms of
employment opportunities, it employs about 106 Million that is
a 40% proportion of the total workforce in India. In terms of the
output, SMEs contribute a total of 45% of the total Indian
Manufacturing output and 45% of the total exports. The Indian
food processing Industry is recognized as having an immense
potential to transform the Indian Economy through large-scale
food manufacture that will benefit both the customers as well as
create broad employment opportunities and exports thus
increasing the GDP and the National Income of the country
(Wiese, 2014).Increased Urbanization in India comes with a
high demand for processed food, which shows that the future of
SMEs in the food industry is promising. Other factors of
consideration for SMEs in the food sector are the increased
expansion of the middle class as well as the growing health
awareness and the evolving consumer trends and demands.
19. An analysis of the differences between the small scale and
large-scale businesses reveal that large-scale firms in all the
sectors face different opportunities and challenges in
comparison to the small-scale firms. Despite the fact that the
small scale firms are more flexible in their ability to adapt to
the changes in the market trends, larger firms have the benefits
of a quality economies of scale which put them at a higher
political advantage and a better access to government credits,
contracts and licenses. However, a consideration of these
factors of size, the government has provisioned different
regulatory and development arrangements in India. This is
because the development of Small and Medium enterprises is
significant factors of employment, innovation, economic growth
and equity,(Wiese, 2014).In India, the Micro, Small and
Medium enterprises development Act 2006 subsequently merged
into the Ministry of small scale industries and the Ministry of
Agro and Rural industries in May 2007 which formed the
Ministry of Micro, Small and Medium enterprises in order to
address the challenges affecting the SMEs. This paper sought
to investigate how such initiatives favour the growth and social
sustainability of SMEs and if they create a channel for
innovation. Likewise, the study aimed at investigating other
enacted policies, the implications they have on SMEs towards
adoption and the impact of such policies to the community.
Social sustainability in SMEs is dependent on several factors.
SME development must take into consideration a cross cutting
strategy in that its success depends on the ability of the
government to implement sound macroeconomic policies, the
ability of the stakeholders to develop a conducive
microeconomic business environments and the ingrained ability
of the SME in implementing a competitive operating practice
and align its business practices, (Zhou, 2009). The success of
the SMEs is founded on the ability to align and integrate into
the broader National Development Strategy for instance,
poverty eradication or sustained development of the rural areas.
This research aimed at investigating whether such factors
20. promote or hinder social sustainability. Among the study’s
objective, was to investigate how social sustainability creates
an opportunity for the SMEs towards aligning its strategies and
integration towards the National Development Strategy.
Dialogue and partnerships between stakeholders is an integral
part of development within the SMEs. For instance, the
integration of the Public, Private and the civil society may
promote the ownership of some of the SMEs strategies making
them more implementable and more sustainable. According to,
(Zhou, 2009), enhancing Women’s capability to participate in
the SME development is also a significant factor of
consideration because women contribute an important share in
in the private sector and contribute a lot towards poverty
eradication. Gender is an important factor of consideration
when aligning SME development strategies and programs. Such
a significant factor should be investigated in Social
Sustainability to determine whether any strategies or factors are
aligned with gender and the success of the outcomes.
Legal, Regulatory and Administrative environments are a key
determinant of Social Sustainability of SMEs, (Wallen and
Fraenkel, 2001). The rules influence the investment decisions,
the opportunities and rewards available to the economic actors.
The Governments majorly focus on raising the revenues earned
from the taxes, protection and observation of the rule of law,
protection of health and safety of the consumers, labour laws
that focus on ensuring fair wages for all the employees. In
addition, SMEs only thrive with the presence of a simple,
transparent and low compliance cost tax system, which is
operational and fair for investment. Likewise, business
licensing is a factor of consideration of the sustainability of the
SMEs in conjunction with financial sector regulations in regards
to banking, leasing and insurance,(Wallen and Fraenkel, 2001).
Likewise, information asymmetry is a significant factor
undermining sustainability in SMEs, which determines the
financial stability and credibility of their sustainability
21. strategies. Correspondingly, the key objectives to be
accomplished in this study will be the following: (1) Analysis
of the importance of social sustainability to ensure overall
sustainability of SMEs, (2) Illustrating the impact of social
sustainability upon the SMEs in the food sector of India (3)
Examining the factors influencing the social sustainability of
SMEs in the Indian food industry
Research Questions
1. What are the factors that drive social sustainability in the
Small and Medium-Sized Enterprises in India in context of the
food industry?
2. What impact does changes in current policies, rules and
regulations of SME firms have on Social and Environmental
Sustainability??
3. What are the key achievement factors, including the part of
the administration and different partners, in advancing
maintainable SME improvement in India?Research Rationale
Social sustainability mainly acts as am approach of a particular
business unit towards the environment or the society or the
community altogether. It mainly seeks to ensure maximum
utilization of the natural resource towards business operations
so that maximum value can be added to the products and
services delivered to the people or the community. It has been
noted that companies are often attributed high financial cost to
attain environmental sustainability. As per the research of
Markku (2004), the current society expects a practically perfect
approach from the business units towards the society and the
environment. This aspect further assures that approach of
companies towards the environment and the society forms the
core of business operations. In a similar context, Eccles et al.
(2013) have determined that there is a consistent relationship
amid sustainability and firm’s performance, which further
implies that business units need to be more lenient towards
22. social sustainability. There has been a wide range of research
conducted regarding the importance of social sustainability and
regarding the operations of the companies about getting
comprehensively sustainable business operations.
Correspondingly, it is worth to conduct this research study,
which is specific to the Indian food industry and the SMEs in
this sector. This is because research conducted on this topic, is
inadequate which further acts as a motivation for conducting
this research study.
1.50. Research Structure
Six different chapters that have been discussed in brief
hereunder would conduct this research.
Chapter 1 Introduction: In this chapter, the focus has been
mainly on setting the tone of the research through providing a
brief background of the topic along with determining the aims
and objectives to be accomplished in the later stage. The
chapter also provides an understanding of the significance or
motivation of conducting this research study.
Chapter 2 Literature Review: This chapter of the study is
mainly focused on reviewing past papers relevant to the topic,
that is., the factors influencing social sustainability among the
SMEs within the Indian food industry. This will provide a
preliminary understanding of the topic, which will further assist
regarding the results of the study.
Chapter 3 Methodology: In this chapter of the study, the focus
would be mainly on justifying the methods selected for
conducting this research study based on the topic selected.
Chapter 4 Results: This section of the study has been focused
mainly on presenting the findings of the study collected from
various sources.
23. Chapter 5 Discussion: This chapter of the study has been mainly
being mainly focused towards discussing the findings of the
study based on the collected data in chapter 4. This will also
focus on accomplishing the objectives of the study.
Chapter 6 Conclusion: This chapter of the study has been
focused towards answering the research question based on the
collected data throughout the research study.
CHAPTER 2: LITERATURE REVIEW
2.10. Introduction to the Literature Review
The aim of this literature review is to examine the existing
secondary sources in order to investigate the relationship
between social sustainability in the Small and Medium sized
Enterprises. This will entail investigating both the internal
structures such as the business practices and the external factors
such as the government policies which influence SMEs ability
to integrate measures that promote social sustainability. In an
attempt to answer the research questions, the literature review
will be divided in sections that explain the background of
SMEs, the significance of Social Sustainability in the SMEs,
Factors undermining SMEs in the food industry in India,
policies and regulations and the reasons that contribute to the
failure of implementation of socially sustainable strategies in
the existing literature.
2.11. Small and Medium-Sized Enterprises
Small and medium-sized enterprises (SMEs) are considered as a
backbone of economic growth in all the countries because they
account for 80% of the global economic growth. In accordance
to a research done in India, 95% of the industrial units, which is
an estimate of 3.4 million, are in the small-scale sector with a
40% value addition in the manufacturing sector. These
enterprises contribute to 35% of the total Indian Exports. In
such a setting, it reveals that SMEs are fundamentally important
to the economy of India. Their immense potential to generate
24. employment opportunities, bolster the level of exports and bring
a flexible environment into India’s business environment is a
factor of strength, which must include ways of promoting
sustainability.
Hosseininia & Ramezani (2016) refers SMEs to be employment
multiplier mainly in the manufacturing and food industry. SMEs
are creating a competitive environment and driving economic
force that positively influences business and economy. Kot
(2018) that job creations in small sectors are less cost-effective
than in large business sector because it is more capital intensive
argues it. However, large companies offer stability,
compensation along with benefits that are more than the SMEs.
Consequently, SMEs are innovative and provides a high share of
effectiveness regarding investments. SMEs are growing and are
becoming relevant regarding investors and customer approach
that leads to sustainability and development of the economy.
Kour (2015) that growth of the economy that is based upon
innovation would be sustainable as it is linked with business
activities and technological advancement states it.
Furthermore, it is believed by Pachouri & Sharma (2016) that
SMEs usually plays a pivotal role in positively influencing the
economy by creating jobs, producing augmented new services to
ensure new innovation of products. The private employment
sctor across the globe is more because of the increase in the
SMEs sectors. Rakesh (2014) that SMEs are classified into two
types that include stability oriented and Growth oriented further
argues it. The name determines that stability oriented does not
intend to growth but tends to progress the family business by
providing moderate needs. On the other hand, growth-oriented
SMEs are usually small and are effective to explore new
opportunities for new opportunities and technologies. The
sustainability of the SMEs is based upon various aspects that
include effective sustainability policies, market environment,
opportunities, and infrastructure along with the human skills. In
25. the views of Sommer (2017), national policies are effective for
the growth of the SMEs, as they tend to provide policies for
scaling up SME funding opportunities that positive influences
the macroeconomic stability regarding sustainable economic
growth. The SME sector enhances the financial accessibility
leading to growth regarding the global economy.
2.12. SMEs and their commitment to sustainability
In spite of the significant role played by SMEs in the economy,
research has proven that they seem to be laggard on the subject
of commitment to sustainability (EC, 2012, Revell et all, 2010).
Several factors have been credited to this fact by different
authors. For example, a review done by del Brio and Junquera
(2003) highlighted nine distinct characteristics of SMEs which
explain the existing discrepancies in Social and Environmental
strategies. This includes factors such as financial resources,
organizational structures, the management style, Production
capabilities, the level of innovation, Human resources training.
Likewise, Hillary (2004) also outlined four major internal
barriers to the SMEs in their steps towards implementation of
sustainability, which includes factors such as insufficient
resources, implementation barriers, failure to understand the
benefits and an addition of the organization’s culture. The
correlative idea of both Hillary(2004) and del Brio and
Junquera(2003) is that SMEs have diverse circumstances and
competencies which are generally different from the large
companies which explains the discrepancies between large
companies and SMEs in terms of sustainability. Commitment to
sustainability is a significant factor of consideration because
sustainability is a pivotal factor to the organizational processes
and procedures such as the Management Philosophy, Quality
product decisions, the competitiveness of the SME and strategic
planning in line with the market economy.
2.13. The Impact Of Market Orientation Towards A
Commitment To Sustainability
26. Market orientation refers to the ability of the organization to
implement and adapt the marketing concept (Kohli and
Jowarsky, 1990). Market orientation is often viewed as the
most dominant managerial concept (Goldman and Grinstein,
2010). Kohli and Jowarsky (1990) continue to argue that Market
Orientation is the ability of the organization to develop a
certain form of market intelligence, which pertains to the
current and future customer’s needs, which is disseminated
across all the departments that respond to the outline. Different
researchers have proven different facts about Market
Orientation as a limiting factor of SMEs commitment to
sustainability. Oakley (2011) explains that a Market Oriented
SME is Customer focused, coordinates and plans its activities in
a way that shows focus and commitment to the community and
is focused externally. The two researchers continue to expound
that customer focus is the extent in which the organization sees
its business as creating utility to their customers by putting the
needs of the customers first. Coordination and planning are the
processes through which the organization structures and aligns
the businesses process with an integration of sustainability
where the entire organization remain focused on their marketing
concept. Crittenden et all (2011) and Gonzalez Benito (2008)
both distinctly approach Market Orientation as a possible
predictor of commitment to sustainability amongst SME
companies. They argue that if their customers and external
society demand for social and environmental sustainability,
then the Market Oriented SMEs because of their market
Intelligence and sensitivity to their customer’s needs, they will
respond accordingly. Likewise, the concept that customer’s and
stakeholder’s pressures trigger SMEs to develop sustainability
measures has been adopted by different authors and has also
received support from other researchers. Kammer (2009)
expounds that SMEs tend to focus on sustainability if they see it
is a way to deliver benefits to their customers. In conclusion,
on the factor of market orientation, commitment to social
sustainability is a function of the focus on the customers that is
27. only evident in Market Oriented Firms. In the context of,
Storey, (2016), it can be stated that a small business
organization should organize a market research programme to
determine the actual market demands regarding their products.
Moreover, appropriate market research helps an organization to
determine the position of the competitors in the market, which
helps them to take an upright decision to compete with the
competitors in a stipulated gesture.
2.14. The Influence of Entrepreneurial Orientation in
commitment to sustainability
Stakeholders play an integral role in determining the
commitment of an organization towards sustainability.
However, there are situations where the customers make little
requests towards sustainability. Customers may not know ahead
what are their sustainability needs or the constantly changing
non- linear environmental and social problems (Heikkurinen and
Bonnedal, 2013). This shows that without the involvement if
the customers or other stakeholders, Market oriented firms take
to initiatives to invest in sustainability. Sustainability does not
necessarily flow from the customers or stakeholders but also on
the Entrepreneurial Orientation, which sustains sustainability.
Entrepreneurial Orientation has three components that entail
pro-activeness, Innovation and risk taking. For instance, risk
taking may include factors such as investing in new
sustainability measures, which may include untested
environmental technologies. Innovation and pro-activeness
means that the organization is dynamic towards finding
opportunities in the market and developing new sustainable
business ventures. In this aspect, the corporation views
sustainability as a source of competitive advantage where there
is a combination of entrepreneurial innovation with sustainable
business practices. Aragon Correa et al (2008) showed that pro-
activeness is connected to sustainable innovative practices in
SME contexts. Through the research by Menguc and Ozanne
28. (2005), it is evident that the higher the level of EO, through
flexibility, foresightedness and the ability to innovate gives
SMEs a resource through which they see opportunities and work
out sustainability strategically.
2.15. Importance of Management values on Commitment to
sustainability
. In comparison to larger organizations, SMEs are classified by
a flatter and less formalized organizational structure. Likewise,
this fact in conjunction with the ownership of the organization
indicates that ownership, control and operations are in the hands
of a small team of individuals. The attitudes, knowledge and
orientation of the manager play an integral role towards
sustainability (Cassells and Lewis, 2011: Kearins et all, 2010.
Due to the nature and operation of the SMEs, the set of the
individuals have the potential to influence the strategies and
culture of the individual organization. There are many
indicators in literature, which give evidence that managers hold
a positive attitude and driving force towards sustainability of
the organization. For instance in a research done in 220 SMEs
in the UK where 82% agreed that sustainability and
environmental issues were a high management priority while
70% disagreed with the statement that the business managers
cannot be expected to manage social issues(Revell et all,2010)
Such results are reinforced by other qualitative studies that
highlight that the manager’s attitude and values are important
for commitment to sustainability in the SME group. Kearins et
all 2010 highlighted the significance of values in the interviews
with visionary small enterprises. The nature of the managerial
values was important to the direction of the company. Likewise,
Parry 2012 expounds on the significance of personal and ethical
beliefs of the managers. In this study, all the managers who
were interviewed said that their ethical and moral orientation
was a key factor to develop more sustainable environment
friendly practices.
29. 2.16. Promotional policies for SMEs in the Indian government
The relevance of SMEs is being recognized globally, and it is
vital to coordinate activities by …