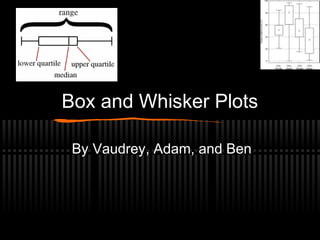
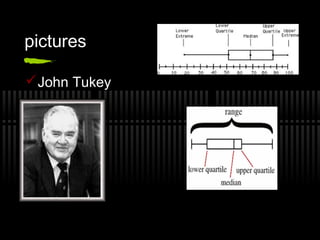
Box and Whisker Plots
By Vaudrey, Adam, and Ben
How to get the data for a box- and
-whisker plot
 First arrange the numbers from smallest to
largest
 Next find the median by finding the middle
number of the data (If there are two add them
together and divide by two)
 Then we find the Quartile by finding the
median of the two haves of the data
 Lastly you need to find the whiskers which are
the smallest and the biggest number
How to set up a box an whisker
plot
 First make a number line that can fit your data
 Make a line to label the median
 Then make two more lines to label your two
quartiles
 To make your whiskers label the higest and
lowest number with dots
 Next label median, the two quartiles, and the
highest and lowest number
 Lastly connect all three lines to make a box.
 Also connect the two dots with a line to the box
History of a box and whisker plot
Invented by john wilder tukey
The official publishing was in 1977
Originally used to display statistics
pictures
John Tukey
pictures
John Tukey

Box and whisker

  • 1.
    Box and WhiskerPlots By Vaudrey, Adam, and Ben
  • 2.
    How to getthe data for a box- and -whisker plot  First arrange the numbers from smallest to largest  Next find the median by finding the middle number of the data (If there are two add them together and divide by two)  Then we find the Quartile by finding the median of the two haves of the data  Lastly you need to find the whiskers which are the smallest and the biggest number
  • 3.
    How to setup a box an whisker plot  First make a number line that can fit your data  Make a line to label the median  Then make two more lines to label your two quartiles  To make your whiskers label the higest and lowest number with dots  Next label median, the two quartiles, and the highest and lowest number  Lastly connect all three lines to make a box.  Also connect the two dots with a line to the box
  • 4.
    History of abox and whisker plot Invented by john wilder tukey The official publishing was in 1977 Originally used to display statistics
  • 5.
  • 6.