1. Proceedings of the Institution of
Civil Engineers
Structures & Buildings 156
November 2003 Issue SB4
Pages 367–371
Paper 13029
Received 23/08/2002
Accepted 17/12/2002
Keywords:
buildings, structure & design/
dynamics/field testing & monitoring
A. Blakeborough
Lecturer, Department of
Engineering Science,
University of Oxford
M. S. Williams
Lecturer, Department of
Engineering Science,
University of Oxford
Measurement of floor vibrations using a heel drop test
A. Blakeborough and M. S. Williams
As floor vibration problems increase, there is a need for
simple and reliable methods of determining a floor’s
dynamic properties. This paper presents a technique
called the instrumented heel drop test, in which the
floor is excited by a series of heel drops performed on
top of a slim load cell placed on the floor. The test is
shown to give excellent resolution of natural frequencies
in the range 2 – 15 Hz, which corresponds well with the
frequency range of interest in floor vibration problems.
The method appears to offer some advantages over the
well-established technique of instrumented hammer
testing, in terms of the quality of frequency resolution
and the speed of the test.
1. INTRODUCTION
There is an increasing incidence of problematic floor vibrations
in structures such as office buildings, hospitals and domestic
housing.
1–3
The problems are caused by a variety of factors
including recent trends towards long-span, lightweight
construction, the increasing need for very low-vibration
environments (as in hospital operating theatres, for example)
and changes of use of existing structures (such as conversion
of an office floor to a gymnasium). As a result there is a
growing need for measurement of floor dynamic parameters
such as natural frequencies, modal damping ratios and modal
masses.
In a dynamic test, the floor is excited (that is, set in motion) by
some means and its response is measured using an
accelerometer. Several different excitation methods are
available. A very simple method that has been used for many
years is the heel drop test,
4
in which a person stands in the
middle of the floor, rises onto their toes and then drops down
so that their heels strike the floor. This test has been widely
used over the past 30 years and has formed a part of many
proposed design procedures.
5,6
These procedures idealise the
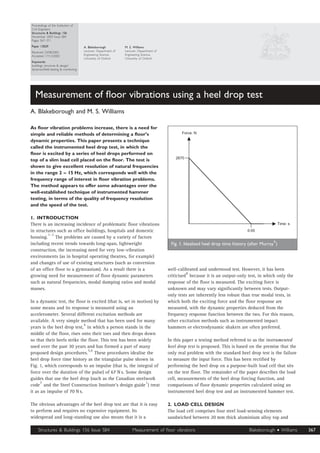
heel drop force time history as the triangular pulse shown in
Fig. 1, which corresponds to an impulse (that is, the integral of
force over the duration of the pulse) of 67 N s. Some design
guides that use the heel drop (such as the Canadian steelwork
code
7
and the Steel Construction Institute’s design guide
1
) treat
it as an impulse of 70 N s.
The obvious advantages of the heel drop test are that it is easy
to perform and requires no expensive equipment. Its
widespread and long-standing use also means that it is a
well-calibrated and understood test. However, it has been
criticised
8
because it is an output-only test, in which only the
response of the floor is measured. The exciting force is
unknown and may vary significantly between tests. Output-
only tests are inherently less robust than true modal tests, in
which both the exciting force and the floor response are
measured, with the dynamic properties deduced from the
frequency response function between the two. For this reason,
other excitation methods such as instrumented impact
hammers or electrodynamic shakers are often preferred.
In this paper a testing method referred to as the instrumented
heel drop test is proposed. This is based on the premise that the
only real problem with the standard heel drop test is the failure
to measure the input force. This has been rectified by
performing the heel drop on a purpose-built load cell that sits
on the test floor. The remainder of the paper describes the load
cell, measurements of the heel drop forcing function, and
comparisons of floor dynamic properties calculated using an
instrumented heel drop test and an instrumented hammer test.
2. LOAD CELL DESIGN
The load cell comprises four steel load-sensing elements
sandwiched between 20 mm thick aluminium alloy top and
Force: N
2670
0.05
Time: s
Fig. 1. Idealised heel drop time history (after Murray
6
)
Structures & Buildings 156 Issue SB4 Blakeborough • Williams 367Measurement of floor vibrations
2. bottom plates (Fig. 2). The overall depth is 85 mm and the top
plate has plan dimensions 400 mm 3 400 mm, sufficient for a
person to stand on and perform a heel drop test without
difficulty (Fig. 3). It weighs 17 kg, making it easily portable.
When supporting a mass of 75 kg (the mass of a typical person)
the bending deflection of the top plate is about 0·01 mm and
its fundamental frequency is around 150 Hz. The load can thus
be transferred to the sensing elements without excessive
deformation or vibration within the load cell.
3. MEASUREMENTS OF HEEL DROP FORCE
The load cell was placed on a very stiff floor and was used to
measure a series of heel drops. The load was sampled at a
frequency of 256 Hz. Fig. 4 shows a typical heel drop time
history for a man of mass 75 kg. The static weight has been
subtracted from the force measurement so that the graph shows
only the dynamic variations in force. In the first part of the
signal the man rises from a normal standing position onto his
toes. This causes small fluctuations in force as he accelerates
upwards and then comes to rest. The man then balances on his
toes for about half a second before bringing his heels down,
causing an initial reduction in vertical force as his centre of
gravity accelerates downwards, followed by a very sharp
increase in force at the moment of heel impact. Following the
main impact there is a short period of heavily damped
oscillation at a frequency of around 5 Hz: this is due to vertical
vibration of the human body. Clearly, the total force input to
the floor is considerably more complex than the idealised
impulse in Fig. 1.
Figure 5 shows the time history of the main impact and
subsequent body vibrations for nine heel drops performed by
the same person. It can be seen that a single person is able to
achieve quite a high degree of repeatability, both for the
approximately triangular force pulse at heel impact and for the
subsequent body vibrations. The downward impulse due to heel
impact (that is, the area under the main positive force pulse) in
these nine tests ranged from 59·7 to 73·1 N s, with a mean of
65·6 N s. This agrees well with previous published work, which
suggests that a heel drop can be treated as an impulse of
67–70 N s.
1,5–7
However, measurement of heel drop tests
performed by several different people showed quite a high
degree of scatter, which was only weakly correlated with the
variation in mass of the person.
This variability in the input force may be problematic in cases
where the force is not measured and is assumed to take some
arbitrary value. However, it is of far less concern in the
instrumented heel drop test, where the actual force is measured
on each occasion. A more important parameter is the frequency
content of the signal, as this governs the range of structural
frequencies likely to be excited by a heel drop. Fig. 6 shows the
power spectral densities computed from a series of heel drops
by four different people, in each case normalised to a peak
value of unity. Although there are some differences between
the curves, they all show quite similar overall trends. In each
case the peak power is achieved at a frequency in the range
2·5–5 Hz, and there is significant power at frequencies between
1 and 15 Hz. The heel drop would therefore be expected to be
effective at exciting floors with frequencies in this range.
Problem floors are likely to have frequencies well below 15 Hz,
so this frequency range is more than adequate.
4. COMPARISON OF INSTRUMENTED HEEL DROP
AND HAMMER TESTS
The instrumented heel drop test has been used to determine the
dynamic properties of a simple composite floor. The results
were compared with those from an instrumented hammer test
in order to evaluate the method. The tested floor comprised a
130 mm thick concrete slab supported on a regular grid of steel
universal beams. Primary beams were spaced at 3·6 m centres
and spanned 7·0 m between columns, as shown in Fig. 7. This
is a relatively stiff structure, which was not expected to be
prone to vibration problems.
In the tests reported here the excitation (either instrumented
hammer or heel drop) was applied at point A in Fig. 7, at the
midspan of a secondary beam, with the floor response
measured by an accelerometer positioned at B. Initial data
processing was performed using an Advantest R9211C
spectrum analyser, with further processing performed later on a
PC.
Fig. 3. Performing a heel drop test on the load cell
Fig. 2. View of load cell showing one of the four load-sensing
elements
Structures & Buildings 156 Issue SB4 Blakeborough • Williams368 Measurement of floor vibrations
3. For the instrumented heel
drop test, heel drops were
performed by a person of
mass 75 kg. Frequency
response functions (FRFs)
were computed from 40 s
samples of data, during
which time approximately
ten heel drops were
performed. It is normal to
average several samples to
minimise the effects of
measurement noise. In this
case, based on past
experience, six tests were
averaged to produce the final
FRFs. The test therefore took
a total of 4 min.
For comparison, a test was
performed using identical
equipment and processing
methods, except that the heel
drop was replaced by a
Dytran impact hammer, fitted
with its own load cell. For the
hammer test, ten averages
were taken, with
approximately ten hammer
blows in each 40 s sample.
The results are shown in Fig.
8. The top two plots show
the frequency response
function; as this is a
complex quantity it is
plotted as an amplitude (in
units of flexibility) and a
phase angle. Natural
frequencies are identified by
peaks in the FRF amplitude
and sudden shifts in phase
angle. The width of the FRF
peaks can be used to
estimate the damping
present, with a higher
damping level giving a
broader peak. The third plot
is the coherence, a measure
of the extent to which the
measured floor acceleration
is caused by the measured
input force rather than by
some other unmeasured
input. A coherence value of
zero means there is no
relationship between the
signals, while a value of 1·0
implies complete dependence.
A high coherence is a good
indicator of the quality of
the test data, and enables
Rising
onto
toes Balancing
Heel impact
Body vibration
Heels descending
0 0.5 1 1.5 2 2.5
Time: s
2000
1500
1000
500
0
Ϫ500
Ϫ1000
Force:N
Fig. 4. Typical heel drop time history
2500
2000
1500
1000
500
0
Ϫ500
Ϫ1000
Force:N
1.6 1.7 1.8 1.9 2 2.1 2.2 2.3 2.4 2.5 2.6
Time: s
Fig. 5. Comparison of nine heel drops performed by a single person
1
0.8
0.6
0.4
0.2
0
NormalisedPSD
0 2 4 6 8 10 12 14 16 18 20
Frequency: Hz
Fig. 6. Power spectral density of heel drops performed by different people
Structures & Buildings 156 Issue SB4 Blakeborough • Williams 369Measurement of floor vibrations
4. more accurate estimates of the modal properties to be
extracted from the data.
The results show that both test methods give very similar
estimates of the natural frequencies, the lowest of which is at
10·9 Hz. However, there are some significant differences:
(a) The instrumented heel drop test gives near-perfect
coherence across the frequency range shown, whereas the
hammer test coherence is poor at low frequencies and also
shows some localised reductions at a few frequencies
between 10 and 16 Hz.
(b) At low frequencies (below 4 Hz) the hammer test gives very
poor data, with numerous spurious FRF peaks accompanied
by poor coherence, whereas the heel drop test gives a
smooth FRF and excellent coherence. The heel drop FRF
Hammer
Heel drop
90
0
Ϫ90
Ϫ180
Phase:degree
2 4 6 8 10 12 14 16 18 20
Frequency: Hz
Hammer
Heel drop
0.3
0.2
0.1
0
Flexibility:10Ϫ6
m/N
2 4 6 8 10 12 14 16 18 20
Frequency: Hz
Hammer
Heel drop
1
0.5
0
Coherence
2 4 6 8 10 12 14 16 18 20
Frequency: Hz
Fig. 8. Modal test results: comparison of FRF amplitude, phase and coherence determined by instrumented heel drop test and
instrumented hammer test
7000
3000
2333
1800
1200
3600
B
A
Fig. 7. Floor layout showing test locations (dimensions in mm)
Structures & Buildings 156 Issue SB4 Blakeborough • Williams370 Measurement of floor vibrations
5. does begin to deteriorate at frequencies below 2 Hz (not
shown in the figure).
(c) At intermediate frequencies (from 4 to about 15 Hz, the key
frequency range for most floors) the instrumented heel
drop test gives a much smoother FRF and a vastly superior
coherence, making it easier to obtain accurate estimates of
modal damping and stiffness.
(d) It is only at the less interesting, higher frequencies (above
15 Hz) that the performance of the two techniques is
similar.
This contrast is in spite of the fact that the heel drop results
were obtained using fewer averages and therefore a shorter test
duration. The improvement is due to the fact that the heel drop
puts a large amount of energy into the frequency range of
interest, whereas the hammer spreads the energy over a much
wider range.
The instrumented heel drop test is therefore particularly
suitable for modal testing of structures with frequencies in the
range 2–15 Hz.
5. CONCLUSIONS
As floor vibration problems increase, there is a need for simple
and reliable methods of determining a floor’s dynamic
properties. This paper has shown that, by using a simple load
cell placed on the floor, the well-known heel drop test can be
adapted to be part of an effective modal testing technique. The
instrumented heel drop test has been shown to give excellent
resolution of frequency response functions in the range
2–15 Hz, making it ideally suited to determining the modal
properties of potentially problematic floors.
6. ACKNOWLEDGEMENTS
The authors gratefully acknowledge the support of the Steel
Construction Institute.
REFERENCES
1. WYATT T. A. Design Guide on the Vibration of Floors. Steel
Construction Institute, Ascot, 1989, SCI Publication 076.
2. WILLIAMS M. S. and WALDRON P. Evaluation of methods for
predicting occupant-induced vibrations in concrete floors.
The Structural Engineer, 1994, 72, No. 20, 334–340.
3. MURRAY M. M., ALLEN D. E. and UNGAR E. E. (1997) Floor
Vibrations due to Human Activity. American Institute of
Steel Construction, Chicago, AISC/CISC Steel Design Guide
Series 11.
4. LENZEN K. H. and MURRAY T. M. (1969) Vibration of steel
joist concrete slab floor systems. Department of Civil
Engineering, University of Kansas, Lawrence, Kansas, 1969,
Report No. 29.
5. ALLEN D. E. Vibrational behavior of long-span floor slabs.
Canadian Journal of Civil Engineering, 1974, 1, 108–115.
6. MURRAY T. M. Design to prevent floor vibrations.
Engineering Journal, American Institute of Steel
Construction, 1975, 12, No. 3, 82–87.
7. CANADIAN STANDARDS ASSOCIATION. Steel Structures for
Buildings: Limit States Design. Appendix G: Guide for Floor
Vibrations. Canadian Standards Association, Rexdale,
Ontario, 1989, Canadian Standard CAN3-S16·1-M89.
8. CAVERSON R. G., WALDRON P. and WILLIAMS M. S. (1994)
Review of vibration guidelines for suspended concrete slabs.
Canadian Journal of Civil Engineering, 21, 931–938.
Please email, fax or post your discussion contributions to the secretary by 1 May 2004: email: daniela.wong@ice.org.uk;
fax: þ44 (0)20 7799 1325; or post to Daniela Wong, Journals Department, Institution of Civil Engineers, 1–7 Great George Street,
London SW1P 3AA.
Structures & Buildings 156 Issue SB4 Blakeborough • Williams 371Measurement of floor vibrations