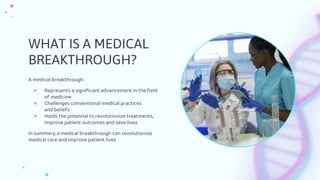
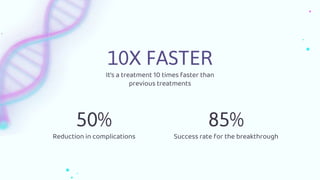
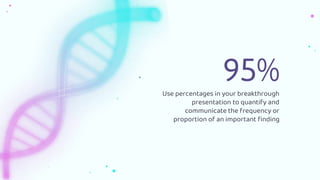
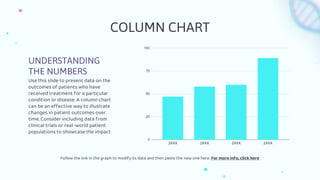
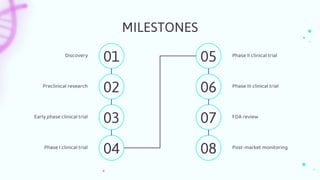
BIOINFORMATICS
APPLIED TO MEDICINE
BREAKTHROUGH
Here is where your presentation begins
CONTENTS OF THIS TEMPLATE
FONTS
To view this template correctly in PowerPoint, download and install the fonts we
used
USED AND ALTERNATIVE RESOURCES An assortment of graphic resources that are suitable for use in this presentation
THANKS SLIDE You must keep it so that proper credits for our design are given
COLORS All the colors used in this presentation
ICONS AND INFOGRAPHIC RESOURCES These can be used in the template, and their size and color can be edited
EDITABLE PRESENTATION THEME You can edit the master slides easily. For more info, click here
You can delete this slide when you’re done editing the presentation
For more info:
SLIDESGO | BLOG | FAQs
You can visit our sister projects:
FREEPIK | FLATICON | STORYSET | WEPIK | VIDEVO
TABLE OF CONTENTS
01
04
02
05
03
06
INTRODUCTION BACKGROUND METHODOLOGY
RESULTS DISCUSSION CONCLUSION
INTRODUCTION
01
WHAT IS A MEDICAL
BREAKTHROUGH?
A medical breakthrough:
● Represents a significant advancement in the field
of medicine
● Challenges conventional medical practices
and beliefs
● Holds the potential to revolutionize treatments,
improve patient outcomes and save lives
In summary, a medical breakthrough can revolutionize
medical care and improve patient lives
CONTEXT
INTRODUCTION
Provide context and emphasize the
importance of addressing the identified
challenge. Discuss existing knowledge or
approaches, emphasizing the gaps or
limitations that hinder progress and
drive the need for innovative solutions
Clearly state the specific problem or
challenge in the medical field. Emphasize
its significance and impact, highlighting
gaps or limitations in current knowledge
or approaches that motivate the need
for a breakthrough
PROBLEM STATEMENT
BACKGROUND
CURRENT
LANDSCAPE
EMERGING
TRENDS
Highlight the current challenges
and limitations in the medical
field that require a
breakthrough. Describe the
healthcare problems, diseases
or conditions that need
innovative solutions
Focus on emerging medical
trends, technologies, or
scientific discoveries that
present an opportunity for a
breakthrough. Discuss the
potential benefits, such as more
accurate diagnostics or
preventive measures
Outline a visionary goal for the
breakthrough, such as curing a
disease or revolutionizing
procedures. Highlight the
broader impact on healthcare
and global quality of life
BREAKTHROUGH
VISION
Outline the research design for the
medical breakthrough. Describe the
type of study, sample size, inclusion
criteria and ethical considerations
Explain the methods and tools used
for data collection, including patient
records or examinations. Emphasize
data accuracy and patient privacy
Describe the approach for analyzing
the collected data. Explain the
statistical methods or qualitative
analysis techniques used to derive
meaningful insights
Discuss the steps taken to validate the
results. Explain how the findings will
be reviewed, confirmed or peer-
reviewed for scientific rigor
METHODOLOGY
STUDY DESIGN
DATA ANALYSIS
DATA COLLECTION
RESULTS VALIDATION
RESULTS
Present the analyzed data from
the study. Describe the methods
used for analysis and highlight
key findings and trends
Focus on numerical results
derived from the analysis.
Present percentages, means or
correlations and use visual aids
Compare results with existing
literature or previous studies.
Highlight similarities,
differences, and novel insights
for knowledge
Acknowledge study limitations.
Discuss challenges faced during
data collection, analysis and
interpretation
DATA ANALYSIS QUANT. RESULTS QUAL. RESULTS
Discuss qualitative findings
from interviews or surveys.
Present themes, patterns and
include examples
Summarize the findings and
their implications. Discuss the
impact on medical practice,
patient care or future research
COMPARISON LIMITATIONS CONCLUSIONS
It’s a treatment 10 times faster than
previous treatments
50%
Reduction in complications
10X FASTER
85%
Success rate for the breakthrough
Use percentages in your breakthrough
presentation to quantify and
communicate the frequency or
proportion of an important finding
95%
COLUMN CHART
UNDERSTANDING
THE NUMBERS
Use this slide to present data on the
outcomes of patients who have
received treatment for a particular
condition or disease. A column chart
can be an effective way to illustrate
changes in patient outcomes over
time. Consider including data from
clinical trials or real-world patient
populations to showcase the impact
Follow the link in the graph to modify its data and then paste the new one here. For more info, click here
MILESTONES
Phase II clinical trial
05
Phase III clinical trial
06
FDA review
07
Post-market monitoring
08
Discovery
01
Preclinical research
02
Early phase clinical trial
03
Phase I clinical trial
04
TREATMENT OPTION EFFICACY RATE SIDE EFFECTS COST AVAILABILITY
Medication A 80% Mild $$ Widely available
Medication B 70% Moderate $$$ Available only with prescription
Surgery 90% High $$$$ Requires specialized facilities
Radiation therapy 75% Moderate $$ Available in most hospitals
Immunotherapy 65% Moderate $$$$
Available only in select
medical centers
Physical therapy 60% Mild $$ Widely available
TREATMENT OPTIONS
CLINICAL TRIAL PHASES
PHASE 1: SAFETY AND DOSAGE
● Participants: 20-100 healthy volunteers
● Objective: To determine safe dosage and identify side
effects
● Duration: 6 months
● Success rate: 80% of participants completed the trial
without experiencing significant side effects
PHASE 2: SIDE EFFECTS
PHASE 3: LARGE-SCALE TESTING
● Participants: From several hundred to thousands of
people with the condition
● Objective: To confirm effectiveness, monitor side
effects, and compare to standard treatments
● Duration: 24 months
● Success rate: New treatment was better in 75% cases
PHASE 4: POST-MARKET MONITORING
● Participants: Thousands of people with the condition
who are taking the drug
● Objective: To monitor long-term safety and
effectiveness and detect rare side effects
● Duration: Ongoing
● Success rate: No safety concerns identified in the two
years since the approval for market use
● Participants: Up to several hundred people with the
condition
● Objective: Determine effectiveness and further
evaluate safety
● Duration: 12 months
● Success rate: 65% of participants experienced a
significant improvement in symptoms
DATA AND STATISTICS
KEY PERFORMANCE INDICATOR NUMBER
Drug discovery 2,500
Alternative energy sources 95%
Stem cell Therapy 493
TREND IN PATIENT OUTCOMES
● List the key performance indicators (KPIs) relevant
to the medical breakthrough
● Enter the values or metrics for each KPI in the table
● Discuss the significance of each KPI and its relation
to the breakthrough
● Highlight any notable achievements or milestones
reflected in the table
● Illustrate the trend in patient outcomes over time
● Highlight the impact of the medical breakthrough
on patient outcomes
● Describe any significant changes or improvements
observed in the graph
Follow the link in the graph to modify its data and then paste the new one here. For more info, click here
IMPLICATIONS
—DR. JANE DOE, MEDICAL PROFESSIONAL
“It's been a true lifesaver for me. I can enjoy life again without any discomfort”
“I've seen a significant improvement in patient outcomes. This breakthrough makes treatment
more efficient and personalized”
“We are impressed with the safety and effectiveness of this breakthrough. It will greatly benefit
patients and healthcare systems”
—JOHN SMITH, PATIENT
—SANJAY PATEL, REGULATORY BODY REPRESENTATIVE
KEY MEMBERS
MARK JONES
Use a sentence that describe
their job
ROLE: Lead researcher
CONTRIBUTIONS:
● You can enter a description
of the contributions here
● You can enter a description
of the contributions here
● You can enter a description
of the contributions here
ROLE: Clinical trial manager
CONTRIBUTIONS:
● You can enter a description
of the contributions here
● You can enter a description
of the contributions here
● You can enter a description
of the contributions here
SARAH JAMES
Use a sentence that describe
their job
RESULTS AND CONCLUSIONS
BACKGROUND
Briefly introduce the context of the investigation, such as the
medical condition or problem being addressed and the goals
STUDY DESIGN
Describe the design of the study, such as whether it was a
randomized controlled trial or observational study, the sample
size and the inclusion and exclusion criteria
FINDINGS
Summarize the main findings of the investigation, including
statistical results and any important trends or patterns
observed
IMPACT
Discuss the implications of the findings for patients, healthcare
providers and other stakeholders. You could also mention any
potential limitations of the study or areas for future research
REFERENCES
Include a reference page with the sources used in
your presentation. List the sources in alphabetical
order and include the author's name, the title of the
source, the publication date and the publisher or URL
CONCLUSIONS
Briefly summarize the main findings of the
study or analysis
Discuss the implications of the findings and how
they relate to the original research question
1
2
CREDITS: This presentation template was created by Slidesgo, and
includes icons by Flaticon and infographics & images by Freepik
DO YOU HAVE ANY QUESTIONS?
youremail@freepik.com
+91 620 421 838
yourwebsite.com
THANKS
Please keep this slide for attribution
ALTERNATIVE RESOURCES
Here’s an assortment of
alternative resources whose style
fits the one of this template:
VECTORS
● Dna background
● Abstract dna background I
● Abstract dna background II
RESOURCES
Did you like the resources in this template? Get them for free at our other websites:
PHOTOS
● Laboratory team working together
● Doctor performing medical research in lab
● Side view of male researcher in the laboratory looking through microscope
● Medium shot woman in lab
● Front view doctor working at clinic
● Cheerful ethnic medic with papers
● Side view of female researcher in the laboratory with safety glasses
VECTORS
● Abstract dna background

Bioinformatics applied to medicine breakthrough.pptx

  • 1.
  • 2.
    CONTENTS OF THISTEMPLATE FONTS To view this template correctly in PowerPoint, download and install the fonts we used USED AND ALTERNATIVE RESOURCES An assortment of graphic resources that are suitable for use in this presentation THANKS SLIDE You must keep it so that proper credits for our design are given COLORS All the colors used in this presentation ICONS AND INFOGRAPHIC RESOURCES These can be used in the template, and their size and color can be edited EDITABLE PRESENTATION THEME You can edit the master slides easily. For more info, click here You can delete this slide when you’re done editing the presentation For more info: SLIDESGO | BLOG | FAQs You can visit our sister projects: FREEPIK | FLATICON | STORYSET | WEPIK | VIDEVO
  • 3.
    TABLE OF CONTENTS 01 04 02 05 03 06 INTRODUCTIONBACKGROUND METHODOLOGY RESULTS DISCUSSION CONCLUSION
  • 4.
  • 5.
    WHAT IS AMEDICAL BREAKTHROUGH? A medical breakthrough: ● Represents a significant advancement in the field of medicine ● Challenges conventional medical practices and beliefs ● Holds the potential to revolutionize treatments, improve patient outcomes and save lives In summary, a medical breakthrough can revolutionize medical care and improve patient lives
  • 6.
    CONTEXT INTRODUCTION Provide context andemphasize the importance of addressing the identified challenge. Discuss existing knowledge or approaches, emphasizing the gaps or limitations that hinder progress and drive the need for innovative solutions Clearly state the specific problem or challenge in the medical field. Emphasize its significance and impact, highlighting gaps or limitations in current knowledge or approaches that motivate the need for a breakthrough PROBLEM STATEMENT
  • 7.
    BACKGROUND CURRENT LANDSCAPE EMERGING TRENDS Highlight the currentchallenges and limitations in the medical field that require a breakthrough. Describe the healthcare problems, diseases or conditions that need innovative solutions Focus on emerging medical trends, technologies, or scientific discoveries that present an opportunity for a breakthrough. Discuss the potential benefits, such as more accurate diagnostics or preventive measures Outline a visionary goal for the breakthrough, such as curing a disease or revolutionizing procedures. Highlight the broader impact on healthcare and global quality of life BREAKTHROUGH VISION
  • 8.
    Outline the researchdesign for the medical breakthrough. Describe the type of study, sample size, inclusion criteria and ethical considerations Explain the methods and tools used for data collection, including patient records or examinations. Emphasize data accuracy and patient privacy Describe the approach for analyzing the collected data. Explain the statistical methods or qualitative analysis techniques used to derive meaningful insights Discuss the steps taken to validate the results. Explain how the findings will be reviewed, confirmed or peer- reviewed for scientific rigor METHODOLOGY STUDY DESIGN DATA ANALYSIS DATA COLLECTION RESULTS VALIDATION
  • 9.
    RESULTS Present the analyzeddata from the study. Describe the methods used for analysis and highlight key findings and trends Focus on numerical results derived from the analysis. Present percentages, means or correlations and use visual aids Compare results with existing literature or previous studies. Highlight similarities, differences, and novel insights for knowledge Acknowledge study limitations. Discuss challenges faced during data collection, analysis and interpretation DATA ANALYSIS QUANT. RESULTS QUAL. RESULTS Discuss qualitative findings from interviews or surveys. Present themes, patterns and include examples Summarize the findings and their implications. Discuss the impact on medical practice, patient care or future research COMPARISON LIMITATIONS CONCLUSIONS
  • 10.
    It’s a treatment10 times faster than previous treatments 50% Reduction in complications 10X FASTER 85% Success rate for the breakthrough
  • 11.
    Use percentages inyour breakthrough presentation to quantify and communicate the frequency or proportion of an important finding 95%
  • 12.
    COLUMN CHART UNDERSTANDING THE NUMBERS Usethis slide to present data on the outcomes of patients who have received treatment for a particular condition or disease. A column chart can be an effective way to illustrate changes in patient outcomes over time. Consider including data from clinical trials or real-world patient populations to showcase the impact Follow the link in the graph to modify its data and then paste the new one here. For more info, click here
  • 13.
    MILESTONES Phase II clinicaltrial 05 Phase III clinical trial 06 FDA review 07 Post-market monitoring 08 Discovery 01 Preclinical research 02 Early phase clinical trial 03 Phase I clinical trial 04
  • 14.
    TREATMENT OPTION EFFICACYRATE SIDE EFFECTS COST AVAILABILITY Medication A 80% Mild $$ Widely available Medication B 70% Moderate $$$ Available only with prescription Surgery 90% High $$$$ Requires specialized facilities Radiation therapy 75% Moderate $$ Available in most hospitals Immunotherapy 65% Moderate $$$$ Available only in select medical centers Physical therapy 60% Mild $$ Widely available TREATMENT OPTIONS
  • 15.
    CLINICAL TRIAL PHASES PHASE1: SAFETY AND DOSAGE ● Participants: 20-100 healthy volunteers ● Objective: To determine safe dosage and identify side effects ● Duration: 6 months ● Success rate: 80% of participants completed the trial without experiencing significant side effects PHASE 2: SIDE EFFECTS PHASE 3: LARGE-SCALE TESTING ● Participants: From several hundred to thousands of people with the condition ● Objective: To confirm effectiveness, monitor side effects, and compare to standard treatments ● Duration: 24 months ● Success rate: New treatment was better in 75% cases PHASE 4: POST-MARKET MONITORING ● Participants: Thousands of people with the condition who are taking the drug ● Objective: To monitor long-term safety and effectiveness and detect rare side effects ● Duration: Ongoing ● Success rate: No safety concerns identified in the two years since the approval for market use ● Participants: Up to several hundred people with the condition ● Objective: Determine effectiveness and further evaluate safety ● Duration: 12 months ● Success rate: 65% of participants experienced a significant improvement in symptoms
  • 16.
    DATA AND STATISTICS KEYPERFORMANCE INDICATOR NUMBER Drug discovery 2,500 Alternative energy sources 95% Stem cell Therapy 493 TREND IN PATIENT OUTCOMES ● List the key performance indicators (KPIs) relevant to the medical breakthrough ● Enter the values or metrics for each KPI in the table ● Discuss the significance of each KPI and its relation to the breakthrough ● Highlight any notable achievements or milestones reflected in the table ● Illustrate the trend in patient outcomes over time ● Highlight the impact of the medical breakthrough on patient outcomes ● Describe any significant changes or improvements observed in the graph Follow the link in the graph to modify its data and then paste the new one here. For more info, click here
  • 17.
    IMPLICATIONS —DR. JANE DOE,MEDICAL PROFESSIONAL “It's been a true lifesaver for me. I can enjoy life again without any discomfort” “I've seen a significant improvement in patient outcomes. This breakthrough makes treatment more efficient and personalized” “We are impressed with the safety and effectiveness of this breakthrough. It will greatly benefit patients and healthcare systems” —JOHN SMITH, PATIENT —SANJAY PATEL, REGULATORY BODY REPRESENTATIVE
  • 18.
    KEY MEMBERS MARK JONES Usea sentence that describe their job ROLE: Lead researcher CONTRIBUTIONS: ● You can enter a description of the contributions here ● You can enter a description of the contributions here ● You can enter a description of the contributions here ROLE: Clinical trial manager CONTRIBUTIONS: ● You can enter a description of the contributions here ● You can enter a description of the contributions here ● You can enter a description of the contributions here SARAH JAMES Use a sentence that describe their job
  • 19.
    RESULTS AND CONCLUSIONS BACKGROUND Brieflyintroduce the context of the investigation, such as the medical condition or problem being addressed and the goals STUDY DESIGN Describe the design of the study, such as whether it was a randomized controlled trial or observational study, the sample size and the inclusion and exclusion criteria FINDINGS Summarize the main findings of the investigation, including statistical results and any important trends or patterns observed IMPACT Discuss the implications of the findings for patients, healthcare providers and other stakeholders. You could also mention any potential limitations of the study or areas for future research REFERENCES Include a reference page with the sources used in your presentation. List the sources in alphabetical order and include the author's name, the title of the source, the publication date and the publisher or URL CONCLUSIONS Briefly summarize the main findings of the study or analysis Discuss the implications of the findings and how they relate to the original research question 1 2
  • 20.
    CREDITS: This presentationtemplate was created by Slidesgo, and includes icons by Flaticon and infographics & images by Freepik DO YOU HAVE ANY QUESTIONS? youremail@freepik.com +91 620 421 838 yourwebsite.com THANKS Please keep this slide for attribution
  • 21.
    ALTERNATIVE RESOURCES Here’s anassortment of alternative resources whose style fits the one of this template: VECTORS ● Dna background ● Abstract dna background I ● Abstract dna background II
  • 22.
    RESOURCES Did you likethe resources in this template? Get them for free at our other websites: PHOTOS ● Laboratory team working together ● Doctor performing medical research in lab ● Side view of male researcher in the laboratory looking through microscope ● Medium shot woman in lab ● Front view doctor working at clinic ● Cheerful ethnic medic with papers ● Side view of female researcher in the laboratory with safety glasses VECTORS ● Abstract dna background