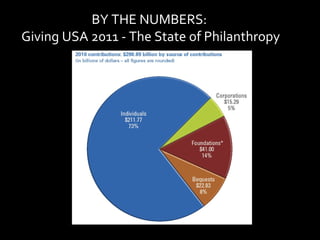
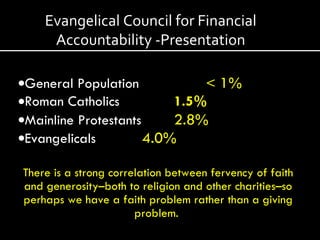
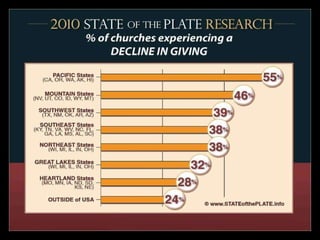
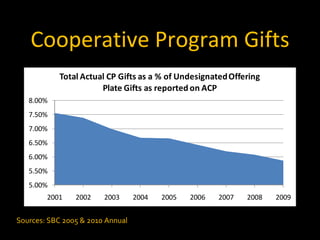
GIVING BY THE NUMBERS “ BIG PICTURE”
BY THE NUMBERS:  Giving USA 2011 - The State of Philanthropy
BY THE NUMBERS:  Giving USA 2011 - The State of Philanthropy 33% in 2009
BY THE NUMBERS:  Giving USA 2011- The State of Philanthropy 2.1%  - 2010 (6.2%) – 2008/2009  (adjusted for inflation)
Per capita giving is low  General Population  <  1%  Roman Catholics  1.5%  Mainline Protestants  2.8%  Evangelicals  4.0% There is a strong correlation between fervency of faith and generosity–both to religion and other charities–so perhaps we have a faith problem rather than a giving problem.  Evangelical Council for Financial Accountability -Presentation
GEORGIA GIVES 2008 Prepared by  The Center on Philanthropy at Indiana University
77.5 %  of GA Households gave to charity 70.2%  of U.S. Households gave to charity $1,840 -  2007 GA Avg Household Gift (including non-donors)  $1,590 -  2007 U.S. Avg Household Gift GA Households gave  13.6%  above U.S. Average) Represented  $5.58  billion Georgia Gives 2008 (2007 Activity) Indiana University Center on Philanthropy
Georgia Gives 2008 (2007 Activity) Indiana University Center on Philanthropy Religion $3,097 55.5%
3.9%  Avg GA Household giving 6.6%  Avg GA Household giving  (Protestant) 7.8%  Avg GA Household giving  (Attend church more than once a week) Georgia Gives 2008 (2007 Activity) Indiana University Center on Philanthropy
Georgia Gives 2008 (2007 Activity) Indiana University Center on Philanthropy 68%
Georgia Gives 2008 (2007 Activity) Indiana University Center on Philanthropy
RECESSION  IMPACT ON CHURCHES & OTHER NONPROFITS
What are other Non-Profits doing? (ECFA 2009 Survey) 41%  have frozen or delayed salary increases  38 %  have frozen or reduced hiring 18%   have laid off staff 11%  have reduced salaries
ECFA Survey, Continued 53%  cut travel and conference expenses 30%  cut or delayed capital projects 27%  have reduced the number or size or programs 21%  have partnered with other organizations to share resources
Maximum Generosity: State of the Plate  (6/10)
SOUTHERN BAPTIST GIVING
GIVING TRENDS? &quot;(c) www.Kluth.org used by permission
Actual Receipts SBC Cooperative Program Allocation Budget
Cooperative Program Gifts Sources: SBC 2005 & 2010 Annual
2011 Budget ? Journey of Faith  –  Crown Financial Ministries Cautious Optimism  – ECFA Yes, but modestly  –  Financial Seminary I don’t know  – Barna Group Watch earnings of Americans  – LifeWay Poor economy is excuse for poor leadership in the area of stewardship and giving .  – Leadership Network Look to God, not economic indicators  – Generosity Monk Scarcity begins to clarify everything  – Generis
Is Your Church Ministry Spending Plan (Budget) Aligned with Scripture ?
MISSION VISION GOALS PLANS BUDGET What is the Ideal?, Inspire -  WHY What do we do? Purpose/Values/Beliefs Where do we want to be? How do we get there? HOW  do we allocate resources? STRATEGIC PLANNING:  ALIGN WITH SCRIPTURE
BIBLE BASED BUDGETING
BUDGETING: &quot;(c) www.Kluth.org used by permission
Seek spiritual direction Consult with church leaders Budget Preparation “ You must have accurate and honest weights and measures  -  Deut. 5:15a BUDGETING:
Seek spiritual direction Consult with church leaders Build congregational acceptance Budget Presentation “ You must have accurate and honest weights and measures  -  Deut. 5:15a BUDGETING:
Budget  PRESENTATION  Models Line Item/Accounting  (Functional) Ministry Action/Based  (Ministry) Missional/Narrative  (Mission) “ You must have accurate and honest weights and measures  -  Deut. 5:15a BUDGETING:
Seek spiritual direction Consult with church leaders Build congregational acceptance Encourage personal commitment “ You must have accurate and honest weights and measures  -  Deut. 5:15a WORKING WITH Budget Committee
WORKING WITH Budget Committee &quot;(c) www.Kluth.org used by permission
Develop your church budget based on a biblical strategy to get your church from your “ You must have accurate and honest weights and measures  -  Deut. 5:15a PERSONAL COMMITMENT Leave room for God to do something miraculous in the hearts of your people MISSION VISION

Bill Townes Presentation

  • 1.
  • 2.
    GIVING BY THENUMBERS “ BIG PICTURE”
  • 3.
    BY THE NUMBERS: Giving USA 2011 - The State of Philanthropy
  • 4.
    BY THE NUMBERS: Giving USA 2011 - The State of Philanthropy 33% in 2009
  • 5.
    BY THE NUMBERS: Giving USA 2011- The State of Philanthropy 2.1% - 2010 (6.2%) – 2008/2009 (adjusted for inflation)
  • 6.
    Per capita givingis low General Population < 1% Roman Catholics 1.5% Mainline Protestants 2.8% Evangelicals 4.0% There is a strong correlation between fervency of faith and generosity–both to religion and other charities–so perhaps we have a faith problem rather than a giving problem. Evangelical Council for Financial Accountability -Presentation
  • 7.
    GEORGIA GIVES 2008Prepared by The Center on Philanthropy at Indiana University
  • 8.
    77.5 % of GA Households gave to charity 70.2% of U.S. Households gave to charity $1,840 - 2007 GA Avg Household Gift (including non-donors) $1,590 - 2007 U.S. Avg Household Gift GA Households gave 13.6% above U.S. Average) Represented $5.58 billion Georgia Gives 2008 (2007 Activity) Indiana University Center on Philanthropy
  • 9.
    Georgia Gives 2008(2007 Activity) Indiana University Center on Philanthropy Religion $3,097 55.5%
  • 10.
    3.9% AvgGA Household giving 6.6% Avg GA Household giving (Protestant) 7.8% Avg GA Household giving (Attend church more than once a week) Georgia Gives 2008 (2007 Activity) Indiana University Center on Philanthropy
  • 11.
    Georgia Gives 2008(2007 Activity) Indiana University Center on Philanthropy 68%
  • 12.
    Georgia Gives 2008(2007 Activity) Indiana University Center on Philanthropy
  • 13.
    RECESSION IMPACTON CHURCHES & OTHER NONPROFITS
  • 14.
    What are otherNon-Profits doing? (ECFA 2009 Survey) 41% have frozen or delayed salary increases 38 % have frozen or reduced hiring 18% have laid off staff 11% have reduced salaries
  • 15.
    ECFA Survey, Continued53% cut travel and conference expenses 30% cut or delayed capital projects 27% have reduced the number or size or programs 21% have partnered with other organizations to share resources
  • 16.
    Maximum Generosity: Stateof the Plate (6/10)
  • 17.
    Maximum Generosity: Stateof the Plate (6/10)
  • 18.
  • 19.
    GIVING TRENDS? &quot;(c)www.Kluth.org used by permission
  • 20.
    Actual Receipts SBCCooperative Program Allocation Budget
  • 21.
    Cooperative Program GiftsSources: SBC 2005 & 2010 Annual
  • 22.
    2011 Budget ?Journey of Faith – Crown Financial Ministries Cautious Optimism – ECFA Yes, but modestly – Financial Seminary I don’t know – Barna Group Watch earnings of Americans – LifeWay Poor economy is excuse for poor leadership in the area of stewardship and giving . – Leadership Network Look to God, not economic indicators – Generosity Monk Scarcity begins to clarify everything – Generis
  • 23.
    Is Your ChurchMinistry Spending Plan (Budget) Aligned with Scripture ?
  • 24.
    MISSION VISION GOALSPLANS BUDGET What is the Ideal?, Inspire - WHY What do we do? Purpose/Values/Beliefs Where do we want to be? How do we get there? HOW do we allocate resources? STRATEGIC PLANNING: ALIGN WITH SCRIPTURE
  • 25.
  • 26.
  • 27.
    Seek spiritual directionConsult with church leaders Budget Preparation “ You must have accurate and honest weights and measures - Deut. 5:15a BUDGETING:
  • 28.
    Seek spiritual directionConsult with church leaders Build congregational acceptance Budget Presentation “ You must have accurate and honest weights and measures - Deut. 5:15a BUDGETING:
  • 29.
    Budget PRESENTATION Models Line Item/Accounting (Functional) Ministry Action/Based (Ministry) Missional/Narrative (Mission) “ You must have accurate and honest weights and measures - Deut. 5:15a BUDGETING:
  • 30.
    Seek spiritual directionConsult with church leaders Build congregational acceptance Encourage personal commitment “ You must have accurate and honest weights and measures - Deut. 5:15a WORKING WITH Budget Committee
  • 31.
    WORKING WITH BudgetCommittee &quot;(c) www.Kluth.org used by permission
  • 32.
    Develop your churchbudget based on a biblical strategy to get your church from your “ You must have accurate and honest weights and measures - Deut. 5:15a PERSONAL COMMITMENT Leave room for God to do something miraculous in the hearts of your people MISSION VISION

Editor's Notes

  • #7 Average GA Household (including non-givers) gave $1,840 versus Median Household income of 46,832 = 3.9% to charity Average GA Household (including only givers) gave $2,340 versus Median household Income of 46,832 = 5% to charity Average GA Household- Protestant – 3,070 versus 46,832 = 6.6% Average GA Household – Attend church more than once a week - $3,652 versus 46,832 = 7.8% Average
  • #9 Average GA Household (including non-givers) gave $1,840 versus Median Household income of 46,832 = 3.9% to charity Average GA Household (including only givers) gave $2,340 versus Median household Income of 46,832 = 5% to charity Average
  • #11 Average GA Household (including non-givers) gave $1,840 versus Median Household income of 46,832 = 3.9% to charity Average GA Household (including only givers) gave $2,340 versus Median household Income of 46,832 = 5% to charity Average GA Household- Protestant – 3,070 versus 46,832 = 6.6% Average GA Household – Attend church more than once a week - $3,652 versus 46,832 = 7.8% Average