SlideShare a Scribd company logo
1 of 7
Aantal uitkeringen ABW,
WWB en WIJ *
*ABW=algemene bijstandswet, WWB=Wet werk en bijstand. WIJ=Wet investeren in jongeren (WIJ).; bron: CBS; bewerking DUX
22800
23850
24040
24280
22430
21470
20950
23200
24330
24400
24550
341490
358690 362950
355010
329380
304710
292340
316570
345240
356280
365270
2002 2003 2004 2005 2006 2007 2008 2009 2010 2011 2012
Limburg Nederland
Top 5 – Meeste aantal uitkeringen Top 5 – Minst aantal uitkeringen
*ABW=algemene bijstandswet, WWB=Wet werk en bijstand. WIJ=Wet investeren in jongeren (WIJ).; bron: CBS; bewerking DUX
Uitkeringen ABW,
WWB en WIJ in 2012*
1900
2460
2480
3350
4370
Kerkrade
Venlo
Sittard-Geleen
Maastricht
Heerlen 70
100
120
130
130
Mook en Middelaar
Nederweert
Gulpen-Wittem
Simpelveld
Voerendaal
Top 5
Percentage totale bevolking
Top 5
Percentage totale bevolking
*ABW=algemene bijstandswet, WWB=Wet werk en bijstand. WIJ=Wet investeren in jongeren (WIJ).; bron: CBS; bewerking DUX
Uitkeringen ABW,
WWB en WIJ in 2012*
2.85%
3.15%
3.38%
4.02%
4.91%
Roermond
Brunssum
Vaals
Kerkrade
Heerlen
0.60%
0.68%
0.71%
0.74%
0.79%
Nederweert
Eijsden-Margraten
Leudal
Peel en Maas
Horst aan de Maas
Ontwikkeling ABW, WWB en WIJ
(percentage totale bevolking)*
*ABW=algemene bijstandswet, WWB=Wet werk en bijstand. WIJ=Wet investeren in jongeren (WIJ).; bron: CBS; bewerking DUX
0.00%
1.00%
2.00%
3.00%
4.00%
5.00%
6.00%
2002 2003 2004 2005 2006 2007 2008 2009 2010 2011 2012
Beek (L.)
Beesel
Bergen (L.)
Brunssum
Echt-Susteren
Eijsden-Margraten
Gennep
Gulpen-Wittem
Heerlen
Horst aan de Maas
Kerkrade
Ontwikkeling ABW, WWB en WIJ
(percentage totale bevolking)*
*ABW=algemene bijstandswet, WWB=Wet werk en bijstand. WIJ=Wet investeren in jongeren (WIJ).; bron: CBS; bewerking DUX
0.00%
0.50%
1.00%
1.50%
2.00%
2.50%
3.00%
3.50%
2002 2003 2004 2005 2006 2007 2008 2009 2010 2011 2012
Landgraaf
Leudal
Maasgouw
Maastricht
Meerssen
Mook en Middelaar
Nederweert
Nuth
Onderbanken
Peel en Maas
Roerdalen
Ontwikkeling ABW, WWB en WIJ
(percentage totale bevolking)*
*ABW=algemene bijstandswet, WWB=Wet werk en bijstand. WIJ=Wet investeren in jongeren (WIJ).; bron: CBS; bewerking DUX
0.00%
0.50%
1.00%
1.50%
2.00%
2.50%
3.00%
3.50%
4.00%
2002 2003 2004 2005 2006 2007 2008 2009 2010 2011 2012
Roermond
Schinnen
Simpelveld
Sittard-Geleen
Stein (L.)
Vaals
Valkenburg aan de Geul
Venlo
Venray
Voerendaal
Weert
Top 5 Limburgse gemeente
Percentage van de bevolking met een bijstandsuitkering
*ABW (=algemene bijstandswet,) WWB (=Wet werk en bijstand) en WIJ (=Wet investeren in jongeren ); bron: CBS; bewerking DUX
4,9% van de Heerlenaren ontving een
bijstandsuitkering in 2012*
2.9%
3.2%
3.4%
4.0%
4.9%
Roermond
Brunssum
Vaals
Kerkrade
Heerlen
1900
24602480
3350
4370
KerkradeVenloSittard-GeleenMaastrichtHeerlen
Aantal bijstandsuitkeringen in
Limburgse top 5 gemeenten
24.550 bijstandsuitkeringen
in Limburg in 2012

More Related Content

Featured

How Race, Age and Gender Shape Attitudes Towards Mental Health
How Race, Age and Gender Shape Attitudes Towards Mental HealthHow Race, Age and Gender Shape Attitudes Towards Mental Health
How Race, Age and Gender Shape Attitudes Towards Mental Health
ThinkNow
 
Social Media Marketing Trends 2024 // The Global Indie Insights
Social Media Marketing Trends 2024 // The Global Indie InsightsSocial Media Marketing Trends 2024 // The Global Indie Insights
Social Media Marketing Trends 2024 // The Global Indie Insights
Kurio // The Social Media Age(ncy)
 

Featured (20)

2024 State of Marketing Report – by Hubspot
2024 State of Marketing Report – by Hubspot2024 State of Marketing Report – by Hubspot
2024 State of Marketing Report – by Hubspot
 
Everything You Need To Know About ChatGPT
Everything You Need To Know About ChatGPTEverything You Need To Know About ChatGPT
Everything You Need To Know About ChatGPT
 
Product Design Trends in 2024 | Teenage Engineerings
Product Design Trends in 2024 | Teenage EngineeringsProduct Design Trends in 2024 | Teenage Engineerings
Product Design Trends in 2024 | Teenage Engineerings
 
How Race, Age and Gender Shape Attitudes Towards Mental Health
How Race, Age and Gender Shape Attitudes Towards Mental HealthHow Race, Age and Gender Shape Attitudes Towards Mental Health
How Race, Age and Gender Shape Attitudes Towards Mental Health
 
AI Trends in Creative Operations 2024 by Artwork Flow.pdf
AI Trends in Creative Operations 2024 by Artwork Flow.pdfAI Trends in Creative Operations 2024 by Artwork Flow.pdf
AI Trends in Creative Operations 2024 by Artwork Flow.pdf
 
Skeleton Culture Code
Skeleton Culture CodeSkeleton Culture Code
Skeleton Culture Code
 
PEPSICO Presentation to CAGNY Conference Feb 2024
PEPSICO Presentation to CAGNY Conference Feb 2024PEPSICO Presentation to CAGNY Conference Feb 2024
PEPSICO Presentation to CAGNY Conference Feb 2024
 
Content Methodology: A Best Practices Report (Webinar)
Content Methodology: A Best Practices Report (Webinar)Content Methodology: A Best Practices Report (Webinar)
Content Methodology: A Best Practices Report (Webinar)
 
How to Prepare For a Successful Job Search for 2024
How to Prepare For a Successful Job Search for 2024How to Prepare For a Successful Job Search for 2024
How to Prepare For a Successful Job Search for 2024
 
Social Media Marketing Trends 2024 // The Global Indie Insights
Social Media Marketing Trends 2024 // The Global Indie InsightsSocial Media Marketing Trends 2024 // The Global Indie Insights
Social Media Marketing Trends 2024 // The Global Indie Insights
 
Trends In Paid Search: Navigating The Digital Landscape In 2024
Trends In Paid Search: Navigating The Digital Landscape In 2024Trends In Paid Search: Navigating The Digital Landscape In 2024
Trends In Paid Search: Navigating The Digital Landscape In 2024
 
5 Public speaking tips from TED - Visualized summary
5 Public speaking tips from TED - Visualized summary5 Public speaking tips from TED - Visualized summary
5 Public speaking tips from TED - Visualized summary
 
ChatGPT and the Future of Work - Clark Boyd
ChatGPT and the Future of Work - Clark Boyd ChatGPT and the Future of Work - Clark Boyd
ChatGPT and the Future of Work - Clark Boyd
 
Getting into the tech field. what next
Getting into the tech field. what next Getting into the tech field. what next
Getting into the tech field. what next
 
Google's Just Not That Into You: Understanding Core Updates & Search Intent
Google's Just Not That Into You: Understanding Core Updates & Search IntentGoogle's Just Not That Into You: Understanding Core Updates & Search Intent
Google's Just Not That Into You: Understanding Core Updates & Search Intent
 
How to have difficult conversations
How to have difficult conversations How to have difficult conversations
How to have difficult conversations
 
Introduction to Data Science
Introduction to Data ScienceIntroduction to Data Science
Introduction to Data Science
 
Time Management & Productivity - Best Practices
Time Management & Productivity -  Best PracticesTime Management & Productivity -  Best Practices
Time Management & Productivity - Best Practices
 
The six step guide to practical project management
The six step guide to practical project managementThe six step guide to practical project management
The six step guide to practical project management
 
Beginners Guide to TikTok for Search - Rachel Pearson - We are Tilt __ Bright...
Beginners Guide to TikTok for Search - Rachel Pearson - We are Tilt __ Bright...Beginners Guide to TikTok for Search - Rachel Pearson - We are Tilt __ Bright...
Beginners Guide to TikTok for Search - Rachel Pearson - We are Tilt __ Bright...
 

Bijstandcijfers van de provincie Limburg

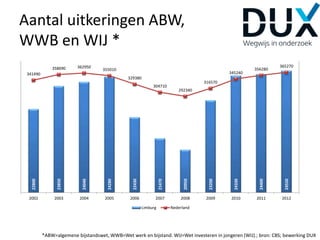
  • 1. Aantal uitkeringen ABW, WWB en WIJ * *ABW=algemene bijstandswet, WWB=Wet werk en bijstand. WIJ=Wet investeren in jongeren (WIJ).; bron: CBS; bewerking DUX 22800 23850 24040 24280 22430 21470 20950 23200 24330 24400 24550 341490 358690 362950 355010 329380 304710 292340 316570 345240 356280 365270 2002 2003 2004 2005 2006 2007 2008 2009 2010 2011 2012 Limburg Nederland
  • 2. Top 5 – Meeste aantal uitkeringen Top 5 – Minst aantal uitkeringen *ABW=algemene bijstandswet, WWB=Wet werk en bijstand. WIJ=Wet investeren in jongeren (WIJ).; bron: CBS; bewerking DUX Uitkeringen ABW, WWB en WIJ in 2012* 1900 2460 2480 3350 4370 Kerkrade Venlo Sittard-Geleen Maastricht Heerlen 70 100 120 130 130 Mook en Middelaar Nederweert Gulpen-Wittem Simpelveld Voerendaal
  • 3. Top 5 Percentage totale bevolking Top 5 Percentage totale bevolking *ABW=algemene bijstandswet, WWB=Wet werk en bijstand. WIJ=Wet investeren in jongeren (WIJ).; bron: CBS; bewerking DUX Uitkeringen ABW, WWB en WIJ in 2012* 2.85% 3.15% 3.38% 4.02% 4.91% Roermond Brunssum Vaals Kerkrade Heerlen 0.60% 0.68% 0.71% 0.74% 0.79% Nederweert Eijsden-Margraten Leudal Peel en Maas Horst aan de Maas
  • 4. Ontwikkeling ABW, WWB en WIJ (percentage totale bevolking)* *ABW=algemene bijstandswet, WWB=Wet werk en bijstand. WIJ=Wet investeren in jongeren (WIJ).; bron: CBS; bewerking DUX 0.00% 1.00% 2.00% 3.00% 4.00% 5.00% 6.00% 2002 2003 2004 2005 2006 2007 2008 2009 2010 2011 2012 Beek (L.) Beesel Bergen (L.) Brunssum Echt-Susteren Eijsden-Margraten Gennep Gulpen-Wittem Heerlen Horst aan de Maas Kerkrade
  • 5. Ontwikkeling ABW, WWB en WIJ (percentage totale bevolking)* *ABW=algemene bijstandswet, WWB=Wet werk en bijstand. WIJ=Wet investeren in jongeren (WIJ).; bron: CBS; bewerking DUX 0.00% 0.50% 1.00% 1.50% 2.00% 2.50% 3.00% 3.50% 2002 2003 2004 2005 2006 2007 2008 2009 2010 2011 2012 Landgraaf Leudal Maasgouw Maastricht Meerssen Mook en Middelaar Nederweert Nuth Onderbanken Peel en Maas Roerdalen
  • 6. Ontwikkeling ABW, WWB en WIJ (percentage totale bevolking)* *ABW=algemene bijstandswet, WWB=Wet werk en bijstand. WIJ=Wet investeren in jongeren (WIJ).; bron: CBS; bewerking DUX 0.00% 0.50% 1.00% 1.50% 2.00% 2.50% 3.00% 3.50% 4.00% 2002 2003 2004 2005 2006 2007 2008 2009 2010 2011 2012 Roermond Schinnen Simpelveld Sittard-Geleen Stein (L.) Vaals Valkenburg aan de Geul Venlo Venray Voerendaal Weert
  • 7. Top 5 Limburgse gemeente Percentage van de bevolking met een bijstandsuitkering *ABW (=algemene bijstandswet,) WWB (=Wet werk en bijstand) en WIJ (=Wet investeren in jongeren ); bron: CBS; bewerking DUX 4,9% van de Heerlenaren ontving een bijstandsuitkering in 2012* 2.9% 3.2% 3.4% 4.0% 4.9% Roermond Brunssum Vaals Kerkrade Heerlen 1900 24602480 3350 4370 KerkradeVenloSittard-GeleenMaastrichtHeerlen Aantal bijstandsuitkeringen in Limburgse top 5 gemeenten 24.550 bijstandsuitkeringen in Limburg in 2012