SlideShare a Scribd company logo
Big Data, Big Ruse
                                        Stephen Few, Perceptual Edge
                                    Visual Business Intelligence Newsletter
                                         July/August/September 2012


If you’re like me, the mere mention of Big Data now turns your stomach. Nearly every business intelligence (BI)
vendor, publication, and event has Big Data flashing in neon colors in Times Square dimensions. Never before
have I seen an idea in the BI space elicit this much obsession. Why all the fuss? Why, indeed. Essentially, Big
Data is a marketing campaign, pure and simple.


For many years now we’ve been told that we’re living in the Information Age. As more data and the
technologies that process it surround us, we’re told that we now work smarter and more efficiently, but
experience says otherwise. We blame the failure on ourselves. “Why do I feel buried and confused when I’m
supposed to feel empowered? Something must be wrong with me! I’m not smart enough. I’m technologically
inept.” Vendors tap into this anxiety and milk it for all its worth. Big Data is just the latest carrot that they’re
tauntingly dangling to keep us chasing a fantasy. While we breathlessly struggle to gain our feet, they count
their money and laugh.

Every few years the BI revenue stream begins to dry up a bit and the marketing folks come up with a new
promise of information nirvana. Some of these enticements are constantly recycled, like “self-service BI,”
which gets trotted out with every new software release, hoping we’ll forget that the same promise was made
but never fulfilled last time. Big Data is just the new rallying cry for the same old stuff BI companies have been
producing all along. Yeah, I know that they’re enlarging storage capacities and improving processing times, but
that’s hardly new. Data didn’t suddenly get big, I’ve been working in information technology for 30 years and
data has always been big. The amount of data that we were generating back then was already increasing at an
exponential rate. What’s going on now is just more of the same. And all along, as the mounds of data continue
to bury us, we make little progress in the only thing that matters: doing something useful with data. That’s
because we’ve been going about it all wrong.

Copyright © 2012 Stephen Few, Perceptual Edge                                                                Page 1 of 8
Edna St. Vincent Millay wrote a poem titled “Huntsman, What Quarry” back in the year 1939 that addressed the
question of Big Data:

    Upon this gifted age, in its dark hour,
    rains from the sky a meteoric shower
    of facts…they lie, unquestioned, uncombined.
    Wisdom enough to leach us of our ill
    is daily spun; but there exists no loom
    to weave it into a fabric.

Even before the advent of computers the world was struggling with the effects of too much data. All those facts
are not only meaningless, they’re oppressive, until we learn how to question them and to connect the dots into
something meaningful, weaving them into the fabric of understanding. Here we are today, living in the so-called
Information Age, and yet we have made little progress. We’re still looking for the loom because we’ve been
looking in the wrong places.

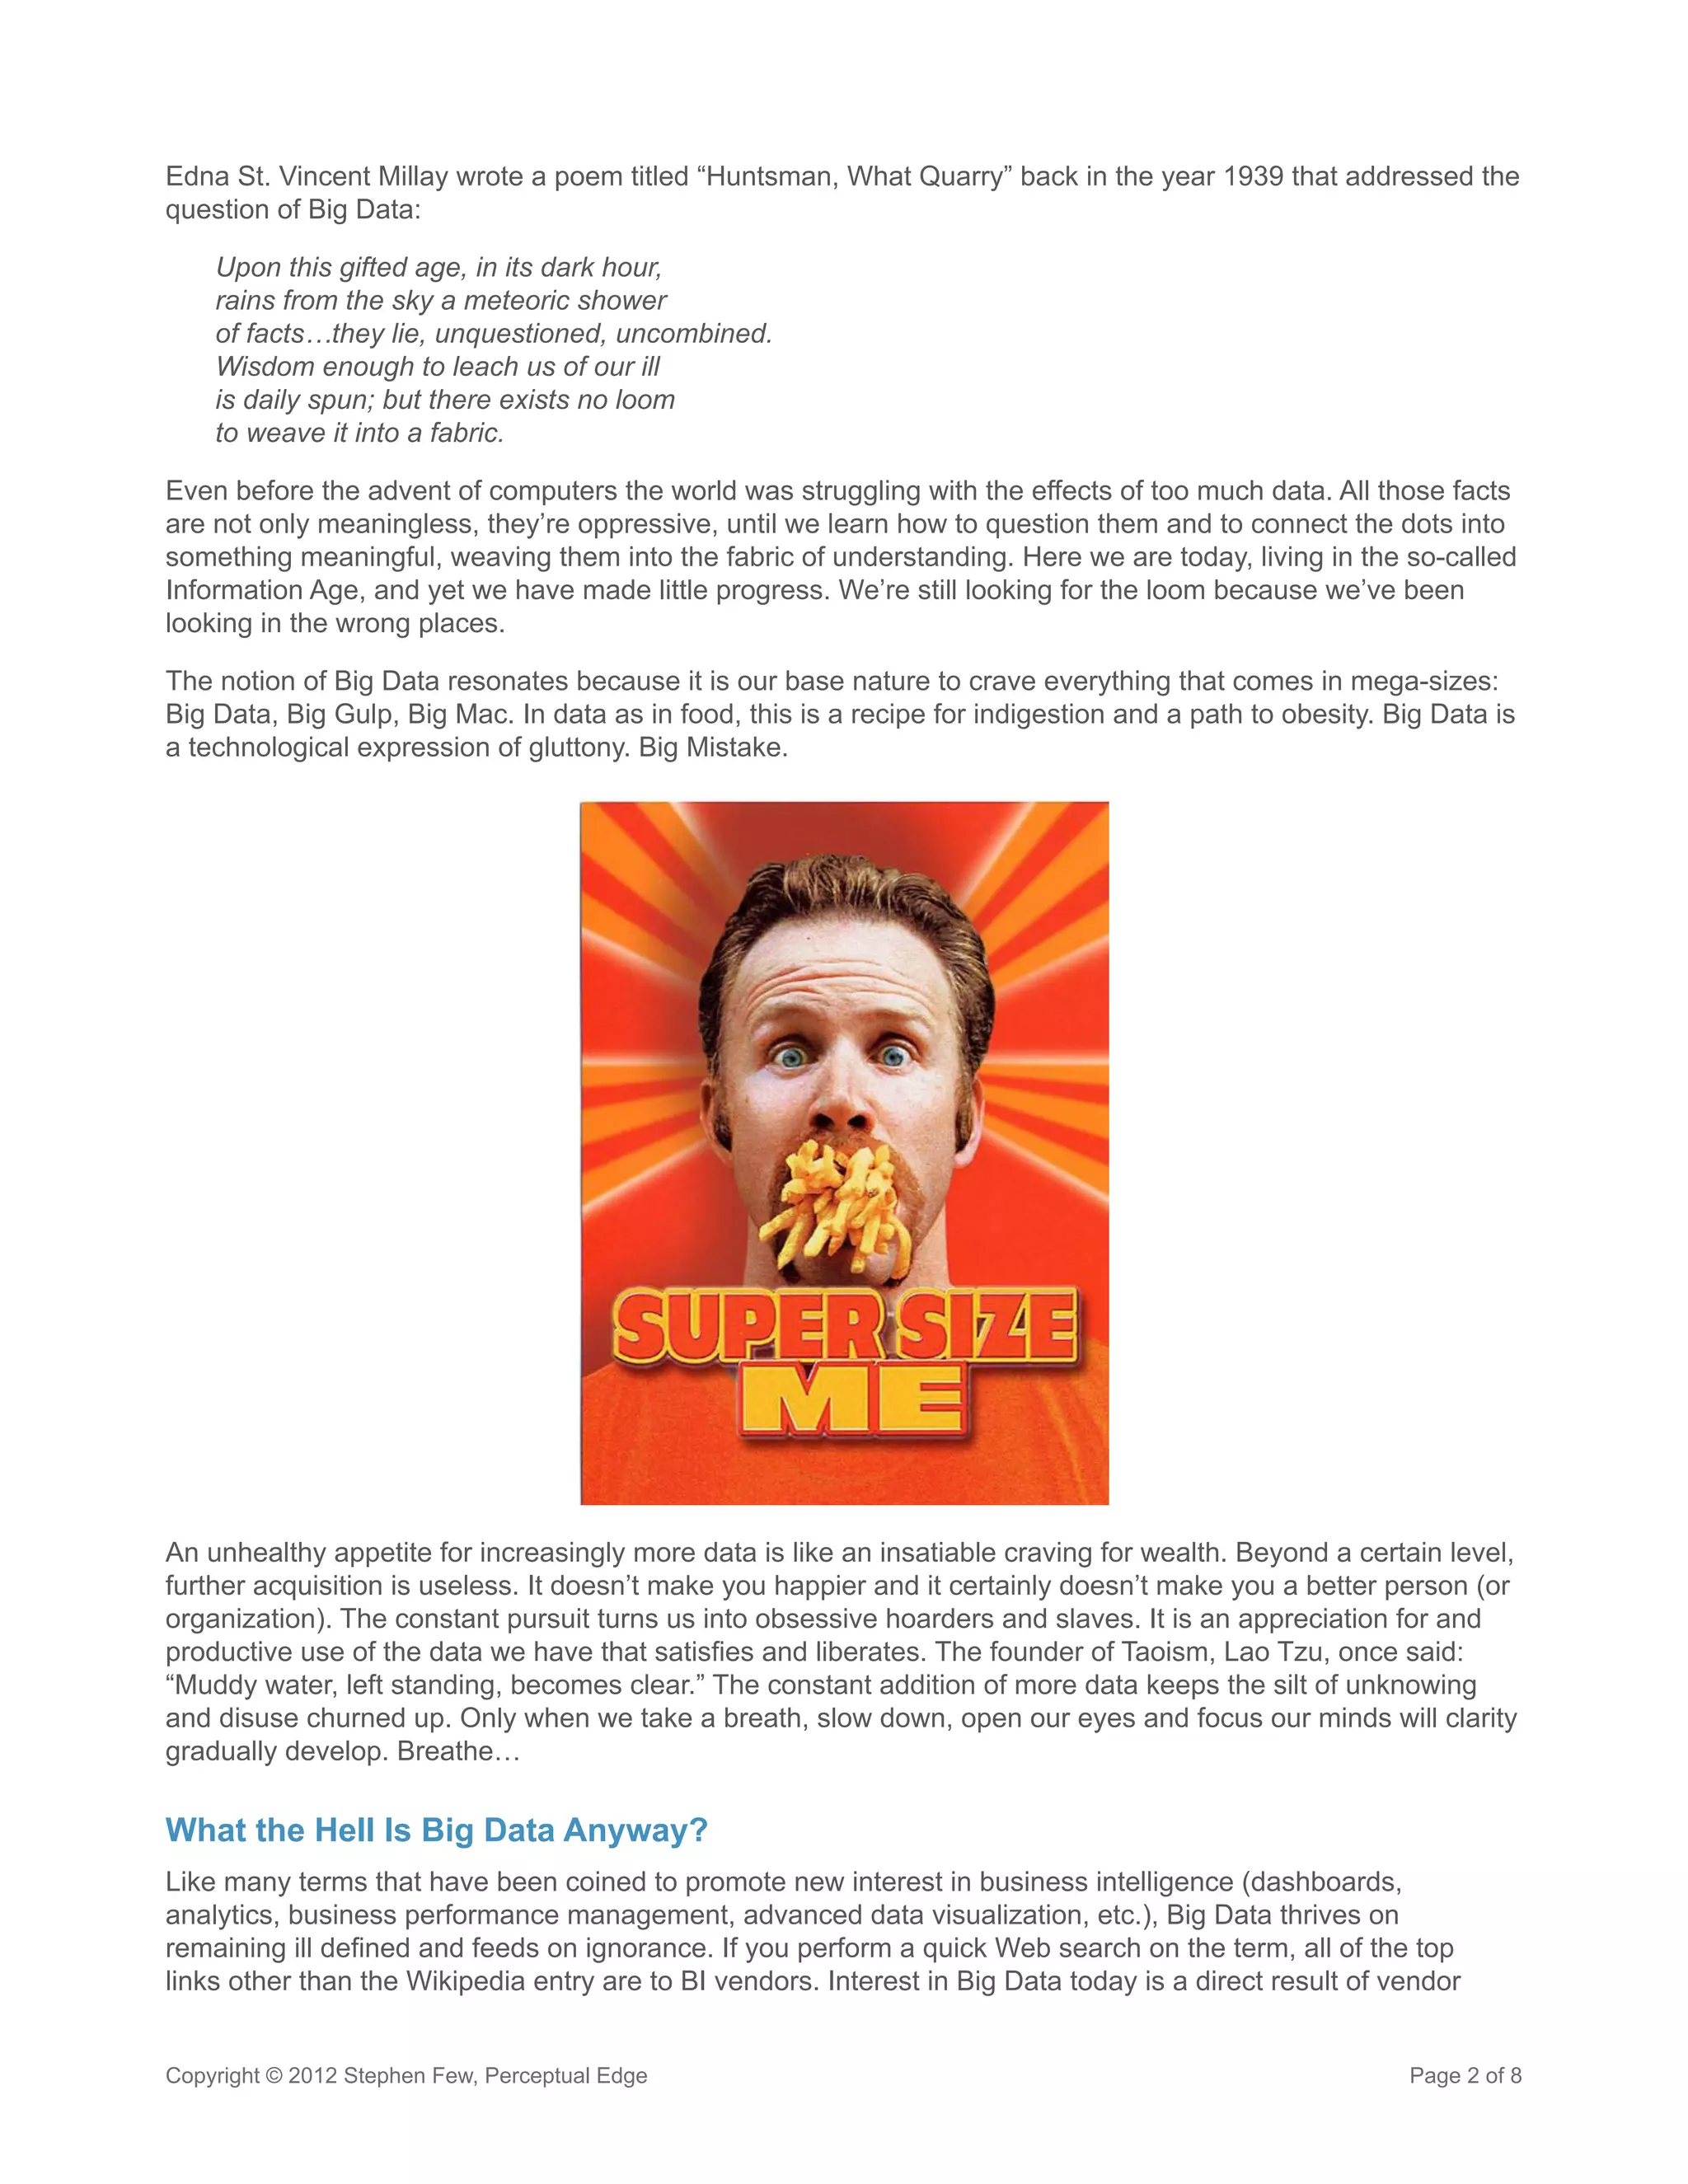
The notion of Big Data resonates because it is our base nature to crave everything that comes in mega-sizes:
Big Data, Big Gulp, Big Mac. In data as in food, this is a recipe for indigestion and a path to obesity. Big Data is
a technological expression of gluttony. Big Mistake.


An unhealthy appetite for increasingly more data is like an insatiable craving for wealth. Beyond a certain level,
further acquisition is useless. It doesn’t make you happier and it certainly doesn’t make you a better person (or
organization). The constant pursuit turns us into obsessive hoarders and slaves. It is an appreciation for and
productive use of the data we have that satisfies and liberates. The founder of Taoism, Lao Tzu, once said:
“Muddy water, left standing, becomes clear.” The constant addition of more data keeps the silt of unknowing
and disuse churned up. Only when we take a breath, slow down, open our eyes and focus our minds will clarity
gradually develop. Breathe…

What the Hell Is Big Data Anyway?
Like many terms that have been coined to promote new interest in business intelligence (dashboards,
analytics, business performance management, advanced data visualization, etc.), Big Data thrives on
remaining ill defined and feeds on ignorance. If you perform a quick Web search on the term, all of the top
links other than the Wikipedia entry are to BI vendors. Interest in Big Data today is a direct result of vendor


Copyright © 2012 Stephen Few, Perceptual Edge                                                             Page 2 of 8
marketing; it didn’t emerge naturally from the needs of users. Some of the claims about big data are little more
than self-serving fantasies that are meant to inspire big revenues for companies that play in this space. Here’s
an example from McKinsey Global Institute (MGI):

    MGI studied big data in five domains—healthcare in the United States, the public sector in Europe,
    retail in the United States, and manufacturing and personal-location data globally. Big data can
    generate value in each. For example, a retailer using big data to the full could increase its operating
    margin by more than 60 percent. Harnessing big data in the public sector has enormous potential,
    too. If US healthcare were to use big data creatively and effectively to drive efficiency and quality, the
    sector could create more than $300 billion in value every year. Two-thirds of that would be in the form
    of reducing US healthcare expenditure by about 8 percent. In the developed economies of Europe,
    government administrators could save more than €100 billion ($149 billion) in operational efficiency
    improvements alone by using big data, not including using big data to reduce fraud and errors and
    boost the collection of tax revenues. And users of services enabled by personal-location data could
    capture $600 billion in consumer surplus.

If you’re willing to put your trust in claims such as a 60% increase in operating margin, a $300 billion annual
increase in value, an 8% reduction in expenditures, and a $600 billion consumer surplus, don’t embarrass
yourself by trying to quantify these benefits after spending millions of dollars on Big Data technologies. You’d
likely fail. You needn’t worry, though, because almost no one actually bothers to measure the outcomes of
business intelligence investments. Using data more effectively can indeed lead to great benefits, including
those that are measured in monetary terms, but these benefits can’t be quantified in the manner, to the degree,
or with the precision that McKinsey suggests.

When I ask representatives of BI vendors what they mean by big data, two characteristics dominate their
definitions:

         1.	 New data sources: These consist primarily of unstructured data sources, such as text-based
             information related to social media, and new sources of transactional data, such as from sensors.
         2.	 Increased data volume: Data, data everywhere, in massive quantities.

Collecting data from new sources rarely introduces data of a new nature; it just adds more of the same. For
example, even if new types of sensors measure something that we’ve never measured before, a measurement
is a measurement—it isn’t a new type of data that requires special handling. What about all of those new
sources of unstructured data, such as that generated by social media (Twitter and its cohorts)? Don’t these
unstructured sources require new means of data analysis? They may require improved means of data
collection, storage, and search, but rarely new means of data sensemaking. We collect data about things,
events, and measured observations. This is true whether we’re collecting sales data, measurements from new
sensors, or data about human behavior on the Web or sentiment in Twitter.

Do greater volumes of data represent a qualitative rather than merely a quantitative difference in our use of
data? Jorge Camoes of ExcelCharts.com recently argued in my blog that they do by quoting the dictum “an
order of magnitude quantitative change is a qualitative change.” Faster processing speeds that are required
by increased quantities of data sometimes require radically new programming algorithms. Perhaps significant
departures of this type from past methods qualify as qualitative changes, but this is business as usual.
Today’s increases in data volumes are driving programming innovations just as they have in the past. Do
these changes directly affect the ways that we interact with data to explore and make sense of it resulting in a
qualitative shift? Not that I’ve noticed.

Camoes went on to describe the change that he believes is necessary:

    You must train people, perhaps hire some statisticians. Make more scatterplots and fewer pie charts.
    Summarize the data, find complex relationships, add alerts, be prepared to react to outliers in a timely
    manner.


Copyright © 2012 Stephen Few, Perceptual Edge                                                             Page 3 of 8
These steps are indeed necessary. In fact, these changes are in lock step with the case that I’m making.
Where Camoes and I differ is that I don’t see these changes as the result of Big Data. These changes have
been needed all along.

Matthew O’Kane recently described in my blog the following advantages of Big Data:

    The main driver of benefit is when predictive analytics is improved through the use of more varied
    and deeper data sets. It is this area where new techniques are required because the tried and tested
    regressions and decision trees won’t cut it any more.

Is it true that predictive analytics have suffered from insufficient quantities of data? Perhaps in some cases, but
I don’t think this is a fundamental problem plaguing predictive analytics. I think the bigger problem is that fact
that few people have been sufficiently trained in statistics to build meaningful predictive models. This problem
has existed all along.

Do You Need Big Data?
Big data is built on the unquestioned premise that more is better. The success of BI, however, cannot be
measured in petabytes or any other unit of data volume. It must be measured in our increased ability to
understand data and then make better decisions based on that understanding. More of the right data can
be useful, but more for the mere sake of more will only complicate our lives. In the words of the 21st Century
Information Fluency Project, we live in a time of “infowhelm.” Just because you can generate and collect more
and more data doesn’t mean you should. You could record data about every blink of your eyes, but would that
be useful? Unless you’re a scientist studying eye blinking, the answer is probably, “No.” Until you’ve figured out
how to use the data that you already have, collecting more will only distract you from the real task. Time spent
collecting more data is time that could be better spent weaving it into something meaningful.

This seems obvious, but almost no attention is being given to building the skills and technologies that help us
glean insights from data more effectively. As Richards J. Heuer, Jr. argued in the Psychology of Intelligence
Analysis (1999), the primary failures of analysis are less due to insufficient data than to flawed thinking. To
succeed analytically, we must invest a great deal more of our resources in training people to think effectively
and we must equip them with tools that support that effort. Heuer spent 45 years supporting the work of the
CIA. Identifying a potential terrorist plot requires an analyst to sift through a lot of data (perhaps Big Data), but
more importantly, it relies on their ability to connect the dots. Contrary to Heuer’s emphasis on thinking skills,
big data is merely about more, more, more; not smarter or better.

Does Big Data Affect Data Visualization?
In a recent article in CRN titled “Big Data Demands: The Heightened Need for Advanced Data Visualization”
(ADV), Rick Whiting makes an uninformed argument. The fact that Whiting quotes “The Forrester Wave:
Advanced Data Visualization, Q3 2012” report (several pages of utter nonsense) as his primary source
exposes this as a sad case of the blind leading the blind. The article includes insights such as “In today’s
fast-paced ‘big data’ world, static bar charts and pie charts just don’t cut it.” While it is true that static charts of
any type don’t cut it for data sensemaking, this was true long before the advent of Big Data. And then there’s
the plug for the kind of nonsense that BI vendors have been foisting on their customers for years: “Analytical
results can be displayed in a three-dimensional graph” and “a series of ‘cockpit gauges’.” This is what they
call “advanced data visualization”! And the crux of the argument is that “the need for these new-generation
data visualization tools is being driven by the explosion of ‘big data’.” In truth, there is no need whatsoever for
the horrible data visualization products that most BI vendors sell. The need that exists for the few good data
visualization products that are available today is not being driven by Big Data, but by the same need that has
existed all along: to understand data, no matter what its size.

Do new sources of data really require new means of visualization? If so, it isn’t obvious. Consider unstructured
social networking data. This information must be structured before it can be visualized, and once it’s structured,
we can visualize it in familiar ways. Want to know what people are talking about on Twitter? To answer this
question, you search for particular words and phrases that you’ve tied to particular topics and you count


Copyright © 2012 Stephen Few, Perceptual Edge                                                                   Page 4 of 8
their occurrences. Once it’s structured in this way, you can visualize it simply, such as by using a bar graph
with a bar for each topic sized by the number of occurrences in ranked order from high to low. If you want to
know who’s talking to whom in an email system or what’s linked to what on your Web site, you glean those
interactions from your email or Web server and count them. Because these interactions are structured as a
network of connections (i.e., not a linear or hierarchical arrangement), you can visualize them as a network
diagram: an arrangement of nodes and links. Nodes can be sized to indicate popular people or content and
links (i.e., lines that connect the nodes) can vary in thickness to show the volume of interactions between
particular pairs of nodes. Never used nodes and links to visualize, explore, and make sense of a network of
relationships? This might be new to you, but it’s been around for many years and information visualization
researchers have studied the hell out of it.

What about exponentially increasing data volumes? Does this have an effect on data visualization? Not
significantly. In my 30 years of experience using technology to squeeze meaning and usefulness from data,
data volumes have always been big. When wasn’t there more data than we could handle? Although it is true
that the volume of data continues to grow at an increasing rate, did it cross some threshold in the last few years
that has made it qualitatively different from before? I don’t think so. The ability of technology to adequately
store and access data has always remained just a little behind what we’d like to have in capacity and
performance. A little more and a little faster have always been on our wish list. While information technology
has struggled to catch up, mostly by pumping itself up with steroids, it has lost sight of the objective: to better
understand the world—at least one’s little part of it (e.g., one’s business)—so we can make it better. Our
current fascination with big data has us looking for better steroids to increase our brawn rather than better skills
to develop our brains. In the world of analytics, brawn will only get us so far; only better thinking that will open
the door to greater insight.

Is there anything new about data today, big or otherwise, that should be leading us to visualize it differently?
I was asked to think about this recently when advising a software vendor that is trying to develop powerful
visualization solutions specifically for managing Big Data. After wracking my brain, I came up with nothing new.
Almost everything that we should be doing to support the visual exploration, analysis, and presentation of data
today involves better implementations of visualizations, statistical calculations, and data interactions that we’ve
known about for years. Even though these features are old news, they still aren’t readily available in most
commercial software today; certainly not in ways that work well. Rather than “going to where no one has gone
before,” vendors need to do the less glorious work of supporting the basics well and data analysts need to
deepen their data sensemaking skills.

Will Data Save Us?
There’s a nasty world out there filled with injustice and suffering, but data won’t save us; not even Big Data.
Information is valuable only when we use it to do something worthwhile. We’re the protagonists in this story;
information is only a resource.

I had breakfast recently with a fellow who works as a computer security expert. He helps organizations identify,
track, and prevent cybercrime. What inspires him to get up each morning? He has a chance to catch the “bad
guys.” He uses his skills, honed through experience, to examine information in an effort to identify the bad guys
and put them behind bars. He makes this happen, not data.

I also had dinner not long ago with an executive of a good visual analytics software company—one of the few.
While we were enjoying a nice bottle of Italian wine, he described the excitement of fellow employees at his
company. At one point he said, “There’s a source of inspiration that everyone at the company seems to share.
Can you guess what that is?” I guessed, “The joy of working for a company that produces software that actually
works?” “That’s certainly one source of inspiration,” he said, “but the one that’s even more infectious is the
belief that their work is helping to make the world a better place.” A deep feeling of satisfaction silenced me for
a moment. This group of software engineers, designers, salespeople, and yes, even marketing folks, wake up
each morning and greet the day with the belief that their work matters, that the products they make are being
used for good. That’s priceless. Employees of every product maker or service provider should be able to start
their days with this sense of purpose. Unfortunately, this is rare. It is certainly rare among employees of BI
companies.


Copyright © 2012 Stephen Few, Perceptual Edge                                                             Page 5 of 8
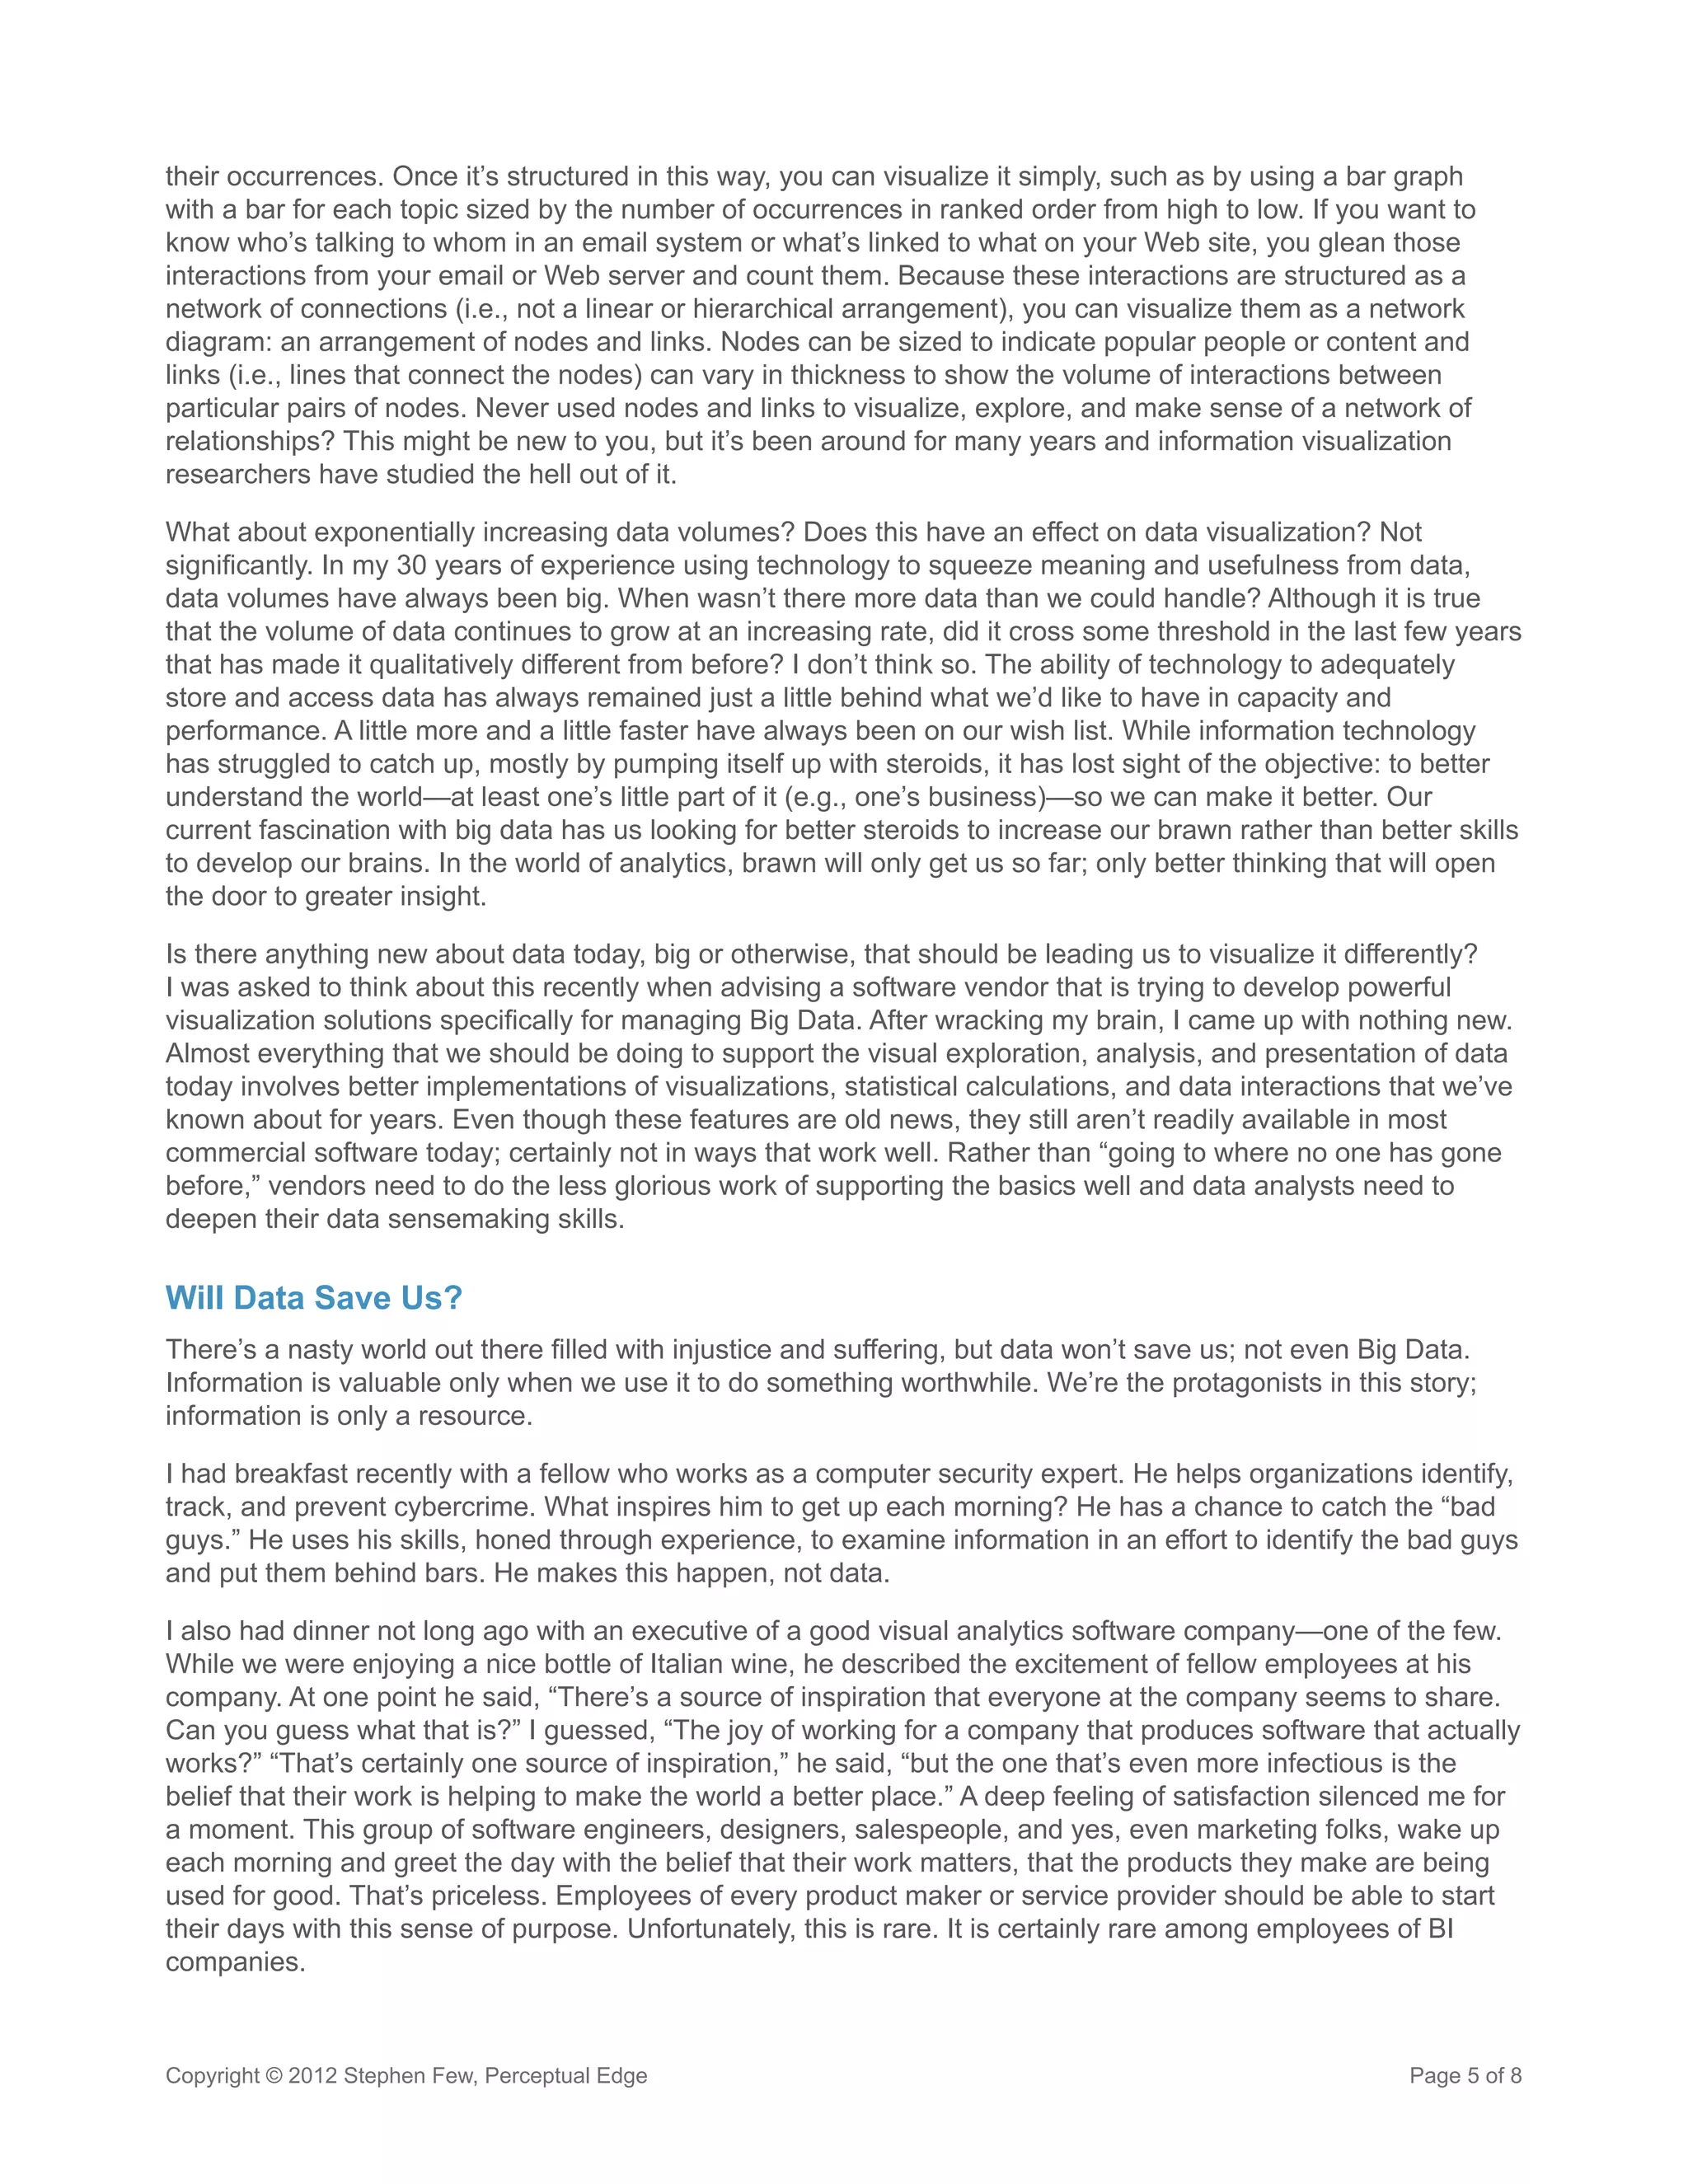
A few months ago I gave a keynote presentation and taught a course at the Teradata Universe conference in
Dublin, Ireland. At one point while wandering through the Dublin Convention Center I read the following banner:


This was one of many banners that were strategically placed throughout the convention center to promote
the conference by highlighting the importance of data. Upon reading the words of FedEx CEO Fred Smith,
I suddenly realized why my packages sometimes arrive damaged. The information about the package is as
important to FedEx as the package itself. Seriously? In our enthusiasm for data and information technology,
let’s not lose perspective. Information is only important when it informs us meaningfully about something that
actually exists in the world and that has value. Information about my package is only important if it gets that
package to me intact. The information derives its value from the package. Information has no value in and of
itself.

BI, as I see it, is about asking the following three questions about information:

         1.	 What does it mean?
         2.	 Why does it matter? (Not “Does it matter?” because it’s too tempting to respond “Yes” without really
             understanding why.)
         3.	 How then should we respond?

The value of information and the success of business intelligence should be measured in terms of useful
outcomes. Did your understanding increase (i.e., did you figure out what the information means)? If so, did
that understanding relate to things that matter (i.e., did you determine how that understanding could make a
positive difference)? If so, did that understanding produce better decisions and actions (i.e., did you choose
and then take a course of action that produced the desired effect)? Only when you can answer “Yes” to each of
these questions was the information and the technology that helped you understand it worthwhile.

Most BI companies want you to believe that your problems can be solved by collecting and storing more data.
They don’t encourage you to first understand and then use the data that you already have. Why? Because
they only know how to build and sell you products for collecting and storing data and for accessing data at high
speeds. They don’t know how to help you make sense and use of data in meaningful ways. They want you to
desire and buy what they sell, not to recognize and demand what you actually need.

Copyright © 2012 Stephen Few, Perceptual Edge                                                           Page 6 of 8
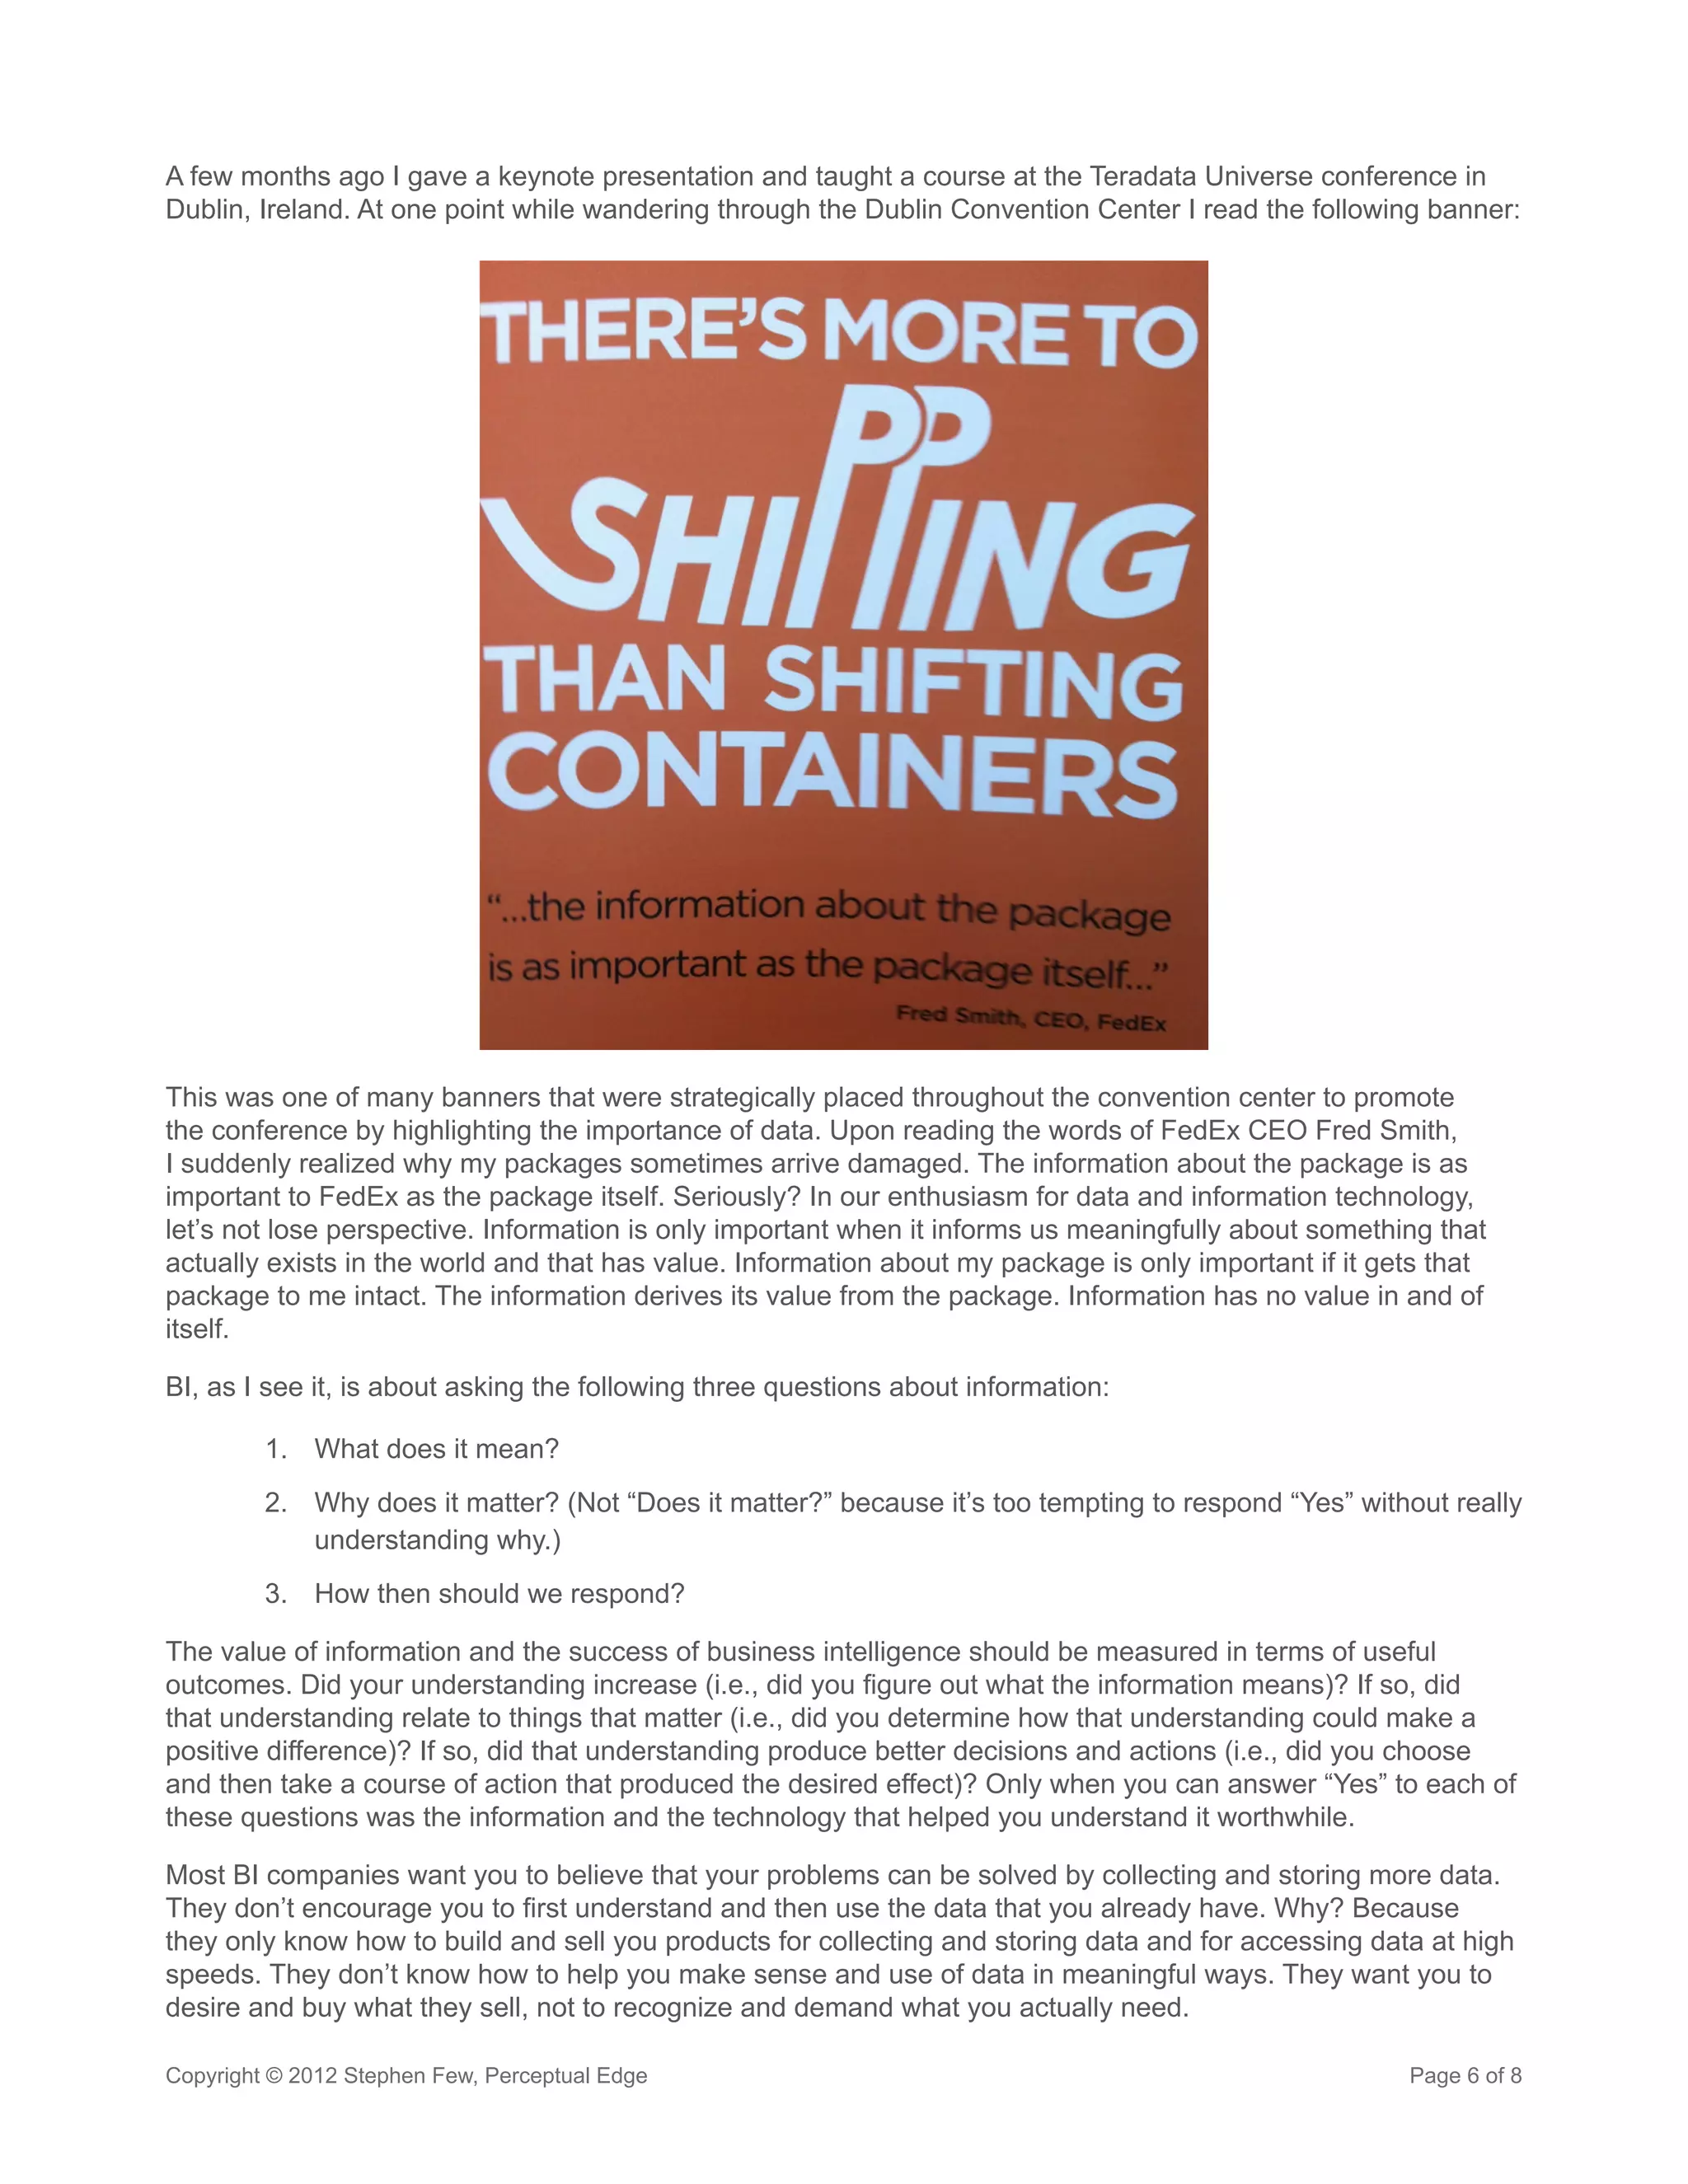
Business intelligence has always put the cart before the horse—the technology (tools) before the users (human
beings) and their goals. It is now piling data into the cart to the point of immovability.


The whole point of the cart is to help the horse move something that it can’t carry on its own back from here
to there. If the horse were in charge, he would leave the cart behind and run like mad. We humans—master
builders of tools—unlike horses, frequently become enamored by the tools and forget the task. I’m concerned
that this is what’s happening with Big Data.

Don’t fall for the ruse. The next time a BI vendor launches into an enthusiastic sales pitch about Big Data, look
him straight in the eye and say:

    “Big Data, Big Deal! Help me find a way to pare my data down to something useful. Until you can help
    me with that, get out of my face.”

Strong words, but justified. Until we begin to demand useful technology, BI vendors will continue to churn out
what they know, which is usually limited to bigger and faster.

I’m thrilled that people are recognizing the value that can be gleaned from data to inform better decisions. I
applaud their enthusiasm. I’ve committed my professional life to supporting this. Enthusiasm for data will get us
nowhere, however, as long as we allow vendors to exploit it for their own ends, which are rarely our ends. We
can use data in world changing ways, but only if we’re smart and keep our eyes on the goal.

Will new sources of data and our ability to store and interact with greater volumes of data lead to new insights?
Perhaps. I certainly hope so. The point that I’m making, though, is that few if any of these new insights will
emerge from anything that BI vendors are marketing as Big Data technologies. They will emerge from people
using their brains to think smarter about data. They will emerge from effective interaction with data, rooted in
statistical skill and supported by tools—especially visual analysis tools—that are well designed to augment
human perception and cognition. In other words, they will emerge when people find and learn how to use the
loom that’s needed to weave data into meaningful insights.


Copyright © 2012 Stephen Few, Perceptual Edge                                                           Page 7 of 8
Discuss this Article
Share your thoughts about this article by visiting the Big Data, Big Ruse thread in our discussion forum.


About the Author
Stephen Few has worked for over 25 years as an IT innovator, consultant, and teacher. Today, as Principal
of the consultancy Perceptual Edge, Stephen focuses on data visualization for analyzing and communicating
quantitative business information. He provides training and consulting services, writes the quarterly Visual
Business Intelligence Newsletter, and speaks frequently at conferences. He is the author of three books:
Show Me the Numbers: Designing Tables and Graphs to Enlighten, Second Edition, Information Dashboard
Design: The Effective Visual Communication of Data, and Now You See It: Simple Visualization Techniques for
Quantitative Analysis. You can learn more about Stephen’s work and access an entire library of articles at
www.perceptualedge.com. Between articles, you can read Stephen’s thoughts on the industry in his blog.


Copyright © 2012 Stephen Few, Perceptual Edge                                                          Page 8 of 8

More Related Content

What's hot

Data storytelling
Data storytelling Data storytelling
Data storytelling
Elena Simperl
 
The Essential Data Ingredient
The Essential Data IngredientThe Essential Data Ingredient
The Essential Data Ingredient
Rich Cooper
 
Is Your Company Braced Up for handling Big Data
Is Your Company Braced Up for handling Big DataIs Your Company Braced Up for handling Big Data
Is Your Company Braced Up for handling Big Data
himanshu13jun
 
What Big Data Means for PR and Why It Matters to Us
What Big Data Means for PR and Why It Matters to UsWhat Big Data Means for PR and Why It Matters to Us
What Big Data Means for PR and Why It Matters to Us
MSL
 
O'Reilly eBook: Creating a Data-Driven Enterprise in Media | eubolr
O'Reilly eBook: Creating a Data-Driven Enterprise in Media | eubolrO'Reilly eBook: Creating a Data-Driven Enterprise in Media | eubolr
O'Reilly eBook: Creating a Data-Driven Enterprise in Media | eubolr
Vasu S
 
The Future of Big Data
The Future of Big Data The Future of Big Data
The Future of Big Data
EMC
 
Vint big data research privacy technology and the law
Vint big data research privacy technology and the lawVint big data research privacy technology and the law
Vint big data research privacy technology and the law
Karlos Svoboda
 
Sogeti on big data creating clarity
Sogeti on big data creating claritySogeti on big data creating clarity
Sogeti on big data creating clarity
Yann SESE
 
Whitepaper: Thriving in the Big Data era Manage Data before Data Manages you
Whitepaper: Thriving in the Big Data era Manage Data before Data Manages you Whitepaper: Thriving in the Big Data era Manage Data before Data Manages you
Whitepaper: Thriving in the Big Data era Manage Data before Data Manages you
Intellectyx Inc
 
Five Hot Trends for 2018
Five Hot Trends for 2018Five Hot Trends for 2018
Five Hot Trends for 2018
ibi
 
Big Data RF
Big Data RFBig Data RF
Big Data RF
whatismarketing
 
From hype to action getting what's needed from big data a
From hype to action getting what's needed from big data aFrom hype to action getting what's needed from big data a
From hype to action getting what's needed from big data a
gwdeodhar
 
Information 3.0 - Data + Technology + People
Information 3.0 - Data + Technology + PeopleInformation 3.0 - Data + Technology + People
Information 3.0 - Data + Technology + People
Hubbard One
 
The Human Side of Data By Colin Strong
The Human Side of Data By Colin StrongThe Human Side of Data By Colin Strong
The Human Side of Data By Colin Strong
MarTech Conference
 
Big Data Management For Dummies Informatica
Big Data Management For Dummies InformaticaBig Data Management For Dummies Informatica
Big Data Management For Dummies Informatica
Fiona Lew
 
Policy paper need for focussed big data & analytics skillset building throu...
Policy  paper  need for focussed big data & analytics skillset building throu...Policy  paper  need for focussed big data & analytics skillset building throu...
Policy paper need for focussed big data & analytics skillset building throu...
Ritesh Shrivastava
 

What's hot (16)

Data storytelling
Data storytelling Data storytelling
Data storytelling
 
The Essential Data Ingredient
The Essential Data IngredientThe Essential Data Ingredient
The Essential Data Ingredient
 
Is Your Company Braced Up for handling Big Data
Is Your Company Braced Up for handling Big DataIs Your Company Braced Up for handling Big Data
Is Your Company Braced Up for handling Big Data
 
What Big Data Means for PR and Why It Matters to Us
What Big Data Means for PR and Why It Matters to UsWhat Big Data Means for PR and Why It Matters to Us
What Big Data Means for PR and Why It Matters to Us
 
O'Reilly eBook: Creating a Data-Driven Enterprise in Media | eubolr
O'Reilly eBook: Creating a Data-Driven Enterprise in Media | eubolrO'Reilly eBook: Creating a Data-Driven Enterprise in Media | eubolr
O'Reilly eBook: Creating a Data-Driven Enterprise in Media | eubolr
 
The Future of Big Data
The Future of Big Data The Future of Big Data
The Future of Big Data
 
Vint big data research privacy technology and the law
Vint big data research privacy technology and the lawVint big data research privacy technology and the law
Vint big data research privacy technology and the law
 
Sogeti on big data creating clarity
Sogeti on big data creating claritySogeti on big data creating clarity
Sogeti on big data creating clarity
 
Whitepaper: Thriving in the Big Data era Manage Data before Data Manages you
Whitepaper: Thriving in the Big Data era Manage Data before Data Manages you Whitepaper: Thriving in the Big Data era Manage Data before Data Manages you
Whitepaper: Thriving in the Big Data era Manage Data before Data Manages you
 
Five Hot Trends for 2018
Five Hot Trends for 2018Five Hot Trends for 2018
Five Hot Trends for 2018
 
Big Data RF
Big Data RFBig Data RF
Big Data RF
 
From hype to action getting what's needed from big data a
From hype to action getting what's needed from big data aFrom hype to action getting what's needed from big data a
From hype to action getting what's needed from big data a
 
Information 3.0 - Data + Technology + People
Information 3.0 - Data + Technology + PeopleInformation 3.0 - Data + Technology + People
Information 3.0 - Data + Technology + People
 
The Human Side of Data By Colin Strong
The Human Side of Data By Colin StrongThe Human Side of Data By Colin Strong
The Human Side of Data By Colin Strong
 
Big Data Management For Dummies Informatica
Big Data Management For Dummies InformaticaBig Data Management For Dummies Informatica
Big Data Management For Dummies Informatica
 
Policy paper need for focussed big data & analytics skillset building throu...
Policy  paper  need for focussed big data & analytics skillset building throu...Policy  paper  need for focussed big data & analytics skillset building throu...
Policy paper need for focussed big data & analytics skillset building throu...
 

Viewers also liked

Plano safra familiar 2016.2017-1
Plano safra familiar  2016.2017-1Plano safra familiar  2016.2017-1
Plano safra familiar 2016.2017-1
Luis Carlos
 
Fibonacci
FibonacciFibonacci
Fibonacci
Ram Mukilan
 
Buon natale a tutti i fans di ris
Buon natale a tutti i fans di risBuon natale a tutti i fans di ris
Buon natale a tutti i fans di risCamilla Rossi
 
Masjid masjid di dunia
Masjid masjid di duniaMasjid masjid di dunia
Masjid masjid di duniaRozana Oja
 
Fibonacci1
Fibonacci1Fibonacci1
Fibonacci1
Ram Mukilan
 
Apostila trigonometria
Apostila trigonometriaApostila trigonometria
Apostila trigonometria
Lilian Pollyane Costa
 

Viewers also liked (6)

Plano safra familiar 2016.2017-1
Plano safra familiar  2016.2017-1Plano safra familiar  2016.2017-1
Plano safra familiar 2016.2017-1
 
Fibonacci
FibonacciFibonacci
Fibonacci
 
Buon natale a tutti i fans di ris
Buon natale a tutti i fans di risBuon natale a tutti i fans di ris
Buon natale a tutti i fans di ris
 
Masjid masjid di dunia
Masjid masjid di duniaMasjid masjid di dunia
Masjid masjid di dunia
 
Fibonacci1
Fibonacci1Fibonacci1
Fibonacci1
 
Apostila trigonometria
Apostila trigonometriaApostila trigonometria
Apostila trigonometria
 

Similar to Big data big_ruse

Converting Big Data To Smart Data | The Step-By-Step Guide!
Converting Big Data To Smart Data | The Step-By-Step Guide!Converting Big Data To Smart Data | The Step-By-Step Guide!
Converting Big Data To Smart Data | The Step-By-Step Guide!
Kavika Roy
 
Sogeti big data research privacy technology and the law
Sogeti big data research privacy technology and the lawSogeti big data research privacy technology and the law
Sogeti big data research privacy technology and the law
Yann SESE
 
Big data 3 4- vint-big-data-research-privacy-technology-and-the-law - big dat...
Big data 3 4- vint-big-data-research-privacy-technology-and-the-law - big dat...Big data 3 4- vint-big-data-research-privacy-technology-and-the-law - big dat...
Big data 3 4- vint-big-data-research-privacy-technology-and-the-law - big dat...
Rick Bouter
 
Demystifying Big Data for Associations
Demystifying Big Data for AssociationsDemystifying Big Data for Associations
Demystifying Big Data for Associations
Patrick Dorsey
 
Notes from the Observation Deck // A Data Revolution
Notes from the Observation Deck // A Data Revolution Notes from the Observation Deck // A Data Revolution
Notes from the Observation Deck // A Data Revolution
gngeorge
 
Entry of big data into translation
Entry of big data into translationEntry of big data into translation
Entry of big data into translation
Shreya Gupta
 
Big data 1 4 vint-sogeti-on-big-data-1-of-4-creating clarity with big data
Big data 1 4 vint-sogeti-on-big-data-1-of-4-creating clarity with big dataBig data 1 4 vint-sogeti-on-big-data-1-of-4-creating clarity with big data
Big data 1 4 vint-sogeti-on-big-data-1-of-4-creating clarity with big data
Rick Bouter
 
What is Big Data? - Business Plans
What is Big Data? - Business PlansWhat is Big Data? - Business Plans
What is Big Data? - Business Plans
Our Business Ladder
 
Data - Its a big deal
Data - Its a big dealData - Its a big deal
Data - Its a big deal
Subarna Gupta
 
360i Report: Big Data
360i Report: Big Data360i Report: Big Data
360i Report: Big Data
360i
 
Whitebook on Big Data
Whitebook on Big DataWhitebook on Big Data
Whitebook on Big Data
Viren Aul
 
Small data vs. Big data : back to the basics
Small data vs. Big data : back to the basicsSmall data vs. Big data : back to the basics
Small data vs. Big data : back to the basics
Ahmed Banafa
 
Analytical thinking 8 - June 2012
Analytical thinking 8 - June 2012Analytical thinking 8 - June 2012
Analytical thinking 8 - June 2012
Charlotte Skornik
 
Revealing B2B Digital Marketers biggest challenges
Revealing B2B Digital Marketers biggest challengesRevealing B2B Digital Marketers biggest challenges
Revealing B2B Digital Marketers biggest challenges
idio Ltd
 
Big data assignment
Big data assignmentBig data assignment
Big data assignment
AnujaChatterjee
 
Business Analytics A Certain Something
Business Analytics A Certain SomethingBusiness Analytics A Certain Something
Business Analytics A Certain Something
Logicalis
 
Bigdata Hadoop introduction
Bigdata Hadoop introductionBigdata Hadoop introduction
Bigdata Hadoop introduction
Sunitha Mutchintala
 
How Companies Turn Data Into Business Value
 How Companies Turn Data Into Business Value How Companies Turn Data Into Business Value
How Companies Turn Data Into Business Value
Jamie Hribal
 
Magenta advisory: Data Driven Decision Making –Is Your Organization Ready Fo...
Magenta advisory: Data Driven Decision Making  –Is Your Organization Ready Fo...Magenta advisory: Data Driven Decision Making  –Is Your Organization Ready Fo...
Magenta advisory: Data Driven Decision Making –Is Your Organization Ready Fo...
BearingPoint Finland
 
Sogeti on big data creating clarity - Report 1-4 on Big Data - Sogeti ViNT
 Sogeti on big data creating clarity - Report 1-4 on Big Data - Sogeti ViNT Sogeti on big data creating clarity - Report 1-4 on Big Data - Sogeti ViNT
Sogeti on big data creating clarity - Report 1-4 on Big Data - Sogeti ViNT
Rick Bouter
 

Similar to Big data big_ruse (20)

Converting Big Data To Smart Data | The Step-By-Step Guide!
Converting Big Data To Smart Data | The Step-By-Step Guide!Converting Big Data To Smart Data | The Step-By-Step Guide!
Converting Big Data To Smart Data | The Step-By-Step Guide!
 
Sogeti big data research privacy technology and the law
Sogeti big data research privacy technology and the lawSogeti big data research privacy technology and the law
Sogeti big data research privacy technology and the law
 
Big data 3 4- vint-big-data-research-privacy-technology-and-the-law - big dat...
Big data 3 4- vint-big-data-research-privacy-technology-and-the-law - big dat...Big data 3 4- vint-big-data-research-privacy-technology-and-the-law - big dat...
Big data 3 4- vint-big-data-research-privacy-technology-and-the-law - big dat...
 
Demystifying Big Data for Associations
Demystifying Big Data for AssociationsDemystifying Big Data for Associations
Demystifying Big Data for Associations
 
Notes from the Observation Deck // A Data Revolution
Notes from the Observation Deck // A Data Revolution Notes from the Observation Deck // A Data Revolution
Notes from the Observation Deck // A Data Revolution
 
Entry of big data into translation
Entry of big data into translationEntry of big data into translation
Entry of big data into translation
 
Big data 1 4 vint-sogeti-on-big-data-1-of-4-creating clarity with big data
Big data 1 4 vint-sogeti-on-big-data-1-of-4-creating clarity with big dataBig data 1 4 vint-sogeti-on-big-data-1-of-4-creating clarity with big data
Big data 1 4 vint-sogeti-on-big-data-1-of-4-creating clarity with big data
 
What is Big Data? - Business Plans
What is Big Data? - Business PlansWhat is Big Data? - Business Plans
What is Big Data? - Business Plans
 
Data - Its a big deal
Data - Its a big dealData - Its a big deal
Data - Its a big deal
 
360i Report: Big Data
360i Report: Big Data360i Report: Big Data
360i Report: Big Data
 
Whitebook on Big Data
Whitebook on Big DataWhitebook on Big Data
Whitebook on Big Data
 
Small data vs. Big data : back to the basics
Small data vs. Big data : back to the basicsSmall data vs. Big data : back to the basics
Small data vs. Big data : back to the basics
 
Analytical thinking 8 - June 2012
Analytical thinking 8 - June 2012Analytical thinking 8 - June 2012
Analytical thinking 8 - June 2012
 
Revealing B2B Digital Marketers biggest challenges
Revealing B2B Digital Marketers biggest challengesRevealing B2B Digital Marketers biggest challenges
Revealing B2B Digital Marketers biggest challenges
 
Big data assignment
Big data assignmentBig data assignment
Big data assignment
 
Business Analytics A Certain Something
Business Analytics A Certain SomethingBusiness Analytics A Certain Something
Business Analytics A Certain Something
 
Bigdata Hadoop introduction
Bigdata Hadoop introductionBigdata Hadoop introduction
Bigdata Hadoop introduction
 
How Companies Turn Data Into Business Value
 How Companies Turn Data Into Business Value How Companies Turn Data Into Business Value
How Companies Turn Data Into Business Value
 
Magenta advisory: Data Driven Decision Making –Is Your Organization Ready Fo...
Magenta advisory: Data Driven Decision Making  –Is Your Organization Ready Fo...Magenta advisory: Data Driven Decision Making  –Is Your Organization Ready Fo...
Magenta advisory: Data Driven Decision Making –Is Your Organization Ready Fo...
 
Sogeti on big data creating clarity - Report 1-4 on Big Data - Sogeti ViNT
 Sogeti on big data creating clarity - Report 1-4 on Big Data - Sogeti ViNT Sogeti on big data creating clarity - Report 1-4 on Big Data - Sogeti ViNT
Sogeti on big data creating clarity - Report 1-4 on Big Data - Sogeti ViNT
 

Big data big_ruse

  • 1. Big Data, Big Ruse Stephen Few, Perceptual Edge Visual Business Intelligence Newsletter July/August/September 2012 If you’re like me, the mere mention of Big Data now turns your stomach. Nearly every business intelligence (BI) vendor, publication, and event has Big Data flashing in neon colors in Times Square dimensions. Never before have I seen an idea in the BI space elicit this much obsession. Why all the fuss? Why, indeed. Essentially, Big Data is a marketing campaign, pure and simple. For many years now we’ve been told that we’re living in the Information Age. As more data and the technologies that process it surround us, we’re told that we now work smarter and more efficiently, but experience says otherwise. We blame the failure on ourselves. “Why do I feel buried and confused when I’m supposed to feel empowered? Something must be wrong with me! I’m not smart enough. I’m technologically inept.” Vendors tap into this anxiety and milk it for all its worth. Big Data is just the latest carrot that they’re tauntingly dangling to keep us chasing a fantasy. While we breathlessly struggle to gain our feet, they count their money and laugh. Every few years the BI revenue stream begins to dry up a bit and the marketing folks come up with a new promise of information nirvana. Some of these enticements are constantly recycled, like “self-service BI,” which gets trotted out with every new software release, hoping we’ll forget that the same promise was made but never fulfilled last time. Big Data is just the new rallying cry for the same old stuff BI companies have been producing all along. Yeah, I know that they’re enlarging storage capacities and improving processing times, but that’s hardly new. Data didn’t suddenly get big, I’ve been working in information technology for 30 years and data has always been big. The amount of data that we were generating back then was already increasing at an exponential rate. What’s going on now is just more of the same. And all along, as the mounds of data continue to bury us, we make little progress in the only thing that matters: doing something useful with data. That’s because we’ve been going about it all wrong. Copyright © 2012 Stephen Few, Perceptual Edge Page 1 of 8
  • 2. Edna St. Vincent Millay wrote a poem titled “Huntsman, What Quarry” back in the year 1939 that addressed the question of Big Data: Upon this gifted age, in its dark hour, rains from the sky a meteoric shower of facts…they lie, unquestioned, uncombined. Wisdom enough to leach us of our ill is daily spun; but there exists no loom to weave it into a fabric. Even before the advent of computers the world was struggling with the effects of too much data. All those facts are not only meaningless, they’re oppressive, until we learn how to question them and to connect the dots into something meaningful, weaving them into the fabric of understanding. Here we are today, living in the so-called Information Age, and yet we have made little progress. We’re still looking for the loom because we’ve been looking in the wrong places. The notion of Big Data resonates because it is our base nature to crave everything that comes in mega-sizes: Big Data, Big Gulp, Big Mac. In data as in food, this is a recipe for indigestion and a path to obesity. Big Data is a technological expression of gluttony. Big Mistake. An unhealthy appetite for increasingly more data is like an insatiable craving for wealth. Beyond a certain level, further acquisition is useless. It doesn’t make you happier and it certainly doesn’t make you a better person (or organization). The constant pursuit turns us into obsessive hoarders and slaves. It is an appreciation for and productive use of the data we have that satisfies and liberates. The founder of Taoism, Lao Tzu, once said: “Muddy water, left standing, becomes clear.” The constant addition of more data keeps the silt of unknowing and disuse churned up. Only when we take a breath, slow down, open our eyes and focus our minds will clarity gradually develop. Breathe… What the Hell Is Big Data Anyway? Like many terms that have been coined to promote new interest in business intelligence (dashboards, analytics, business performance management, advanced data visualization, etc.), Big Data thrives on remaining ill defined and feeds on ignorance. If you perform a quick Web search on the term, all of the top links other than the Wikipedia entry are to BI vendors. Interest in Big Data today is a direct result of vendor Copyright © 2012 Stephen Few, Perceptual Edge Page 2 of 8
  • 3. marketing; it didn’t emerge naturally from the needs of users. Some of the claims about big data are little more than self-serving fantasies that are meant to inspire big revenues for companies that play in this space. Here’s an example from McKinsey Global Institute (MGI): MGI studied big data in five domains—healthcare in the United States, the public sector in Europe, retail in the United States, and manufacturing and personal-location data globally. Big data can generate value in each. For example, a retailer using big data to the full could increase its operating margin by more than 60 percent. Harnessing big data in the public sector has enormous potential, too. If US healthcare were to use big data creatively and effectively to drive efficiency and quality, the sector could create more than $300 billion in value every year. Two-thirds of that would be in the form of reducing US healthcare expenditure by about 8 percent. In the developed economies of Europe, government administrators could save more than €100 billion ($149 billion) in operational efficiency improvements alone by using big data, not including using big data to reduce fraud and errors and boost the collection of tax revenues. And users of services enabled by personal-location data could capture $600 billion in consumer surplus. If you’re willing to put your trust in claims such as a 60% increase in operating margin, a $300 billion annual increase in value, an 8% reduction in expenditures, and a $600 billion consumer surplus, don’t embarrass yourself by trying to quantify these benefits after spending millions of dollars on Big Data technologies. You’d likely fail. You needn’t worry, though, because almost no one actually bothers to measure the outcomes of business intelligence investments. Using data more effectively can indeed lead to great benefits, including those that are measured in monetary terms, but these benefits can’t be quantified in the manner, to the degree, or with the precision that McKinsey suggests. When I ask representatives of BI vendors what they mean by big data, two characteristics dominate their definitions: 1. New data sources: These consist primarily of unstructured data sources, such as text-based information related to social media, and new sources of transactional data, such as from sensors. 2. Increased data volume: Data, data everywhere, in massive quantities. Collecting data from new sources rarely introduces data of a new nature; it just adds more of the same. For example, even if new types of sensors measure something that we’ve never measured before, a measurement is a measurement—it isn’t a new type of data that requires special handling. What about all of those new sources of unstructured data, such as that generated by social media (Twitter and its cohorts)? Don’t these unstructured sources require new means of data analysis? They may require improved means of data collection, storage, and search, but rarely new means of data sensemaking. We collect data about things, events, and measured observations. This is true whether we’re collecting sales data, measurements from new sensors, or data about human behavior on the Web or sentiment in Twitter. Do greater volumes of data represent a qualitative rather than merely a quantitative difference in our use of data? Jorge Camoes of ExcelCharts.com recently argued in my blog that they do by quoting the dictum “an order of magnitude quantitative change is a qualitative change.” Faster processing speeds that are required by increased quantities of data sometimes require radically new programming algorithms. Perhaps significant departures of this type from past methods qualify as qualitative changes, but this is business as usual. Today’s increases in data volumes are driving programming innovations just as they have in the past. Do these changes directly affect the ways that we interact with data to explore and make sense of it resulting in a qualitative shift? Not that I’ve noticed. Camoes went on to describe the change that he believes is necessary: You must train people, perhaps hire some statisticians. Make more scatterplots and fewer pie charts. Summarize the data, find complex relationships, add alerts, be prepared to react to outliers in a timely manner. Copyright © 2012 Stephen Few, Perceptual Edge Page 3 of 8
  • 4. These steps are indeed necessary. In fact, these changes are in lock step with the case that I’m making. Where Camoes and I differ is that I don’t see these changes as the result of Big Data. These changes have been needed all along. Matthew O’Kane recently described in my blog the following advantages of Big Data: The main driver of benefit is when predictive analytics is improved through the use of more varied and deeper data sets. It is this area where new techniques are required because the tried and tested regressions and decision trees won’t cut it any more. Is it true that predictive analytics have suffered from insufficient quantities of data? Perhaps in some cases, but I don’t think this is a fundamental problem plaguing predictive analytics. I think the bigger problem is that fact that few people have been sufficiently trained in statistics to build meaningful predictive models. This problem has existed all along. Do You Need Big Data? Big data is built on the unquestioned premise that more is better. The success of BI, however, cannot be measured in petabytes or any other unit of data volume. It must be measured in our increased ability to understand data and then make better decisions based on that understanding. More of the right data can be useful, but more for the mere sake of more will only complicate our lives. In the words of the 21st Century Information Fluency Project, we live in a time of “infowhelm.” Just because you can generate and collect more and more data doesn’t mean you should. You could record data about every blink of your eyes, but would that be useful? Unless you’re a scientist studying eye blinking, the answer is probably, “No.” Until you’ve figured out how to use the data that you already have, collecting more will only distract you from the real task. Time spent collecting more data is time that could be better spent weaving it into something meaningful. This seems obvious, but almost no attention is being given to building the skills and technologies that help us glean insights from data more effectively. As Richards J. Heuer, Jr. argued in the Psychology of Intelligence Analysis (1999), the primary failures of analysis are less due to insufficient data than to flawed thinking. To succeed analytically, we must invest a great deal more of our resources in training people to think effectively and we must equip them with tools that support that effort. Heuer spent 45 years supporting the work of the CIA. Identifying a potential terrorist plot requires an analyst to sift through a lot of data (perhaps Big Data), but more importantly, it relies on their ability to connect the dots. Contrary to Heuer’s emphasis on thinking skills, big data is merely about more, more, more; not smarter or better. Does Big Data Affect Data Visualization? In a recent article in CRN titled “Big Data Demands: The Heightened Need for Advanced Data Visualization” (ADV), Rick Whiting makes an uninformed argument. The fact that Whiting quotes “The Forrester Wave: Advanced Data Visualization, Q3 2012” report (several pages of utter nonsense) as his primary source exposes this as a sad case of the blind leading the blind. The article includes insights such as “In today’s fast-paced ‘big data’ world, static bar charts and pie charts just don’t cut it.” While it is true that static charts of any type don’t cut it for data sensemaking, this was true long before the advent of Big Data. And then there’s the plug for the kind of nonsense that BI vendors have been foisting on their customers for years: “Analytical results can be displayed in a three-dimensional graph” and “a series of ‘cockpit gauges’.” This is what they call “advanced data visualization”! And the crux of the argument is that “the need for these new-generation data visualization tools is being driven by the explosion of ‘big data’.” In truth, there is no need whatsoever for the horrible data visualization products that most BI vendors sell. The need that exists for the few good data visualization products that are available today is not being driven by Big Data, but by the same need that has existed all along: to understand data, no matter what its size. Do new sources of data really require new means of visualization? If so, it isn’t obvious. Consider unstructured social networking data. This information must be structured before it can be visualized, and once it’s structured, we can visualize it in familiar ways. Want to know what people are talking about on Twitter? To answer this question, you search for particular words and phrases that you’ve tied to particular topics and you count Copyright © 2012 Stephen Few, Perceptual Edge Page 4 of 8
  • 5. their occurrences. Once it’s structured in this way, you can visualize it simply, such as by using a bar graph with a bar for each topic sized by the number of occurrences in ranked order from high to low. If you want to know who’s talking to whom in an email system or what’s linked to what on your Web site, you glean those interactions from your email or Web server and count them. Because these interactions are structured as a network of connections (i.e., not a linear or hierarchical arrangement), you can visualize them as a network diagram: an arrangement of nodes and links. Nodes can be sized to indicate popular people or content and links (i.e., lines that connect the nodes) can vary in thickness to show the volume of interactions between particular pairs of nodes. Never used nodes and links to visualize, explore, and make sense of a network of relationships? This might be new to you, but it’s been around for many years and information visualization researchers have studied the hell out of it. What about exponentially increasing data volumes? Does this have an effect on data visualization? Not significantly. In my 30 years of experience using technology to squeeze meaning and usefulness from data, data volumes have always been big. When wasn’t there more data than we could handle? Although it is true that the volume of data continues to grow at an increasing rate, did it cross some threshold in the last few years that has made it qualitatively different from before? I don’t think so. The ability of technology to adequately store and access data has always remained just a little behind what we’d like to have in capacity and performance. A little more and a little faster have always been on our wish list. While information technology has struggled to catch up, mostly by pumping itself up with steroids, it has lost sight of the objective: to better understand the world—at least one’s little part of it (e.g., one’s business)—so we can make it better. Our current fascination with big data has us looking for better steroids to increase our brawn rather than better skills to develop our brains. In the world of analytics, brawn will only get us so far; only better thinking that will open the door to greater insight. Is there anything new about data today, big or otherwise, that should be leading us to visualize it differently? I was asked to think about this recently when advising a software vendor that is trying to develop powerful visualization solutions specifically for managing Big Data. After wracking my brain, I came up with nothing new. Almost everything that we should be doing to support the visual exploration, analysis, and presentation of data today involves better implementations of visualizations, statistical calculations, and data interactions that we’ve known about for years. Even though these features are old news, they still aren’t readily available in most commercial software today; certainly not in ways that work well. Rather than “going to where no one has gone before,” vendors need to do the less glorious work of supporting the basics well and data analysts need to deepen their data sensemaking skills. Will Data Save Us? There’s a nasty world out there filled with injustice and suffering, but data won’t save us; not even Big Data. Information is valuable only when we use it to do something worthwhile. We’re the protagonists in this story; information is only a resource. I had breakfast recently with a fellow who works as a computer security expert. He helps organizations identify, track, and prevent cybercrime. What inspires him to get up each morning? He has a chance to catch the “bad guys.” He uses his skills, honed through experience, to examine information in an effort to identify the bad guys and put them behind bars. He makes this happen, not data. I also had dinner not long ago with an executive of a good visual analytics software company—one of the few. While we were enjoying a nice bottle of Italian wine, he described the excitement of fellow employees at his company. At one point he said, “There’s a source of inspiration that everyone at the company seems to share. Can you guess what that is?” I guessed, “The joy of working for a company that produces software that actually works?” “That’s certainly one source of inspiration,” he said, “but the one that’s even more infectious is the belief that their work is helping to make the world a better place.” A deep feeling of satisfaction silenced me for a moment. This group of software engineers, designers, salespeople, and yes, even marketing folks, wake up each morning and greet the day with the belief that their work matters, that the products they make are being used for good. That’s priceless. Employees of every product maker or service provider should be able to start their days with this sense of purpose. Unfortunately, this is rare. It is certainly rare among employees of BI companies. Copyright © 2012 Stephen Few, Perceptual Edge Page 5 of 8
  • 6. A few months ago I gave a keynote presentation and taught a course at the Teradata Universe conference in Dublin, Ireland. At one point while wandering through the Dublin Convention Center I read the following banner: This was one of many banners that were strategically placed throughout the convention center to promote the conference by highlighting the importance of data. Upon reading the words of FedEx CEO Fred Smith, I suddenly realized why my packages sometimes arrive damaged. The information about the package is as important to FedEx as the package itself. Seriously? In our enthusiasm for data and information technology, let’s not lose perspective. Information is only important when it informs us meaningfully about something that actually exists in the world and that has value. Information about my package is only important if it gets that package to me intact. The information derives its value from the package. Information has no value in and of itself. BI, as I see it, is about asking the following three questions about information: 1. What does it mean? 2. Why does it matter? (Not “Does it matter?” because it’s too tempting to respond “Yes” without really understanding why.) 3. How then should we respond? The value of information and the success of business intelligence should be measured in terms of useful outcomes. Did your understanding increase (i.e., did you figure out what the information means)? If so, did that understanding relate to things that matter (i.e., did you determine how that understanding could make a positive difference)? If so, did that understanding produce better decisions and actions (i.e., did you choose and then take a course of action that produced the desired effect)? Only when you can answer “Yes” to each of these questions was the information and the technology that helped you understand it worthwhile. Most BI companies want you to believe that your problems can be solved by collecting and storing more data. They don’t encourage you to first understand and then use the data that you already have. Why? Because they only know how to build and sell you products for collecting and storing data and for accessing data at high speeds. They don’t know how to help you make sense and use of data in meaningful ways. They want you to desire and buy what they sell, not to recognize and demand what you actually need. Copyright © 2012 Stephen Few, Perceptual Edge Page 6 of 8
  • 7. Business intelligence has always put the cart before the horse—the technology (tools) before the users (human beings) and their goals. It is now piling data into the cart to the point of immovability. The whole point of the cart is to help the horse move something that it can’t carry on its own back from here to there. If the horse were in charge, he would leave the cart behind and run like mad. We humans—master builders of tools—unlike horses, frequently become enamored by the tools and forget the task. I’m concerned that this is what’s happening with Big Data. Don’t fall for the ruse. The next time a BI vendor launches into an enthusiastic sales pitch about Big Data, look him straight in the eye and say: “Big Data, Big Deal! Help me find a way to pare my data down to something useful. Until you can help me with that, get out of my face.” Strong words, but justified. Until we begin to demand useful technology, BI vendors will continue to churn out what they know, which is usually limited to bigger and faster. I’m thrilled that people are recognizing the value that can be gleaned from data to inform better decisions. I applaud their enthusiasm. I’ve committed my professional life to supporting this. Enthusiasm for data will get us nowhere, however, as long as we allow vendors to exploit it for their own ends, which are rarely our ends. We can use data in world changing ways, but only if we’re smart and keep our eyes on the goal. Will new sources of data and our ability to store and interact with greater volumes of data lead to new insights? Perhaps. I certainly hope so. The point that I’m making, though, is that few if any of these new insights will emerge from anything that BI vendors are marketing as Big Data technologies. They will emerge from people using their brains to think smarter about data. They will emerge from effective interaction with data, rooted in statistical skill and supported by tools—especially visual analysis tools—that are well designed to augment human perception and cognition. In other words, they will emerge when people find and learn how to use the loom that’s needed to weave data into meaningful insights. Copyright © 2012 Stephen Few, Perceptual Edge Page 7 of 8
  • 8. Discuss this Article Share your thoughts about this article by visiting the Big Data, Big Ruse thread in our discussion forum. About the Author Stephen Few has worked for over 25 years as an IT innovator, consultant, and teacher. Today, as Principal of the consultancy Perceptual Edge, Stephen focuses on data visualization for analyzing and communicating quantitative business information. He provides training and consulting services, writes the quarterly Visual Business Intelligence Newsletter, and speaks frequently at conferences. He is the author of three books: Show Me the Numbers: Designing Tables and Graphs to Enlighten, Second Edition, Information Dashboard Design: The Effective Visual Communication of Data, and Now You See It: Simple Visualization Techniques for Quantitative Analysis. You can learn more about Stephen’s work and access an entire library of articles at www.perceptualedge.com. Between articles, you can read Stephen’s thoughts on the industry in his blog. Copyright © 2012 Stephen Few, Perceptual Edge Page 8 of 8