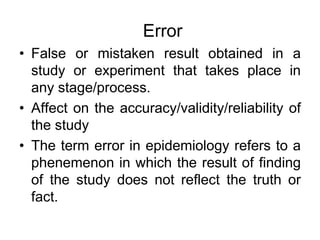
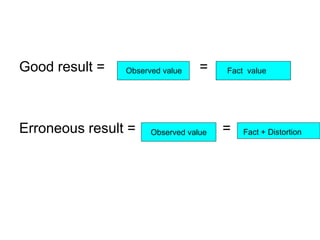
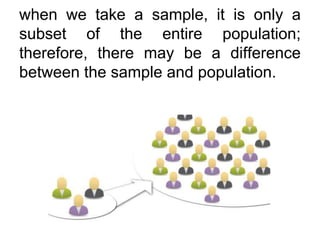
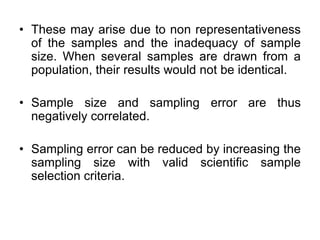
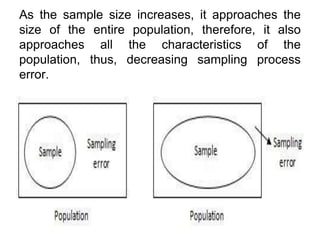
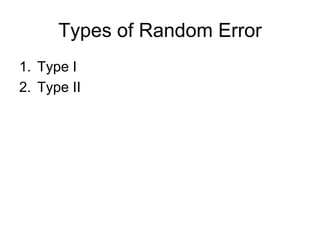
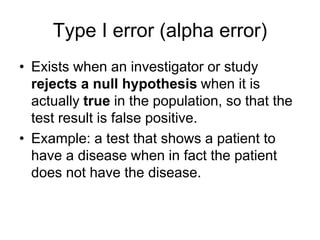
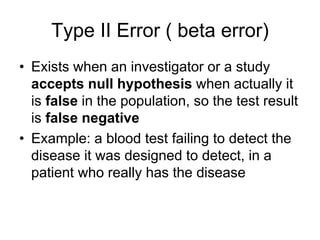
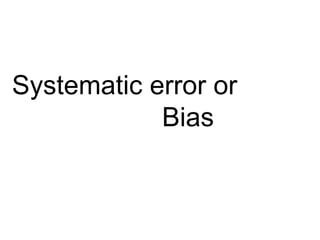
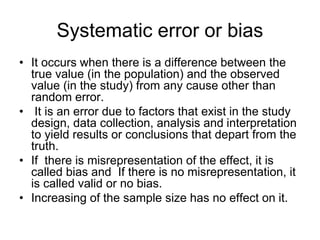
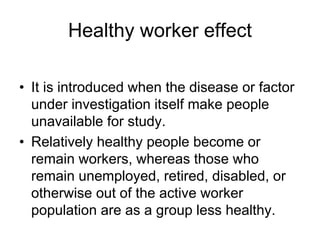
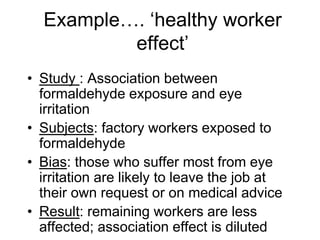
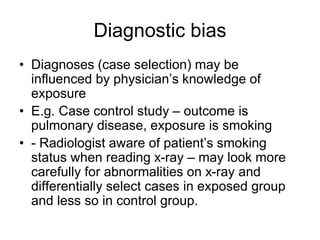
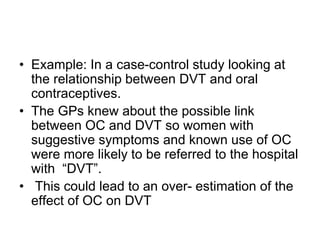
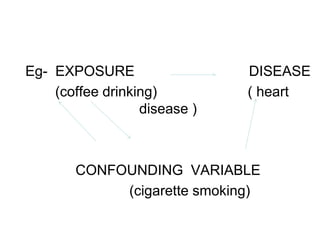
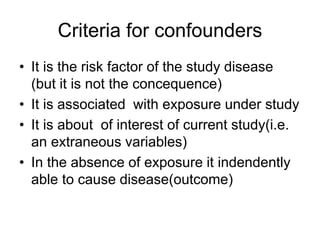
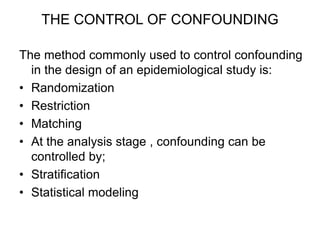
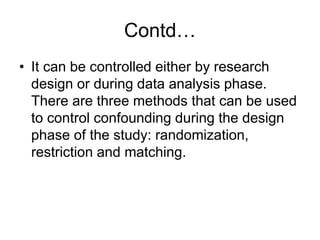
Error and Bias
PRESENTED BY
MN first year
Mary Pradhan, Saraswati Shrestha, Narayani
Lamichhane
Content
• Introduction of error
• Types of error
• Types of bias.
Error
• False or mistaken result obtained in a
study or experiment that takes place in
any stage/process.
• Affect on the accuracy/validity/reliability of
the study
• The term error in epidemiology refers to a
phenemenon in which the result of finding
of the study does not reflect the truth or
fact.
Good result = =
Erroneous result = =
Observed value Fact value
Observed value Fact + Distortion
• It is difficult to make the study free from
any type of error.
• Therefore, the aim is to maximize fact and
minimize error so that the research work
would represent to the population they
refer.
Basic Types of Error
• Random Error (Precision Problem)
• Systemic Error (Validity Problem)
Random error
• By chance error
• Makes observed values differ from the true value.
• Error exist every time when we draw a random
sample and make a conclusion regarding the
respective population.
• In epidemiologic studies , random error has many
components but major contributor is the process of
selecting the specific study subjects i.e. sampling
error
Sampling error
• Sampling error is the deviation of the selected sample
from the true characteristics, traits, behaviors, qualities
or figures of the entire population.
• Because of chance, different samples will produce
different results and therefore must be taken into
account when using a sample to make inferences
about a population. This difference is referred to as
the sampling error and its variability is measured by
the standard error.
• The error which arise because of studying only a part
of the total population are called sampling errors.
when we take a sample, it is only a
subset of the entire population;
therefore, there may be a difference
between the sample and population.
• These may arise due to non representativeness
of the samples and the inadequacy of sample
size. When several samples are drawn from a
population, their results would not be identical.
• Sample size and sampling error are thus
negatively correlated.
• Sampling error can be reduced by increasing the
sampling size with valid scientific sample
selection criteria.
As the sample size increases, it approaches the
size of the entire population, therefore, it also
approaches all the characteristics of the
population, thus, decreasing sampling process
error.
Types of Random Error
1. Type I
2. Type II
Type I error (alpha error)
• Exists when an investigator or study
rejects a null hypothesis when it is
actually true in the population, so that the
test result is false positive.
• Example: a test that shows a patient to
have a disease when in fact the patient
does not have the disease.
Type II Error ( beta error)
• Exists when an investigator or a study
accepts null hypothesis when actually it
is false in the population, so the test result
is false negative
• Example: a blood test failing to detect the
disease it was designed to detect, in a
patient who really has the disease
Systematic error or
Bias
Systematic error or bias
• It occurs when there is a difference between the
true value (in the population) and the observed
value (in the study) from any cause other than
random error.
• It is an error due to factors that exist in the study
design, data collection, analysis and interpretation
to yield results or conclusions that depart from the
truth.
• If there is misrepresentation of the effect, it is
called bias and If there is no misrepresentation, it
is called valid or no bias.
• Increasing of the sample size has no effect on it.
• In an epidemiological study, it is defined
as any systematic error that result an
incorrect estimate of the association
between exposure and risk of disease.
• Example - testing for antibodies will
consistently underestimate the prevalence
of HIV infection because individual who
have been infected for less than six
months will not yet have developed
antibodies.
Definition of bias
• Any trend in the collection, analysis,
interpretation, publication or review of
data that can lead to conclusions that
are systematically different from the
truth (Last, 2001)
• A process at any state of inference
tending to produce results that depart
systematically from the true values
(Fletcher et al, 1988)
Types of bias or systematic error
• Selection Bias
• Information Bias
• Confounding
Selection Bias
• Selection bias occurs when there is a
systematic difference between the
characteristics of the people selected for a
study and the characteristics of those who
are not and which distorts in the estimate of
effect (result).
• .sample obtained is not representative of
the population to be analyzed
Types
• Publicity bias
• Non-response bias
• Healthy worker effect
• Diagnostic bias
• Loss to follow-up bias
Publicity bias
• People referring themselves to the investigators
following publicity of the study.
• Publicity bias can also occur from news reports not
related to individuals.
• In a 1981 –1982 survey of individuals near two
hazardous waste disposal sites in Louisiana, people
were asked about various symptoms. Air and water
quality data showed little evidence of hazardous
concentrations of chemicals, but there had been
extensive media coverage at the time of the survey.
• Respondents living near the sites were two to three
times as likely to report symptoms as respondents in
an unexposed community because of the influence of
the publicity at that moment in time.
Non –response bias
• A type of bias when an individual chosen
for the sample cannot be contacted or
refuses to cooperate . When non response
bias occurs, there is an unrepresentative
sample.
Example
Consider a study that examines drug
abuse among adults. Many drug users
may be unwilling to talk about their views
toward drug abuse in light of their own
problems. Due to these participation
issues, the opinion of drug nonusers
should be overrepresented.
Healthy worker effect
• It is introduced when the disease or factor
under investigation itself make people
unavailable for study.
• Relatively healthy people become or
remain workers, whereas those who
remain unemployed, retired, disabled, or
otherwise out of the active worker
population are as a group less healthy.
Example…. ‘healthy worker
effect’
• Study : Association between
formaldehyde exposure and eye
irritation
• Subjects: factory workers exposed to
formaldehyde
• Bias: those who suffer most from eye
irritation are likely to leave the job at
their own request or on medical advice
• Result: remaining workers are less
affected; association effect is diluted
Diagnostic bias
• Diagnoses (case selection) may be
influenced by physician’s knowledge of
exposure
• E.g. Case control study – outcome is
pulmonary disease, exposure is smoking
• - Radiologist aware of patient’s smoking
status when reading x-ray – may look more
carefully for abnormalities on x-ray and
differentially select cases in exposed group
and less so in control group.
• Example: In a case-control study looking at
the relationship between DVT and oral
contraceptives.
• The GPs knew about the possible link
between OC and DVT so women with
suggestive symptoms and known use of OC
were more likely to be referred to the hospital
with “DVT”.
• This could lead to an over- estimation of the
effect of OC on DVT
Loss to follow-up bias
• lost to follow-up refers to respondents who
are at one point in time were actively
participating in a clinical research trial, but
have become lost at the point of follow-up in
the trial.
• Design and implementation of the study
should try to minimize this and we should aim
to ensure that all groups are followed as
completely as possible and with equal rigor
Information bias
• It is a distortion in the estimate of effect due to
measurement error or misclassification of
subjects on one or more variables.
Contd…
• It may also be called as Measurement bias,
misclassification bias.
• Major sources of measurement bias include
invalid measurement, incorrect diagnostic
criteria, and omissions and inadequacies in
previously recorded data.
Common Types of Measurement Biases
• instrument bias,
• insensitive measure bias,
• expectation bias/observer bias
• recall or memory bias,
• attention bias, and
• verification or work-up bias.
Contd…
Instrument bias:
• Instrument bias occurs when calibration
errors lead to inaccurate measurements being
recorded, e.g., an unbalanced weight scale.
Contd…
Insensitive measure bias:
• Insensitive measure bias occurs when the
measurement tool(s) used are not sensitive
(poor calibration) enough to detect what
might be important differences in the
variable of interest.
Expectation bias
• Expectation bias occurs in the absence of
masking or blinding, when observer may
have error in measuring data towards the
expected outcome.
• The observer-expectancy effect occurs
when a researcher's beliefs or
expectations unconsciously affect the
behavior of the observed subject(s)
Recall or memory bias.
• Systematic error due to differences in accuracy
or completeness of recall to memory of past
events or experience.
• Often a person recalls positive events more than
negative ones. Alternatively, certain subjects may
be questioned more vigorously than others,
thereby improving their recollections.
• Mothers of children with birth defects are likely to remember
drugs they took during pregnancy differently than mothers of
normal children.
• In this particular situation the bias is sometimes referred to
as maternal recall bias.
• Mothers of the affected infants are likely to have thought
about their drug use and other exposures during pregnancy to
a much greater extent than the mothers of normal children.
The primary difference arises more from under reporting of
exposures in the control group rather than over reporting in
the case group. However, it is also possible for the mothers in
the case group to under report their past exposures
• For example, mothers of infants who died from SIDS may be
inclined to under report their use of alcohol or recreational
drugs during pregnancy.
Contd..
Attention bias:
• Attention bias occurs because people who
are part of a study are usually aware of their
involvement, and as a result of the attention
received may give more favorable responses
or perform better than people who are
unaware of the study’s intent.
Verification or workup or referral
bias
• It is a type of measurement bias in which
the results of a diagnostic test affect
whether the gold standard procedure is
used to verify the test result.
• It is mainly associated with test validation
studies.
Cont..
• In clinical practice, referral bias is more
likely to occur when a preliminary
diagnostic test is negative. Because many
gold standard tests can be invasive,
expensive, and carry a higher risk (eg:
angiography, biopsy, surgery) ,patients
and physicians may be more reluctant to
undergo further workup if a preliminary
test is negative.
Contd..
• In cohort studies, obtaining a gold
standard test on every patient may not be
ethical, practical, or cost effective. These
studies can thus be subjected to
verification bias.
• One method to limit verification bias in
clinical studies is to perform gold standard
testing in a random sample of study
participants.
CONFOUNDING
• The term ‘confounding’ refers to the effect of
an extraneous variable that entirely or
partially explains the apparent association
between the study exposure and the disease.
• Confounding is a distortion in the estimated
measure of effect due to the mixing of the
effect of the study factor with the effect of
other risk factors. Confounding effect may
distort the true association in either direction.
• In a study of the association between
exposure to a cause ( or risk factor )
and the occurrence of disease,
confounding can occur when another
exposure exists in the study
population and is associated both with
the disease and the exposure being
studied.
Eg- EXPOSURE DISEASE
(coffee drinking) ( heart
disease )
CONFOUNDING VARIABLE
(cigarette smoking)
Criteria for confounders
• It is the risk factor of the study disease
(but it is not the concequence)
• It is associated with exposure under study
• It is about of interest of current study(i.e.
an extraneous variables)
• In the absence of exposure it indendently
able to cause disease(outcome)
THE CONTROL OF CONFOUNDING
The method commonly used to control confounding
in the design of an epidemiological study is:
• Randomization
• Restriction
• Matching
• At the analysis stage , confounding can be
controlled by;
• Stratification
• Statistical modeling
Contd…
• It can be controlled either by research
design or during data analysis phase.
There are three methods that can be used
to control confounding during the design
phase of the study: randomization,
restriction and matching.
•RANDOMIZATION-is applicable only to
experimental studies, is the ideal method for
ensuring that potential confounding variables are
equally distributed among the groups being
compared .The sample size has to be sufficiently
large to avoid random misdistribution of such
variables . Randomization avoids the association
between potentially confounding variables and the
exposure that is being considered.
• RESTRICTION can be used to limit the
study to people who have particular
characteristics. For Eg. In a study on the
effects of coffee on coronary heart
disease, participation in the study could be
restricted to nonsmokers, thus removing
any potential effect of confounding by
cigarette smoking.
• MATCHING – If matching is used to control
confounding the study participants are selected
so as to ensure that potential confounding
variables are evenly distributed in the two
groups being compared .For eg in a case –
control study of exercise and coronary heart
disease , each patient with heart disease can be
matched with a control of the same age group
and sex to ensure that confounding by age and
sex does not occur.
•STRATIFCATION- Confounding can be
controlled by stratification in which
subject are split into groups or strata and
the association between exposure and
outcome of interest is then measure
separately in each stratum, analysis can be
done separately men and women to remove
confounding by sex, for different age
groups and so on. In practice, it is difficult
to remove all confounding .
• MODELLING- Although stratification is
conceptually simple and relatively easy to
carry out, it is often limited by the size of the
study and it cannot help to control many
factors simultaneously, if we want to control
by age, sex, and smoking by stratification,
each stratum will contain only few percent of
study population and it can be difficult to
obtain precise estimates of association in each.
Contd…
• Therefore, statistical modeling (multivariate) is
used to control for all potential confounders
while controlling for a number of confounding
variables simultaneously
• The most common multivariate approach for
unmatched case control study is multiple
logistic regression and for matched case
control study is conditional logistic regression
and common technique used for cohort is Cox
proportional hazards regression.
References
Beaglehole, R., Bonita, R. & Kjellstrom, T. (2006).
Basic epidemiology. Delhi : A.I.T.B.S.
Rao, B. S.(2009). Essentials of Epidemiology.
Delhi: A.I.T.B.S.
Adhikari.S. Foundation of epidemiology.Makalu
publications(2008) first edition.
• http://www.umdnj.edu/idsweb/shared/biases.htm
• http://www.nswphc.unsw.edu.au/pdf/ShortCourse
ResMetJul06/PPts/Introductionto_biasin_research
_DavidLyle.pdf
• Joshi Dr A, Banjara, M. (2007). Fundamental of
Epidemiology
THANK YOU!!!!

Bias and error.final(1).ppt

  • 1.
    Error and Bias PRESENTEDBY MN first year Mary Pradhan, Saraswati Shrestha, Narayani Lamichhane
  • 2.
    Content • Introduction oferror • Types of error • Types of bias.
  • 3.
    Error • False ormistaken result obtained in a study or experiment that takes place in any stage/process. • Affect on the accuracy/validity/reliability of the study • The term error in epidemiology refers to a phenemenon in which the result of finding of the study does not reflect the truth or fact.
  • 4.
    Good result == Erroneous result = = Observed value Fact value Observed value Fact + Distortion
  • 5.
    • It isdifficult to make the study free from any type of error. • Therefore, the aim is to maximize fact and minimize error so that the research work would represent to the population they refer.
  • 6.
    Basic Types ofError • Random Error (Precision Problem) • Systemic Error (Validity Problem)
  • 7.
    Random error • Bychance error • Makes observed values differ from the true value. • Error exist every time when we draw a random sample and make a conclusion regarding the respective population. • In epidemiologic studies , random error has many components but major contributor is the process of selecting the specific study subjects i.e. sampling error
  • 8.
    Sampling error • Samplingerror is the deviation of the selected sample from the true characteristics, traits, behaviors, qualities or figures of the entire population. • Because of chance, different samples will produce different results and therefore must be taken into account when using a sample to make inferences about a population. This difference is referred to as the sampling error and its variability is measured by the standard error. • The error which arise because of studying only a part of the total population are called sampling errors.
  • 9.
    when we takea sample, it is only a subset of the entire population; therefore, there may be a difference between the sample and population.
  • 10.
    • These mayarise due to non representativeness of the samples and the inadequacy of sample size. When several samples are drawn from a population, their results would not be identical. • Sample size and sampling error are thus negatively correlated. • Sampling error can be reduced by increasing the sampling size with valid scientific sample selection criteria.
  • 11.
    As the samplesize increases, it approaches the size of the entire population, therefore, it also approaches all the characteristics of the population, thus, decreasing sampling process error.
  • 12.
    Types of RandomError 1. Type I 2. Type II
  • 13.
    Type I error(alpha error) • Exists when an investigator or study rejects a null hypothesis when it is actually true in the population, so that the test result is false positive. • Example: a test that shows a patient to have a disease when in fact the patient does not have the disease.
  • 14.
    Type II Error( beta error) • Exists when an investigator or a study accepts null hypothesis when actually it is false in the population, so the test result is false negative • Example: a blood test failing to detect the disease it was designed to detect, in a patient who really has the disease
  • 15.
  • 16.
    Systematic error orbias • It occurs when there is a difference between the true value (in the population) and the observed value (in the study) from any cause other than random error. • It is an error due to factors that exist in the study design, data collection, analysis and interpretation to yield results or conclusions that depart from the truth. • If there is misrepresentation of the effect, it is called bias and If there is no misrepresentation, it is called valid or no bias. • Increasing of the sample size has no effect on it.
  • 17.
    • In anepidemiological study, it is defined as any systematic error that result an incorrect estimate of the association between exposure and risk of disease. • Example - testing for antibodies will consistently underestimate the prevalence of HIV infection because individual who have been infected for less than six months will not yet have developed antibodies.
  • 18.
    Definition of bias •Any trend in the collection, analysis, interpretation, publication or review of data that can lead to conclusions that are systematically different from the truth (Last, 2001) • A process at any state of inference tending to produce results that depart systematically from the true values (Fletcher et al, 1988)
  • 19.
    Types of biasor systematic error • Selection Bias • Information Bias • Confounding
  • 20.
    Selection Bias • Selectionbias occurs when there is a systematic difference between the characteristics of the people selected for a study and the characteristics of those who are not and which distorts in the estimate of effect (result). • .sample obtained is not representative of the population to be analyzed
  • 21.
    Types • Publicity bias •Non-response bias • Healthy worker effect • Diagnostic bias • Loss to follow-up bias
  • 22.
    Publicity bias • Peoplereferring themselves to the investigators following publicity of the study. • Publicity bias can also occur from news reports not related to individuals. • In a 1981 –1982 survey of individuals near two hazardous waste disposal sites in Louisiana, people were asked about various symptoms. Air and water quality data showed little evidence of hazardous concentrations of chemicals, but there had been extensive media coverage at the time of the survey. • Respondents living near the sites were two to three times as likely to report symptoms as respondents in an unexposed community because of the influence of the publicity at that moment in time.
  • 23.
    Non –response bias •A type of bias when an individual chosen for the sample cannot be contacted or refuses to cooperate . When non response bias occurs, there is an unrepresentative sample.
  • 24.
    Example Consider a studythat examines drug abuse among adults. Many drug users may be unwilling to talk about their views toward drug abuse in light of their own problems. Due to these participation issues, the opinion of drug nonusers should be overrepresented.
  • 25.
    Healthy worker effect •It is introduced when the disease or factor under investigation itself make people unavailable for study. • Relatively healthy people become or remain workers, whereas those who remain unemployed, retired, disabled, or otherwise out of the active worker population are as a group less healthy.
  • 26.
    Example…. ‘healthy worker effect’ •Study : Association between formaldehyde exposure and eye irritation • Subjects: factory workers exposed to formaldehyde • Bias: those who suffer most from eye irritation are likely to leave the job at their own request or on medical advice • Result: remaining workers are less affected; association effect is diluted
  • 27.
    Diagnostic bias • Diagnoses(case selection) may be influenced by physician’s knowledge of exposure • E.g. Case control study – outcome is pulmonary disease, exposure is smoking • - Radiologist aware of patient’s smoking status when reading x-ray – may look more carefully for abnormalities on x-ray and differentially select cases in exposed group and less so in control group.
  • 28.
    • Example: Ina case-control study looking at the relationship between DVT and oral contraceptives. • The GPs knew about the possible link between OC and DVT so women with suggestive symptoms and known use of OC were more likely to be referred to the hospital with “DVT”. • This could lead to an over- estimation of the effect of OC on DVT
  • 29.
    Loss to follow-upbias • lost to follow-up refers to respondents who are at one point in time were actively participating in a clinical research trial, but have become lost at the point of follow-up in the trial. • Design and implementation of the study should try to minimize this and we should aim to ensure that all groups are followed as completely as possible and with equal rigor
  • 30.
    Information bias • Itis a distortion in the estimate of effect due to measurement error or misclassification of subjects on one or more variables.
  • 31.
    Contd… • It mayalso be called as Measurement bias, misclassification bias. • Major sources of measurement bias include invalid measurement, incorrect diagnostic criteria, and omissions and inadequacies in previously recorded data.
  • 32.
    Common Types ofMeasurement Biases • instrument bias, • insensitive measure bias, • expectation bias/observer bias • recall or memory bias, • attention bias, and • verification or work-up bias.
  • 33.
    Contd… Instrument bias: • Instrumentbias occurs when calibration errors lead to inaccurate measurements being recorded, e.g., an unbalanced weight scale.
  • 34.
    Contd… Insensitive measure bias: •Insensitive measure bias occurs when the measurement tool(s) used are not sensitive (poor calibration) enough to detect what might be important differences in the variable of interest.
  • 35.
    Expectation bias • Expectationbias occurs in the absence of masking or blinding, when observer may have error in measuring data towards the expected outcome. • The observer-expectancy effect occurs when a researcher's beliefs or expectations unconsciously affect the behavior of the observed subject(s)
  • 36.
    Recall or memorybias. • Systematic error due to differences in accuracy or completeness of recall to memory of past events or experience. • Often a person recalls positive events more than negative ones. Alternatively, certain subjects may be questioned more vigorously than others, thereby improving their recollections.
  • 37.
    • Mothers ofchildren with birth defects are likely to remember drugs they took during pregnancy differently than mothers of normal children. • In this particular situation the bias is sometimes referred to as maternal recall bias. • Mothers of the affected infants are likely to have thought about their drug use and other exposures during pregnancy to a much greater extent than the mothers of normal children. The primary difference arises more from under reporting of exposures in the control group rather than over reporting in the case group. However, it is also possible for the mothers in the case group to under report their past exposures • For example, mothers of infants who died from SIDS may be inclined to under report their use of alcohol or recreational drugs during pregnancy.
  • 38.
    Contd.. Attention bias: • Attentionbias occurs because people who are part of a study are usually aware of their involvement, and as a result of the attention received may give more favorable responses or perform better than people who are unaware of the study’s intent.
  • 39.
    Verification or workupor referral bias • It is a type of measurement bias in which the results of a diagnostic test affect whether the gold standard procedure is used to verify the test result. • It is mainly associated with test validation studies.
  • 40.
    Cont.. • In clinicalpractice, referral bias is more likely to occur when a preliminary diagnostic test is negative. Because many gold standard tests can be invasive, expensive, and carry a higher risk (eg: angiography, biopsy, surgery) ,patients and physicians may be more reluctant to undergo further workup if a preliminary test is negative.
  • 41.
    Contd.. • In cohortstudies, obtaining a gold standard test on every patient may not be ethical, practical, or cost effective. These studies can thus be subjected to verification bias. • One method to limit verification bias in clinical studies is to perform gold standard testing in a random sample of study participants.
  • 42.
  • 43.
    • The term‘confounding’ refers to the effect of an extraneous variable that entirely or partially explains the apparent association between the study exposure and the disease. • Confounding is a distortion in the estimated measure of effect due to the mixing of the effect of the study factor with the effect of other risk factors. Confounding effect may distort the true association in either direction.
  • 44.
    • In astudy of the association between exposure to a cause ( or risk factor ) and the occurrence of disease, confounding can occur when another exposure exists in the study population and is associated both with the disease and the exposure being studied.
  • 45.
    Eg- EXPOSURE DISEASE (coffeedrinking) ( heart disease ) CONFOUNDING VARIABLE (cigarette smoking)
  • 46.
    Criteria for confounders •It is the risk factor of the study disease (but it is not the concequence) • It is associated with exposure under study • It is about of interest of current study(i.e. an extraneous variables) • In the absence of exposure it indendently able to cause disease(outcome)
  • 47.
    THE CONTROL OFCONFOUNDING The method commonly used to control confounding in the design of an epidemiological study is: • Randomization • Restriction • Matching • At the analysis stage , confounding can be controlled by; • Stratification • Statistical modeling
  • 48.
    Contd… • It canbe controlled either by research design or during data analysis phase. There are three methods that can be used to control confounding during the design phase of the study: randomization, restriction and matching.
  • 49.
    •RANDOMIZATION-is applicable onlyto experimental studies, is the ideal method for ensuring that potential confounding variables are equally distributed among the groups being compared .The sample size has to be sufficiently large to avoid random misdistribution of such variables . Randomization avoids the association between potentially confounding variables and the exposure that is being considered.
  • 50.
    • RESTRICTION canbe used to limit the study to people who have particular characteristics. For Eg. In a study on the effects of coffee on coronary heart disease, participation in the study could be restricted to nonsmokers, thus removing any potential effect of confounding by cigarette smoking.
  • 51.
    • MATCHING –If matching is used to control confounding the study participants are selected so as to ensure that potential confounding variables are evenly distributed in the two groups being compared .For eg in a case – control study of exercise and coronary heart disease , each patient with heart disease can be matched with a control of the same age group and sex to ensure that confounding by age and sex does not occur.
  • 52.
    •STRATIFCATION- Confounding canbe controlled by stratification in which subject are split into groups or strata and the association between exposure and outcome of interest is then measure separately in each stratum, analysis can be done separately men and women to remove confounding by sex, for different age groups and so on. In practice, it is difficult to remove all confounding .
  • 53.
    • MODELLING- Althoughstratification is conceptually simple and relatively easy to carry out, it is often limited by the size of the study and it cannot help to control many factors simultaneously, if we want to control by age, sex, and smoking by stratification, each stratum will contain only few percent of study population and it can be difficult to obtain precise estimates of association in each.
  • 54.
    Contd… • Therefore, statisticalmodeling (multivariate) is used to control for all potential confounders while controlling for a number of confounding variables simultaneously • The most common multivariate approach for unmatched case control study is multiple logistic regression and for matched case control study is conditional logistic regression and common technique used for cohort is Cox proportional hazards regression.
  • 55.
    References Beaglehole, R., Bonita,R. & Kjellstrom, T. (2006). Basic epidemiology. Delhi : A.I.T.B.S. Rao, B. S.(2009). Essentials of Epidemiology. Delhi: A.I.T.B.S. Adhikari.S. Foundation of epidemiology.Makalu publications(2008) first edition. • http://www.umdnj.edu/idsweb/shared/biases.htm • http://www.nswphc.unsw.edu.au/pdf/ShortCourse ResMetJul06/PPts/Introductionto_biasin_research _DavidLyle.pdf • Joshi Dr A, Banjara, M. (2007). Fundamental of Epidemiology
  • 56.

Editor's Notes

  • #17 Carried out using a planned, ordered procedure Methodical, regular and orderly…individual cant control over it….Individual choice …gives inaccurate—deviated from the true result… result ….. One should follow the steps to establish the causal relationship. Sometime presence of other factors may create spurious association. If tose factors are not identified during analysis, bias occurs
  • #18 If someone studies the disease occurrence without considering duration of exposure, it may results bias.
  • #21 Selection bias is introduced by the selection of individuals, groups, or data for analysis in such a way that proper randomization is not achieved , sample obtained is not representative of the population to be analyzed.
  • #23 differences within the groups being compar.. Cases of, say diabetes or hypertension, who respond to an invitation to participate in a clinical trials are those who have already tried several drugs, and as such, are not representative of diabetes or hypertensive in general. ed and difference in changes that take place over period of time
  • #26 t In epi. Studies on school children and workers in industry probing the relationship between a factor and a disease such as protein deficiency and malnutrition in scholl children or plumbism in factory workers, selection bias arises from the fact that those suffering from malnutrition/plumbism are unlikely to be found in the school/factory.
  • #36 Teachers expectation towards good students is different .