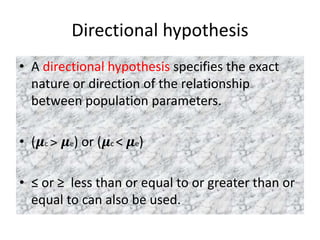
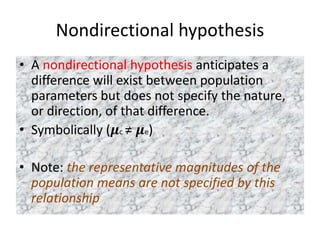
1. A statistical hypothesis represents the mathematical relationship between two or more population parameters. It can be directional, specifying the exact relationship, or nondirectional, anticipating a difference but not specifying the direction.
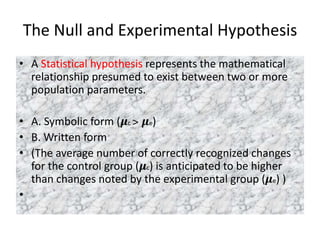
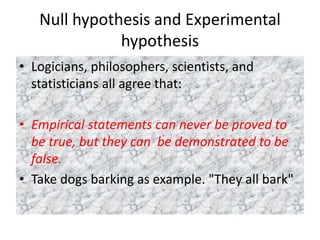
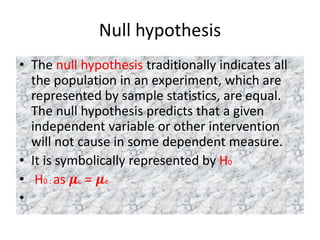
2. The null hypothesis predicts no difference between population parameters, while the alternative or experimental hypothesis predicts a difference. Through statistical testing, we can either reject the null hypothesis in favor of the alternative, or accept the null hypothesis.
3. Significance testing uses statistical tests and probabilities to determine if sample data can be used to reject the null hypothesis involving population parameters. If the difference is unlikely to have occurred by chance when the null hypothesis is true, it is considered statistically significant.