Download to read offline


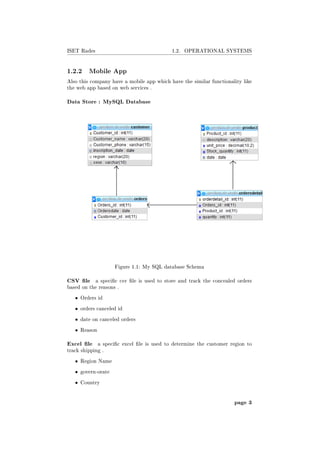


![ISET Rades 3.3. IMPLEMENTATION
Gender Changing
Figure 3.7: Changing Region
Column Pattern Value
Customer.region tn Tunis
Customer.region Tunisia Tunis
Customer.region sfx Sfax
Table 3.2: Data Quality (Regions)
Date Dimension
Figure 3.8: Date Dimension Specication
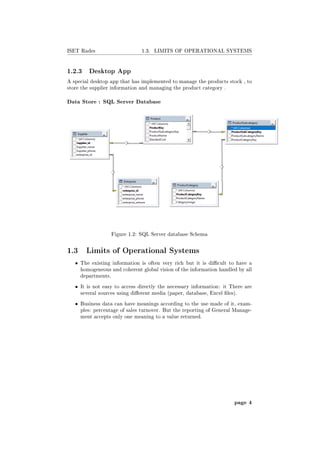
3.3.3 Transformation Throw Views
CREATE view [dbo].[fact_sales] as
select e.enterprise_id,
sp.Supplier_id,
p.products_ref,
sub_cat.ProductSubCategoryKey,
cat.ProductCategoryKey,
cs.Customer_id,
t.id_temps,
rg.region_id,
od.quantity*p.unit_price as 'cout'
page 12](https://image.slidesharecdn.com/analysisreport-200401135229/85/BI-Project-report-17-320.jpg)
![ISET Rades 3.3. IMPLEMENTATION
from enterprise e inner join supplier sp on e.enterprise_id = sp.enterprise_id
inner join
product p on p.supplier_id = sp.Supplier_id
inner join
sub_category sub_cat on p.ProductSubcategoryKey = sub_cat.ProductSubCategoryKey
inner join
category cat on sub_cat.ProductCategoryKey = cat.ProductCategoryKey
inner join
orders_full od on od.Product_id = p.ProductKey
inner join
customer cs on cs.Customer_id = od.Customer_id
inner join
dim_temps t on od.Ordersdate = t.Ordersdate
inner join
region rg on cs.region = rg.Gouvernorat
Stored procedure
USE [Talend_DW]
GO
/****** Object: StoredProcedure [dbo].[from_dim_to_fact]
Script Date: 25/12/2017 18:25:59 ******/
SET ANSI_NULLS ON
GO
SET QUOTED_IDENTIFIER ON
GO
ALTER proc [dbo].[from_dim_to_fact] as
begin
IF (EXISTS (SELECT *
FROM INFORMATION_SCHEMA.TABLES
WHERE
TABLE_NAME = 'fact'))
BEGIN
drop table fact ;
END
--Sales
select * into fact from fact_sales;
alter table fact
add foreign key (enterprise_id) references dim_enterprise(enterprise_id) ;
alter table fact
add foreign key (Supplier_id) references dim_supplier(supplier_id) ;
alter table fact
add foreign key (Customer_id) references dim_customer(Customer_id) ;
alter table fact
add foreign key (products_ref) references dim_product(products_ref) ;
alter table fact
add foreign key (ProductSubCategoryKey) references
page 13](https://image.slidesharecdn.com/analysisreport-200401135229/85/BI-Project-report-18-320.jpg)


The document provides details about a business intelligence project for a fast fashion company. It includes: 1) An overview of the company's existing operational systems like their online website, mobile app, and desktop app and the limits of these systems. 2) An analysis of the company's requirements and key metrics like KPIs and KRIs that the BI project will measure. 3) The design of the BI project using a star schema model with dimensions like products, customers, and dates. 4) Details of the implementation including the hardware/software environment, ETL process using Talend, staging the data, transforming it, and loading it into views and tables with foreign keys in SQL Server.
![Final présention [recovered]](https://cdn.slidesharecdn.com/ss_thumbnails/yiss0uyqrcoxmmtmeayl-signature-53247b4a817d4ab0915f34047a536cc6bc0c9736ef61e157e239a5d80510ea9d-poli-160609193437-thumbnail.jpg?width=640&height=640&fit=bounds)


