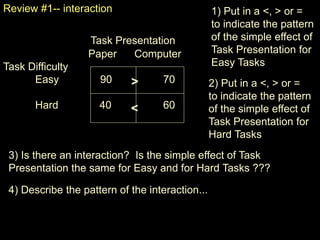
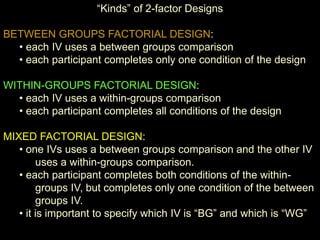
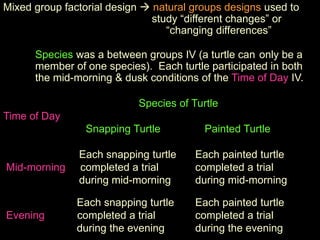
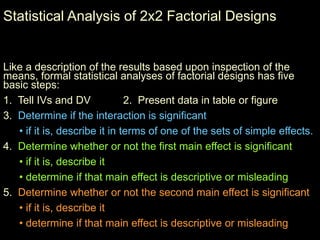
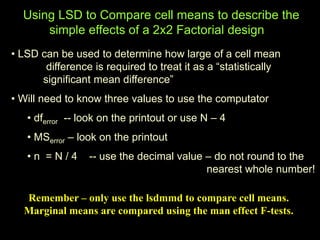
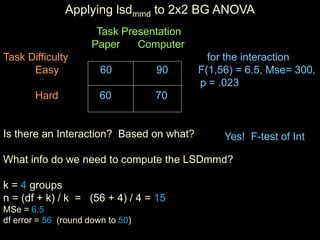
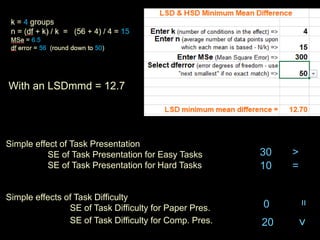
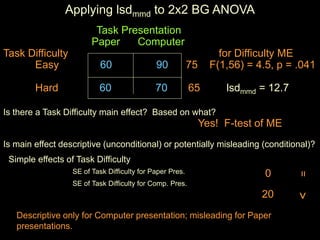
The document discusses statistical analysis of factorial designs, including 2x2 factorial designs. It covers reviewing interactions through examining simple effects and main effects. It also discusses kinds of factorial designs, including between-groups, within-groups, and mixed designs. Additionally, it provides examples of interpreting interactions and main effects, constructing F-tests, and using LSD to describe interactions by comparing cell means in 2x2 designs.
This document summarizes key concepts related to experimental and correlational research methods. It discusses the major features of experimental research, including manipulating an independent variable and measuring dependent variables. It also covers correlational research, validity types (construct, internal, external), measurement considerations, and the tradeoff between internal and external validity when generalizing from lab studies.
The document provides an overview of research methods and objectives for an AP Psychology class. It defines different types of research such as experiments, correlational studies, surveys, naturalistic observations, and case studies. It explains that research design determines reasonable conclusions that can be drawn from studies. Experiments are useful for determining cause and effect, while controls reduce alternative explanations. The document outlines chapter objectives, including describing experimentation and research methods, identifying variables, distinguishing random assignment from selection, and applying statistics. It provides a schedule of lesson topics such as the controlled experiment, research validity and reliability, and ethics.
This document provides an overview of split plot analysis of variance (ANOVA) designs. It discusses the key characteristics of split plot designs, including that one factor is between-subjects and one is within-subjects. An example split plot design studying the effects of sleep status and movies on amusement is presented. Key steps in split plot ANOVA include checking assumptions, examining main effects and interactions, and exploring significant interactions through simple main effects analyses and post hoc tests. SPSS procedures for conducting the analysis are outlined.
This document provides materials for students in PSY 315, including practice problems, assignments, and a learning team charter template. It discusses descriptive and inferential statistics, introduces hypothesis testing procedures, and provides examples of statistical analyses using measures like means, standard deviations, and Z-scores. Students are asked to complete worksheets, presentations, and a research article critique applying statistical concepts from the course.
Research plays an important role in clinical psychology by establishing an evidence base to guide practice and interventions. It provides a foundation of knowledge and tests the reliability and validity of psychological assessments. There are four main research designs: descriptive research defines the prevalence of issues; correlational research examines relationships between variables but cannot prove causation; experimental research manipulates variables to determine causation but can lack realism; and single-case designs study individuals over time. The goal is to establish cause-and-effect while eliminating threats to validity and alternative hypotheses. No single design is best and constraints may limit design options.
This document discusses research designs and their implications for causal interpretation. It covers experimental and non-experimental designs, between-group and within-group designs, and the importance of initial equivalence through random assignment and ongoing equivalence through control of confounding variables. While true experiments can potentially support causal claims, issues like failed randomization or unaccounted confounds mean their results may still not be causally interpretable. Non-experiments provide only associative evidence due to lack of experimental control.
5.1 Modules.John wants to measure self-esteem among victims of.docxevonnehoggarth79783
5.1 Modules.
John wants to measure self-esteem among victims of domestic violence before and after they complete an 8-week program for abuse victims. Could he use a repeated-measures design and t-test for this study? Why? Give John directions for how to set up his study as a repeated measures design. Be specific about who, what, when, and how. Describe a kind of measure he could use for the DV that would result in scores that are on a continuous scale of measurement. Support your responses.
5.2
John conducted his study to measure self-esteem among victims of domestic violence before and after they complete an 8-week program for abuse victims with 10 individuals. He calculated t = 1.9 from his data. He had a directional hypothesis (i.e., self-esteem would be higher after attending the program). Write up the summary of his results and his conclusion regarding his hypothesis. Mark replicated John’s experiment in every way except he used 100 women in his study. He also calculated t = 1.9 from his data. He also had the same directional hypothesis. Write up the summary of his results and his conclusion regarding his hypothesis. What observations would you make from the findings of these two studies?
.
Data File 5Chapter NineShow all workProblem 1)A skeptica.docxtheodorelove43763
This document contains 5 problems involving hypothesis testing using t-tests, chi-square tests, and ANOVA. Problem 1 involves conducting a one-sample t-test to compare student emotional responses to music clips to an established mean. Problem 2 involves conducting an independent t-test to compare eating speeds of overweight and normal-weight individuals. Problem 3 involves conducting a chi-square test to examine the relationship between parental upbringing and taking advanced math courses. Problem 4 involves conducting a one-way ANOVA to compare test scores across 3 groups. The problems require stating hypotheses, performing statistical tests in software, and interpreting results.
This document provides an overview and instructions for assignments in PSY 335 Research Methods. It includes instructions for completing an APA Code of Ethics activity in Week 1. In Week 2, students watch a video on nonexperimental research methods and complete a descriptive methods worksheet listing research methods and their advantages and disadvantages. They also complete a proposal worksheet developing a research topic as a team. Week 3 includes a quiz on experimental design and writing a methods paper discussing their proposal. Week 4 includes an experimental designs worksheet and developing an IRB application for their proposed study.
Spot The Study DesignBelow are several real results sectionsChereCheek752
Spot The Study Design
Below are several real results sections
taken
from APA
published
manuscripts. Based on the
excerpts, I want you to do a few things for each study. FIRST, identify the study design (tell me if it is correlational or experimental).
SECOND, if it is experimental, identify the independent
variable. THIRD, if it is experimental, identify the
dependent variables.
FOURTH, tell me what statistical test the author ran
and tell me
how you know they ran that specific test (that is, what features of the results
excerpt
points to it being statistical test
ABC rather than statistical test
XYZ).
FINALLY,
piece together the null and alternative hypotheses for each study excerpt.
Note
#1: In published research, authors might refer to tables for means, so you may not see them in the excerpts below!
Note #2: Sometimes the author specifically mentioned the test they ran
in the excerpt. Since I think you can spot it without being blatantly told what
test they ran, I simple deleted that info (hence the ________ in some of the paragraphs). Hope you don’t mind!
Note #3: I might have included the same kind of
study
design more than once (and omitted some of the
study
designs we covered
this semester). You are forewarned!
____________________________________________________________________________
Study One Results Section:
To measure amount of violent video game play, participants were asked to name their three favorite video games, to indicate how often they play each video game (on a scale from 1 = sometimes to 7 = very often), and to rate how violent the content of each video game was (on a scale from 1=not at all to 7=very). As in previous research (e.g., Anderson & Dill, 2000; Greitemeyer, 2014), for each video game, the frequency of game play was multiplied by violent content. These three violent video game exposure scores were then summed to provide a measure of the amount of violent video game play.
The expanded version of the Comprehensive Assessment of Sadistic Tendencies (Buckels & Paulhus, 2014) was used to assess everyday sadism, which contains 18 items. A sample item is: “I was purposely mean to some people in high school.” To measure narcissism, psychopathy, and Machiavellianism, we used the Dirty Dozen, with four items per subscale (Jonason & Webster, 2010). Sample items are: “I tend to want others to pay attention to me” (narcissism), “I have used deceit or lied to getmy way“ (Machiavellianism), and “I tend to be cynical“(psychopathy). Both sadistic tendencies and the Dark Triad items were assessed on a scale from 1 (strongly disagree) to 5 (strongly agree). To measure trait aggression, participants responded to the short version of the Buss and Perry aggression questionnaire (Bryant & Smith, 2001),which contains 12 items (e.g., “I have threatened people I know.”) These items were assessed on a scale from 1 (very unlike me) to 5 (very like me). To measure the Big 5, a brief version was employed ...
Chapter NineShow all workProblem 1)A skept.docxneedhamserena
Chapter Nine
Show all work
Problem 1)
A skeptical paranormal researcher claims that the proportion of Americans that have seen a UFO is less than 1 in every one thousand.
State the null hypothesis and the alternative hypothesis for a test of significance.
Problem 2)
At one school, the average amount of time that tenth-graders spend watching television each week is 18.4 hours.
The principal introduces a campaign to encourage the students to watch less television.
One year later, the principal wants to perform a hypothesis test to determine whether the average amount of time spent watching television per week has decreased.
Formulate the null and alternative hypotheses for the study described.
Problem 3)
A two-tailed test is conducted at the 5% significance level.
What is the P-value required to reject the null hypothesis?
Problem 4)
A two-tailed test is conducted at the 5% significance level.
What is the
right tail percentile
required to reject the null hypothesis?
Problem 5)
What is the difference between an Type I and a Type II error?
Provide an example of both.
Chapter 10
Show all work
Problem 1)
Steven collected data from 20 college students on their emotional responses to classical music.
Students listened to two 30-second segments from “The Collection from the Best of Classical Music.”
After listening to a segment, the students rated it on a scale from 1 to 10, with 1 indicating that it “made them very sad” to 10 indicating that it “made them very happy.” Steve computes the total scores from each student and created a variable called “hapsad.”
Steve then conducts a one-sample t-test on the data, knowing that there is an established mean for the publication of others that have taken this test of 6.
The following is the scores:
5.0
5.0
10.0
3.0
13.0
13.0
7.0
5.0
5.0
15.0
14.0
18.0
8.0
12.0
10.0
7.0
3.0
15.0
4.0
3.0
Conduct a one-sample t-test.
What is the t-test score?
What is the mean?
Was the test significant?
If it was significant at what P-value level was it significant?
What is your null and alternative hypothesis? Given the results did you reject or fail to reject the null and why?
(Use instructions on page 437 of your textbook, under Hypothesis Tests with the t Distribution to conduct SPSS or Excel analysis).
Problem 2)
Billie wishes to test the hypothesis that overweight individuals tend to eat faster than normal-weight individuals.
To test this hypothesis, she has two assistants sit in a McDonald’s restaurant and identify individuals who order the Big Mac special for lunch.
The Big Mackers as they become known are then classified by the assistants as overweight, normal weight, or neither overweight nor normal weight.
The assistants identify 10 overweight and 10 normal weight Big Mackers.
The assistants record the amount of time it takes them to eight the Big Mac special.
1.0
585.0
1.0
540.0
1.0
660.0
1.0
571.0
1.0
584.0
1..
This document discusses different types of experimental research designs, including between-subjects designs, within-subjects designs, and factorial designs. It provides examples of one-group posttest-only designs, one-group pretest-posttest designs, posttest-only control group designs, and pretest-posttest control group designs. It also discusses the benefits of within-subjects designs, including that each participant acts as their own control, as well as potential disadvantages like ordering and fatigue effects. Factorial designs involving more than one independent variable are introduced, along with the concepts of main effects and interaction effects.
This document provides an overview of analysis of variance (ANOVA). It begins by defining ANOVA and its historical background. It then discusses the basic concepts and assumptions of ANOVA, including comparing group means rather than variances. The document outlines why ANOVA is preferable to multiple t-tests and describes the different types of ANOVA designs including one-way, repeated measures, factorial, and mixed. It provides examples of main effects and interactions. Finally, it demonstrates how to perform one-way and factorial ANOVAs in SPSS and discusses post-hoc tests.
This document provides an overview of hypothesis testing and choosing the appropriate statistical test. It discusses types of data, research questions, and common statistical tests such as t-tests, ANOVA, regression, and their applications. The key steps in hypothesis testing are to determine the null hypothesis, state it, choose a statistical test, and use the results to either support or reject the null hypothesis. Resources for determining the right statistical test for different study designs are also provided.
Explore the essential graphic design tools and software that can elevate your creative projects. Discover industry favorites and innovative solutions for stunning design results.
Decormart Studio is widely recognized as one of the best interior designers in Bangalore, known for their exceptional design expertise and ability to create stunning, functional spaces. With a strong focus on client preferences and timely project delivery, Decormart Studio has built a solid reputation for their innovative and personalized approach to interior design.
Maximize Your Content with Beautiful Assets : Content & Asset for Landing Page pmgdscunsri
Figma is a cloud-based design tool widely used by designers for prototyping, UI/UX design, and real-time collaboration. With features such as precision pen tools, grid system, and reusable components, Figma makes it easy for teams to work together on design projects. Its flexibility and accessibility make Figma a top choice in the digital age.
Architectural and constructions management experience since 2003 including 18 years located in UAE.
Coordinate and oversee all technical activities relating to architectural and construction projects,
including directing the design team, reviewing drafts and computer models, and approving design
changes.
Organize and typically develop, and review building plans, ensuring that a project meets all safety and
environmental standards.
Prepare feasibility studies, construction contracts, and tender documents with specifications and
tender analyses.
Consulting with clients, work on formulating equipment and labor cost estimates, ensuring a project
meets environmental, safety, structural, zoning, and aesthetic standards.
Monitoring the progress of a project to assess whether or not it is in compliance with building plans
and project deadlines.
Attention to detail, exceptional time management, and strong problem-solving and communication
skills are required for this role.
Connect Conference 2022: Passive House - Economic and Environmental Solution...TE Studio
Passive House: The Economic and Environmental Solution for Sustainable Real Estate. Lecture by Tim Eian of TE Studio Passive House Design in November 2022 in Minneapolis.
- The Built Environment
- Let's imagine the perfect building
- The Passive House standard
- Why Passive House targets
- Clean Energy Plans?!
- How does Passive House compare and fit in?
- The business case for Passive House real estate
- Tools to quantify the value of Passive House
- What can I do?
- Resources
Technoblade The Legacy of a Minecraft Legend.Techno Merch
Technoblade, born Alex on June 1, 1999, was a legendary Minecraft YouTuber known for his sharp wit and exceptional PvP skills. Starting his channel in 2013, he gained nearly 11 million subscribers. His private battle with metastatic sarcoma ended in June 2022, but his enduring legacy continues to inspire millions.
ARENA - Young adults in the workplace (Knight Moves).pdfKnight Moves
Presentations of Bavo Raeymaekers (Project lead youth unemployment at the City of Antwerp), Suzan Martens (Service designer at Knight Moves) and Adriaan De Keersmaeker (Community manager at Talk to C)
during the 'Arena • Young adults in the workplace' conference hosted by Knight Moves.
Visual Style and Aesthetics: Basics of Visual Design
Visual Design for Enterprise Applications
Range of Visual Styles.
Mobile Interfaces:
Challenges and Opportunities of Mobile Design
Approach to Mobile Design
Patterns
Fonts play a crucial role in both User Interface (UI) and User Experience (UX) design. They affect readability, accessibility, aesthetics, and overall user perception.
Storytelling For The Web: Integrate Storytelling in your Design ProcessChiara Aliotta
In this slides I explain how I have used storytelling techniques to elevate websites and brands and create memorable user experiences. You can discover practical tips as I showcase the elements of good storytelling and its applied to some examples of diverse brands/projects..
EASY TUTORIAL OF HOW TO USE CAPCUT BY: FEBLESS HERNANEFebless Hernane
CapCut is an easy-to-use video editing app perfect for beginners. To start, download and open CapCut on your phone. Tap "New Project" and select the videos or photos you want to edit. You can trim clips by dragging the edges, add text by tapping "Text," and include music by selecting "Audio." Enhance your video with filters and effects from the "Effects" menu. When you're happy with your video, tap the export button to save and share it. CapCut makes video editing simple and fun for everyone!
EASY TUTORIAL OF HOW TO USE CAPCUT BY: FEBLESS HERNANE
bgfact_stat.ppt
1. Statistical Analysis of Factorial
Designs
Review of Interactions
Kinds of Factorial Designs
Causal Interpretability of Factorial Designs
The F-tests of a Factorial ANOVA
Using LSD to describe the pattern of an interaction
2. Review #1-- interaction
Task Presentation
Paper Computer
Task Difficulty
Easy 90 70
Hard 40 60
1) Put in a <, > or =
to indicate the pattern
of the simple effect of
Task Presentation for
Easy Tasks
2) Put in a <, > or =
to indicate the pattern
of the simple effect of
Task Presentation for
Hard Tasks
3) Is there an interaction? Is the simple effect of Task
Presentation the same for Easy and for Hard Tasks ???
4) Describe the pattern of the interaction...
>
>
3. Review #1-- 1st main effects
Task Presentation
Paper Computer
Task Difficulty
Easy 90 70
Hard 40 60
1) Compute the marginal
means for Task
Presentation.
3) Is there a main effect of
Task Presentation ???
4) Is the pattern of the main effect for Task Presentation descriptive or
potentially misleading (is the pattern of the main effect or Task Presentation
the same as the patterns of the simple main effects of Task Presentations for
both Easy and Hard Tasks) ?
2) Put in a <, > or = to
indicate the pattern of the
main effect of Task
Presentation
5) Describe the main effect
65 65
=
>
>
4. Review #1-- 2nd main effects
Task Presentation
Paper Computer
Task Difficulty
Easy 90 70
Hard 40 60
1) Compute the marginal
means for Task Difficulty
3) Is there a main effect of
Task Difficulty ???
4) Is the pattern of the main effect of Task Difficulty descriptive or potentially
misleading (is the pattern of the main effect or Task Difficulty the same as the
patterns of the simple main effects of Task Difficulty for both Computer and
Paper Presentations) ?
2) Put in a <, > or = to
indicate the pattern of the
main effect of Task
Difficulty
5) Describe the main effect
80
50
>
>
>
5. “Kinds” of 2-factor Designs
BETWEEN GROUPS FACTORIAL DESIGN:
• each IV uses a between groups comparison
• each participant completes only one condition of the design
WITHIN-GROUPS FACTORIAL DESIGN:
• each IV uses a within-groups comparison
• each participant completes all conditions of the design
MIXED FACTORIAL DESIGN:
• one IVs uses a between groups comparison and the other IV
uses a within-groups comparison.
• each participant completes both conditions of the within-
groups IV, but completes only one condition of the between
groups IV.
• it is important to specify which IV is “BG” and which is “WG”
6. Between groups factorial design experimental or natural grps
designs used to study “differences”
Each participant is in only one condition, having a particular
combination of Initial Diagnosis and Type of Treatment.
Type of Treatment
Initial Diagnosis
Individual Group
Therapy Therapy
Clients diagnosed Clients diagnosed
Depression as depressed who as depressed who
are treated with are treated with
individual therapy group therapy
Clients diagnosed Clients diagnosed
Social Anxiety with social anxiety with social anxiety
who are treated with who are treated with
individual therapy group therapy
7. Mixed group factorial design natural groups designs used to
study “different changes” or
“changing differences”
Species was a between groups IV (a turtle can only be a
member of one species). Each turtle participated in both
the mid-morning & dusk conditions of the Time of Day IV.
Species of Turtle
Time of Day
Snapping Turtle Painted Turtle
Each snapping turtle Each painted turtle
Mid-morning completed a trial completed a trial
during mid-morning during mid-morning
Each snapping turtle Each painted turtle
Evening completed a trial completed a trial
during the evening during the evening
8. Mixed group factorial design experimental designs used to
increase data collection efficiency
or statistical power
Type of Evidence was a between groups IV -- people can’t
read the “same study” twice & give independent ratings. Each
participant rated the guilt of both Defendants -- a within-groups IV
--as they would in this type of case.
Type of Evidence
Defendant
DNA Eye Witness
Major Actor DNA evidence was An eye witness testified
presented against to seeing the major
the major actor commit the crime
Conspirator DNA evidence was An eye witness testified
presented against to seeing the conspirator
the conspirator commit the crime
9. Within-groups factorial design – experimental designs used to
increase data collection efficiency
or statistical power
Each participant completed four trials, one of each
combination of Retention Interval and Word Type.
Retention Interval
Word Type
Immediate Test Delayed Test
The test was given The test was given
Familiar immediately after the 5 minutes after the
study of a list of study of a list of
40 familiar words. 40 familiar words.
The test was given The test was given
Unfamiliar immediately after the 5 minutes after the
study of a list of study of a list of
40 unfamiliar words. 40 unfamiliar words.
10. Within-groups factorial design – natural designs to study
“changing changes”
Each participant was observed in both School & Home (WG)
settings both when they were 12 &16 (WG)
Age
Setting
12 years old 16 years old
School Participants were Participants were
observed in a school observed in a school
setting at age 12. setting at age 16.
Home Participants were Participants were
observed in a home observed in a home
setting at age 12. setting at age 16.
11. Practice Identifying Types of Factorial Designs - answers next page
The purpose of the study was to examine the possible influence of two
variables upon maze-learning by rats, length of the maze (either 10 feet or 30
feet) and the size of the reward (either 1sugar pellet or 5 sugar pellets).
Here are three “versions” of the study tell which is BG, WG & MG
a. Each rat completed one trial. Each was assigned to either
the longer or the shorter maze, and also assigned to receive
either 1 or 5 sugar pellets upon completing the maze.
b. Each rat completed two trials in either the longer or the
shorter maze. Following one trial in the assigned maze, each
received 1 pellet reward, after the other trial they received the
5 pellets.
c. Each rat completed four trials, two in the shorter maze and
two in the longer maze. Each received 1 pellet after one of the
short-maze trials and 5 pellets after the other, and also 1
pellet after one of the long-maze trials and 5 pellets after the
BG
MG
WG
12. Another Example -- 3 versions of the same study
The researcher wanted to investigate infant's startle responses
to loud sounds. The two variables of interest were the Position
of the Sound (in front of versus behind the infant) and the Type
of Sound (a hand-clap versus deep male voice saying "Hey").
Here are three “versions” of the study tell which is BG, WG & MG
a. Each infant completed trials all involving a hand-clap or
all involving the voice saying "Hey". During some of the trials, the
appropriate type of sound was made in front of the infant. During
other trials, the appropriate type of sound was made behind the infant.
b. Each infant had some trials during which the sound was made in
front of then and some during which the sound was made behind them.
Some of the sounds were the hand-clap and the others were the voice
saying "Hey".
c. Each infant always heard either the hand-clap or the “Hey”, and
whatever sound they heard was always played either in front of them
or behind them.
BG
MG
WG
13. Remember about the causal interpretation of effects
of a factorial design
Start by assessing the causal interpretability of each main effect
Remember, in order to causally interpret an interaction, you must be able to
casually interpret BOTH main effects.
For each of the following: Tell the IVs and tell what effects could be causally
interpreted (assuming proper RA, IV manip. and confound control were used):
1. Male and female participants who were African
American, Mexican American, or European American
were asked to complete a questionnaire about
satisfaction with their Senators.
2. Children played with either a toy gun, a toy car or a
puzzle, some while their parents were in the room and
some not. The DV was the amount of aggressive
behavior they exhibited.
3. Participants played with either a simple puzzle or a
complex puzzle in pairs made up of two boys, two girls
or one boy & one girl.
zilcho-causo
Puzzle type
only.
All three !
14. Statistical Analysis of 2x2 Factorial Designs
Like a description of the results based upon inspection of the
means, formal statistical analyses of factorial designs has five
basic steps:
1. Tell IVs and DV 2. Present data in table or figure
3. Determine if the interaction is significant
• if it is, describe it in terms of one of the sets of simple effects.
4. Determine whether or not the first main effect is significant
• if it is, describe it
• determine if that main effect is descriptive or misleading
5. Determine whether or not the second main effect is significant
• if it is, describe it
• determine if that main effect is descriptive or misleading
15. Interpreting Factorial Effects
Important things to remember:
• main effects and the interaction are 3 separate effects each must
be separately interpreted -- three parts to the “story”
• most common error -- “interaction is different main effects”
• best thing -- be sure to carefully separate the three parts of
the story and tell each completely
• Be careful of “causal words” when interpreting main effects and
interactions (only use when really appropriate).
• caused, effected influenced, produced, changed ….
• Consider more than the “significance”
• consider effect sizes, confidence intervals, etc. when
describing the results
16. Statistical Analysis of a 2x2 Design
Task Presentation (a) SE of Presentation
Paper Computer for Easy Tasks
Task Difficulty (b)
Easy 90 70 80
Hard 40 60 50
65 65 SE for Presentation
for Hard Tasks
Presentation Difficulty Interaction
Main Effect Main Effect Effect
SSPresentation SSDificulty SSInteraction
65 vs. 65 80 vs. 50 SEEasy vs. SEHard
18. In a 2x2 Design, the Main effects F-tests are sufficient to tell us
about the relationship of each IV to the DV…
• since each main effect involves the comparison of two
marginal means -- the corresponding significance test tells
us what we need to know …
• whether or not those two marginal means are
“significantly different”
• Don’t forget to examine the means to see if a significant
difference is in the hypothesized direction !!!
Statistical Analyses Necessary to
Describe Main Effects of a 2x2 Design
19. However, the F-test of the interaction only tells us whether or not
there is a “statistically significant” interaction…
• it does not tell use the pattern of that interaction
• to determine the pattern of the interaction we have to
compare the simple effects
• to describe each simple effect, we must be able to compare
the cell means
we need to know how much of a cell mean
difference is “statistically significant”
Statistical Analyses Necessary to Describe the
Interaction of a 2x2 Design
20. Using LSD to Compare cell means to describe the
simple effects of a 2x2 Factorial design
• LSD can be used to determine how large of a cell mean
difference is required to treat it as a “statistically
significant mean difference”
• Will need to know three values to use the computator
• dferror -- look on the printout or use N – 4
• MSerror – look on the printout
• n = N / 4 -- use the decimal value – do not round to the
nearest whole number!
Remember – only use the lsdmmd to compare cell means.
Marginal means are compared using the man effect F-tests.
21. Applying lsdmmd to 2x2 BG ANOVA
Task Presentation
Paper Computer
Task Difficulty for the interaction
Easy 60 90 F(1,56) = 6.5, Mse= 300,
p = .023
Hard 60 70
Is there an Interaction? Based on what?
What info do we need to compute the LSDmmd?
k = 4 groups
n = (df + k) / k = (56 + 4) / 4 = 15
MSe = 6.5
df error = 56 (round down to 50)
Yes! F-test of Int
22. Simple effect of Task Presentation
SE of Task Presentation for Easy Tasks
SE of Task Presentation for Hard Tasks
Simple effects of Task Difficulty
SE of Task Difficulty for Paper Pres.
SE of Task Difficulty for Comp. Pres.
30 >
10 =
0
>
20
With an LSDmmd = 12.7
23. Applying lsdmmd to 2x2 BG ANOVA
Task Presentation
Paper Computer
Task Difficulty for Difficulty ME
Easy 60 90 75 F(1,56) = 4.5, p = .041
Hard 60 70 65 lsdmmd = 12.7
Is there a Task Difficulty main effect? Based on what?
Is main effect descriptive (unconditional) or potentially misleading (conditional)?
Simple effects of Task Difficulty
SE of Task Difficulty for Paper Pres.
SE of Task Difficulty for Comp. Pres.
Yes! F-test of ME
Descriptive only for Computer presentation; misleading for Paper
presentations.
0
>
20
24. Applying lsdmmd to 2x2 BG ANOVA
Task Presentation
Paper Computer
Task Difficulty for Presentation ME
Easy 60 90 F(1,56) = 7.2, p = .011
Hard 60 70 lsdmmd = 12.7
60 80
Is there a Task Difficulty main effect? Based on what?
Is main effect descriptive (unconditional) or potentially misleading (conditional)?
Simple effects of Task Difficulty
SE of Task Presentation for Easy Tasks
SE of Task Presentation for Hard Tasks
Yes! F-test of ME
Descriptive only for Easy tasks; misleading for Difficult tasks.
30 <
10 =
25. Effect Sizes for 2x2 BG Factorial designs
For Main Effects & Interaction (each w/ df=1)
r = [ F / (F + dferror)]
For Main Effects & Simple Effects
d = (M1 - M2 ) / Mserror
d²
r = ----------
d² + 4 (This is an “approximation formula”)