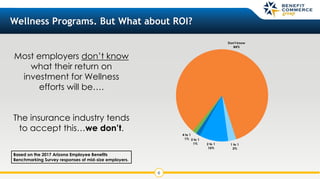
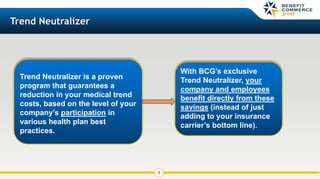
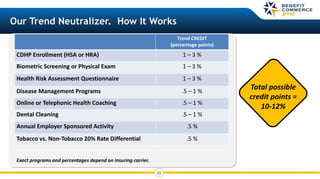
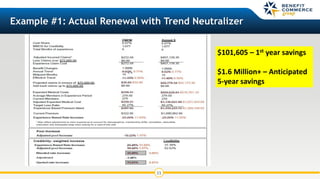
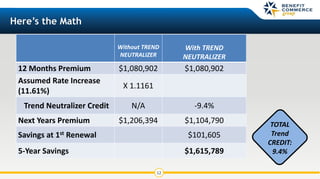
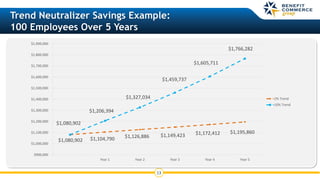
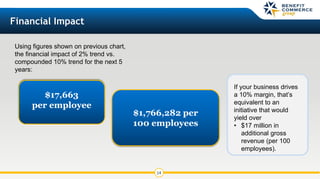
A Health Plan Strategy
that
Guarantees Savings
2
Proven Strategy. Predictable Results.
Do your renewal meetings normally start like this?
“Well, healthcare costs continue to rise….”
For most companies,
healthcare costs are
the 2nd or 3rd largest
item on their income
statement.
RAND Corporation:
10 years of family income
growth have been WIPED OUT
by increased employee medical
plan contributions & benefit
reductions.
Then,
consider these facts:
• It’s called “credibility.”
• Your claims improved, so you expect a significant ROI, but you are not the beneficiary of the
improvement. Here’s why:
3
The Challenge
for Mid-Sized Employers
Average Number of Members
“Credibility” Based on
Months of Claims Experience
1st Renewal 2nd Renewal
50-74 0% 25%
100-149 31% 35%
200-299 43% 50%
400-499 58% 67%
1000-1099 89% 100%
4
The Devastating Impact of Compounding Trend
646% Increase in Medical Costs 1995-2016
How have most companies
addressed this?
• Reduce benefits, increase
employee contributions,
absorb more costs in
corporate budget.
• This has translated into
employee pay cuts and
reduced capital for business
investment.
Simply due to trend.$0
$1,000
$2,000
$3,000
$4,000
$5,000
$6,000
$7,000
$8,000
$9,000
$10,000
$11,000
5
Size Matters
Large
Employers
•Only have to worry about improving their
claims experience
•Fully credible
Small to
Mid-Size
Employers
•Have to improve claims AND reduce their trend
factor
•Can’t achieve fully credible status
•But are told they can’t do anything about trend
6
Wellness Programs. But What about ROI?
Most employers don’t know
what their return on
investment for Wellness
efforts will be….
The insurance industry tends
to accept this…we don’t.
Based on the 2017 Arizona Employee Benefits
Benchmarking Survey responses of mid-size employers.
7
What If….
WHAT IF
Wellness programs were viewed
like safety programs are for your
workers compensation rates?
WHAT IF you had a 100% GUARANTEE of
return for your wellness efforts?
AND…
• If you do a lot of safety training and have detailed safety policies and procedures,
you expect that to be reflected in your premium rates for workers compensation
insurance, right?
• You have a lot of safety awareness and efforts.
• Another company similar to yours does not.
>>> You get a lower premium rate for workers comp.
• Would you run your company without a safety program?
• Why would you run your health plan without wellness programs?
• Is it right for your company to invest time in wellness programs
and NOT receive financial benefit?
8
The Parallel to Workers Comp Rates
9
Trend Neutralizer
Trend Neutralizer is a proven
program that guarantees a
reduction in your medical trend
costs, based on the level of your
company’s participation in
various health plan best
practices.
With BCG’s exclusive
Trend Neutralizer, your
company and employees
benefit directly from these
savings (instead of just
adding to your insurance
carrier’s bottom line).
10
Our Trend Neutralizer. How It Works
Total possible
credit points =
10-12%
Trend CREDIT
(percentage points)
CDHP Enrollment (HSA or HRA) 1 – 3 %
Biometric Screening or Physical Exam 1 – 3 %
Health Risk Assessment Questionnaire 1 – 3 %
Disease Management Programs .5 – 1 %
Online or Telephonic Health Coaching .5 – 1 %
Dental Cleaning .5 – 1 %
Annual Employer Sponsored Activity .5 %
Tobacco vs. Non-Tobacco 20% Rate Differential .5 %
Exact programs and percentages depend on insuring carrier.
11
Example #1: Actual Renewal with Trend Neutralizer
$101,605 – 1st year savings
$1.6 Million+ – Anticipated
5-year savings
12
Here’s the Math
Without TREND
NEUTRALIZER
With TREND
NEUTRALIZER
12 Months Premium $1,080,902 $1,080,902
Assumed Rate Increase
(11.61%)
X 1.1161
Trend Neutralizer Credit N/A -9.4%
Next Years Premium $1,206,394 $1,104,790
Savings at 1st Renewal $101,605
5-Year Savings $1,615,789
TOTAL
Trend
CREDIT:
9.4%
13
Trend Neutralizer Savings Example:
100 Employees Over 5 Years
$1,080,902 $1,104,790 $1,126,886 $1,149,423 $1,172,412 $1,195,860
$1,080,902
$1,206,394
$1,327,034
$1,459,737
$1,605,711
$1,766,282
$900,000
$1,000,000
$1,100,000
$1,200,000
$1,300,000
$1,400,000
$1,500,000
$1,600,000
$1,700,000
$1,800,000
$1,900,000
Year 1 Year 2 Year 3 Year 4 Year 5
2% Trend
10% Trend
14
Financial Impact
If your business drives
a 10% margin, that’s
equivalent to an
initiative that would
yield over
• $17 million in
additional gross
revenue (per 100
employees).
Using figures shown on previous chart,
the financial impact of 2% trend vs.
compounded 10% trend for the next 5
years:
$17,663
per employee
$1,766,282 per
100 employees
15
Benefit Commerce Group’s Trend Neutralizer
PROVEN PREDICTABLE
See actual client success stories.
GUARANTEED
You CAN combat the inevitable medical inflation trend curve. We will GUARANTEE it.
--Some will tell you that what we are describing is not possible.
--HOWEVER, our 33 clients who have saved $55 million over the past 5 years would say otherwise.

Benefit Commerce Groups Neutralizer-Health Plan Strategy

  • 1.
    A Health PlanStrategy that Guarantees Savings
  • 2.
    2 Proven Strategy. PredictableResults. Do your renewal meetings normally start like this? “Well, healthcare costs continue to rise….” For most companies, healthcare costs are the 2nd or 3rd largest item on their income statement. RAND Corporation: 10 years of family income growth have been WIPED OUT by increased employee medical plan contributions & benefit reductions. Then, consider these facts:
  • 3.
    • It’s called“credibility.” • Your claims improved, so you expect a significant ROI, but you are not the beneficiary of the improvement. Here’s why: 3 The Challenge for Mid-Sized Employers Average Number of Members “Credibility” Based on Months of Claims Experience 1st Renewal 2nd Renewal 50-74 0% 25% 100-149 31% 35% 200-299 43% 50% 400-499 58% 67% 1000-1099 89% 100%
  • 4.
    4 The Devastating Impactof Compounding Trend 646% Increase in Medical Costs 1995-2016 How have most companies addressed this? • Reduce benefits, increase employee contributions, absorb more costs in corporate budget. • This has translated into employee pay cuts and reduced capital for business investment. Simply due to trend.$0 $1,000 $2,000 $3,000 $4,000 $5,000 $6,000 $7,000 $8,000 $9,000 $10,000 $11,000
  • 5.
    5 Size Matters Large Employers •Only haveto worry about improving their claims experience •Fully credible Small to Mid-Size Employers •Have to improve claims AND reduce their trend factor •Can’t achieve fully credible status •But are told they can’t do anything about trend
  • 6.
    6 Wellness Programs. ButWhat about ROI? Most employers don’t know what their return on investment for Wellness efforts will be…. The insurance industry tends to accept this…we don’t. Based on the 2017 Arizona Employee Benefits Benchmarking Survey responses of mid-size employers.
  • 7.
    7 What If…. WHAT IF Wellnessprograms were viewed like safety programs are for your workers compensation rates? WHAT IF you had a 100% GUARANTEE of return for your wellness efforts? AND…
  • 8.
    • If youdo a lot of safety training and have detailed safety policies and procedures, you expect that to be reflected in your premium rates for workers compensation insurance, right? • You have a lot of safety awareness and efforts. • Another company similar to yours does not. >>> You get a lower premium rate for workers comp. • Would you run your company without a safety program? • Why would you run your health plan without wellness programs? • Is it right for your company to invest time in wellness programs and NOT receive financial benefit? 8 The Parallel to Workers Comp Rates
  • 9.
    9 Trend Neutralizer Trend Neutralizeris a proven program that guarantees a reduction in your medical trend costs, based on the level of your company’s participation in various health plan best practices. With BCG’s exclusive Trend Neutralizer, your company and employees benefit directly from these savings (instead of just adding to your insurance carrier’s bottom line).
  • 10.
    10 Our Trend Neutralizer.How It Works Total possible credit points = 10-12% Trend CREDIT (percentage points) CDHP Enrollment (HSA or HRA) 1 – 3 % Biometric Screening or Physical Exam 1 – 3 % Health Risk Assessment Questionnaire 1 – 3 % Disease Management Programs .5 – 1 % Online or Telephonic Health Coaching .5 – 1 % Dental Cleaning .5 – 1 % Annual Employer Sponsored Activity .5 % Tobacco vs. Non-Tobacco 20% Rate Differential .5 % Exact programs and percentages depend on insuring carrier.
  • 11.
    11 Example #1: ActualRenewal with Trend Neutralizer $101,605 – 1st year savings $1.6 Million+ – Anticipated 5-year savings
  • 12.
    12 Here’s the Math WithoutTREND NEUTRALIZER With TREND NEUTRALIZER 12 Months Premium $1,080,902 $1,080,902 Assumed Rate Increase (11.61%) X 1.1161 Trend Neutralizer Credit N/A -9.4% Next Years Premium $1,206,394 $1,104,790 Savings at 1st Renewal $101,605 5-Year Savings $1,615,789 TOTAL Trend CREDIT: 9.4%
  • 13.
    13 Trend Neutralizer SavingsExample: 100 Employees Over 5 Years $1,080,902 $1,104,790 $1,126,886 $1,149,423 $1,172,412 $1,195,860 $1,080,902 $1,206,394 $1,327,034 $1,459,737 $1,605,711 $1,766,282 $900,000 $1,000,000 $1,100,000 $1,200,000 $1,300,000 $1,400,000 $1,500,000 $1,600,000 $1,700,000 $1,800,000 $1,900,000 Year 1 Year 2 Year 3 Year 4 Year 5 2% Trend 10% Trend
  • 14.
    14 Financial Impact If yourbusiness drives a 10% margin, that’s equivalent to an initiative that would yield over • $17 million in additional gross revenue (per 100 employees). Using figures shown on previous chart, the financial impact of 2% trend vs. compounded 10% trend for the next 5 years: $17,663 per employee $1,766,282 per 100 employees
  • 15.
    15 Benefit Commerce Group’sTrend Neutralizer PROVEN PREDICTABLE See actual client success stories. GUARANTEED You CAN combat the inevitable medical inflation trend curve. We will GUARANTEE it. --Some will tell you that what we are describing is not possible. --HOWEVER, our 33 clients who have saved $55 million over the past 5 years would say otherwise.