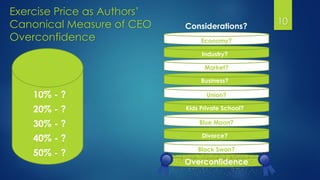
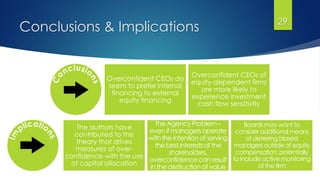
The document summarizes research on how managerial overconfidence can influence corporate investment decisions. Specifically, it discusses two studies conducted by the authors.
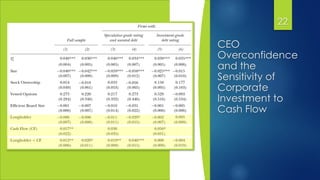
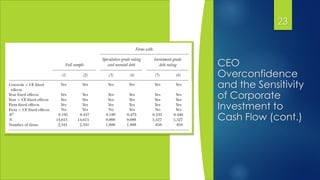
The first study examines whether the investment of overconfident CEOs is more sensitive to the availability of internal cash flow compared to less overconfident CEOs. The authors predict this will be the case and that the effect will be more pronounced for equity-dependent firms. The study uses regression analysis of financial data from Compustat and CRSP databases to test this prediction.
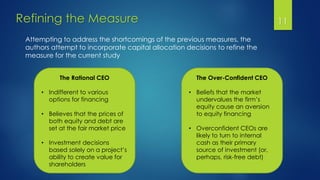
The second study aims to address criticisms of endogeneity in the first study by examining how overconfident CEOs' investment responds to an exogenous shock that impacts debt financing availability. The prediction is


![BF 16-02-24 about business managemant [Autosaved].pptx](https://cdn.slidesharecdn.com/ss_thumbnails/bf16-02-24autosaved-250416172554-5d0721b3-thumbnail.jpg?width=640&height=640&fit=bounds)


