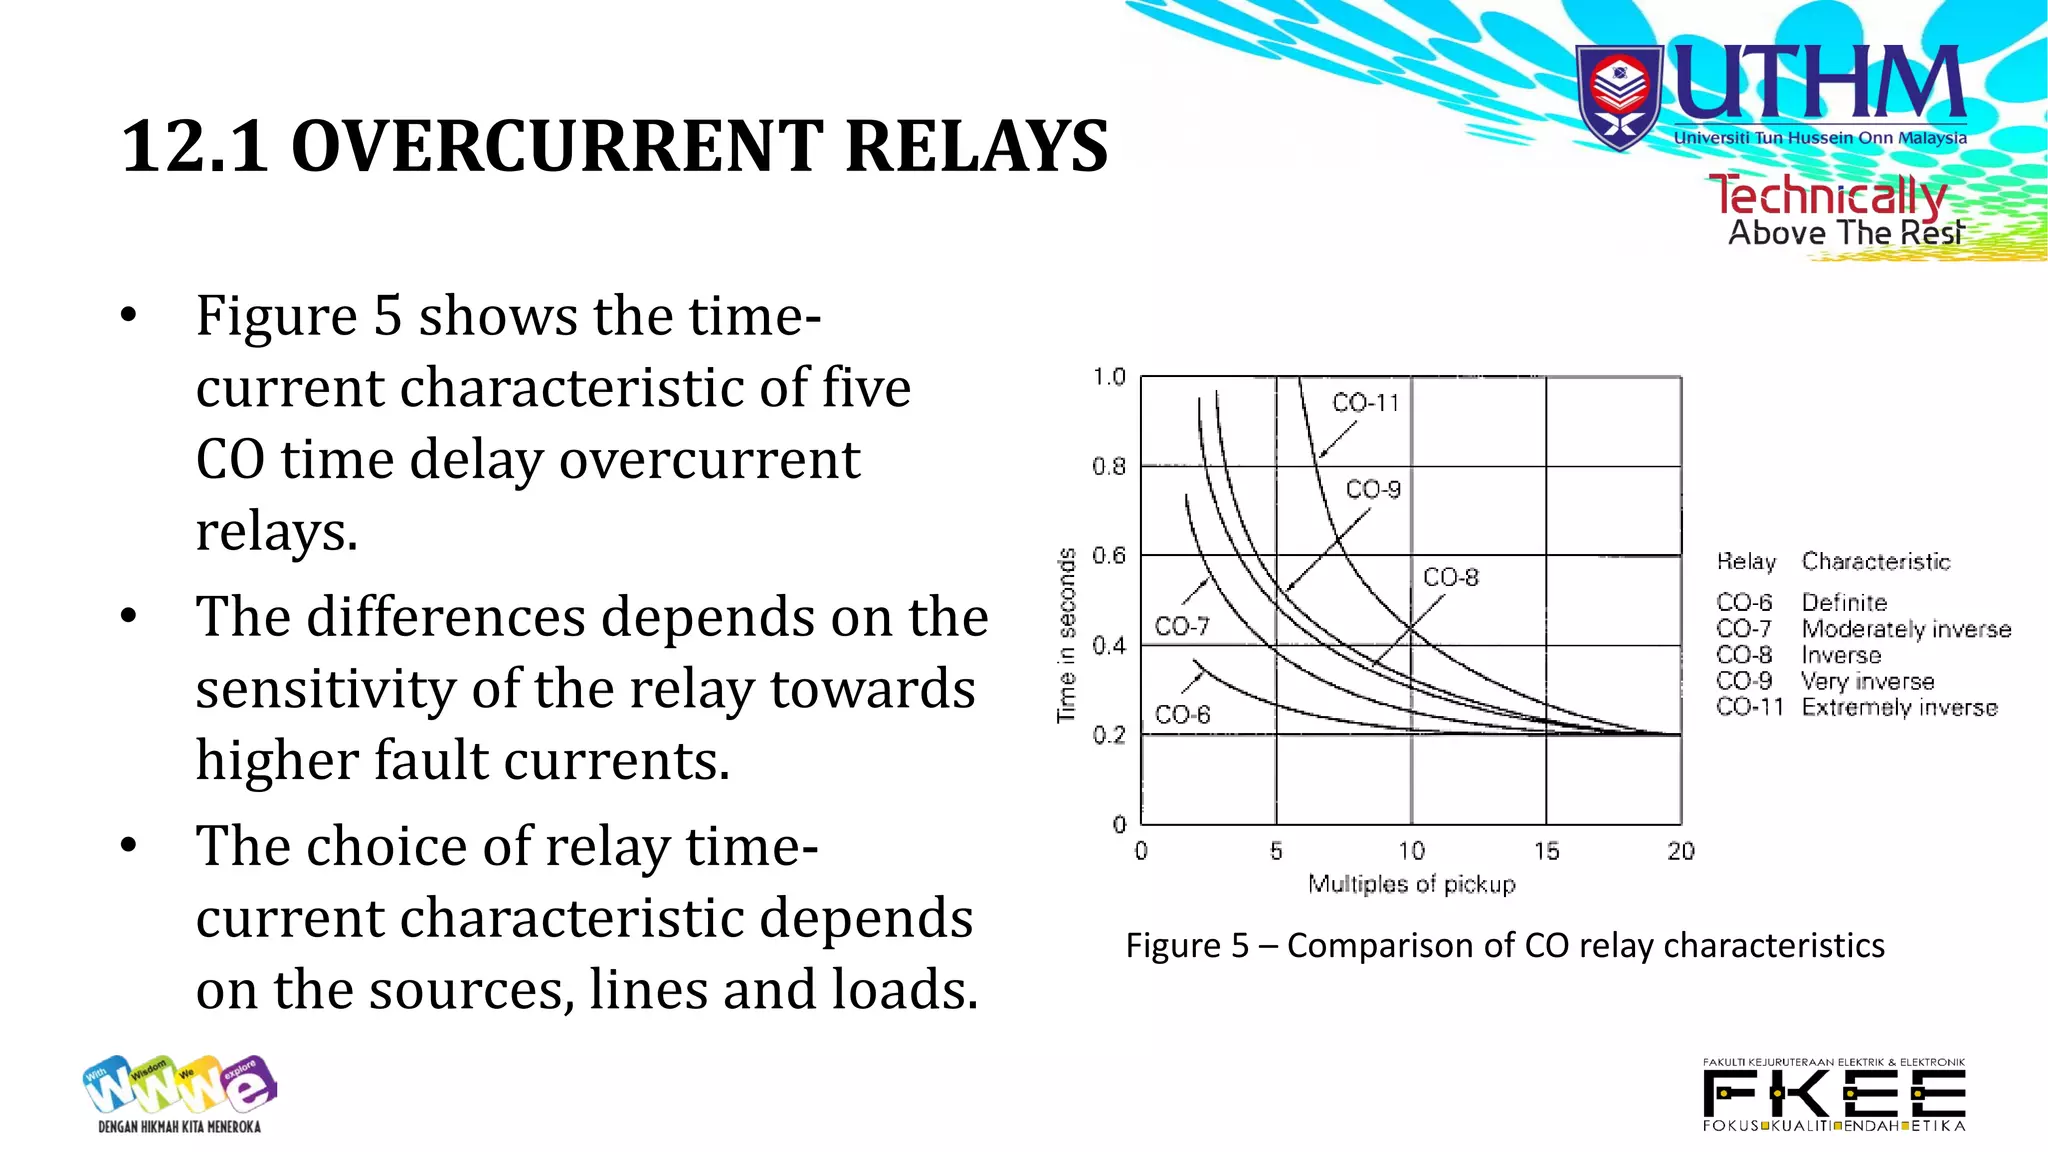
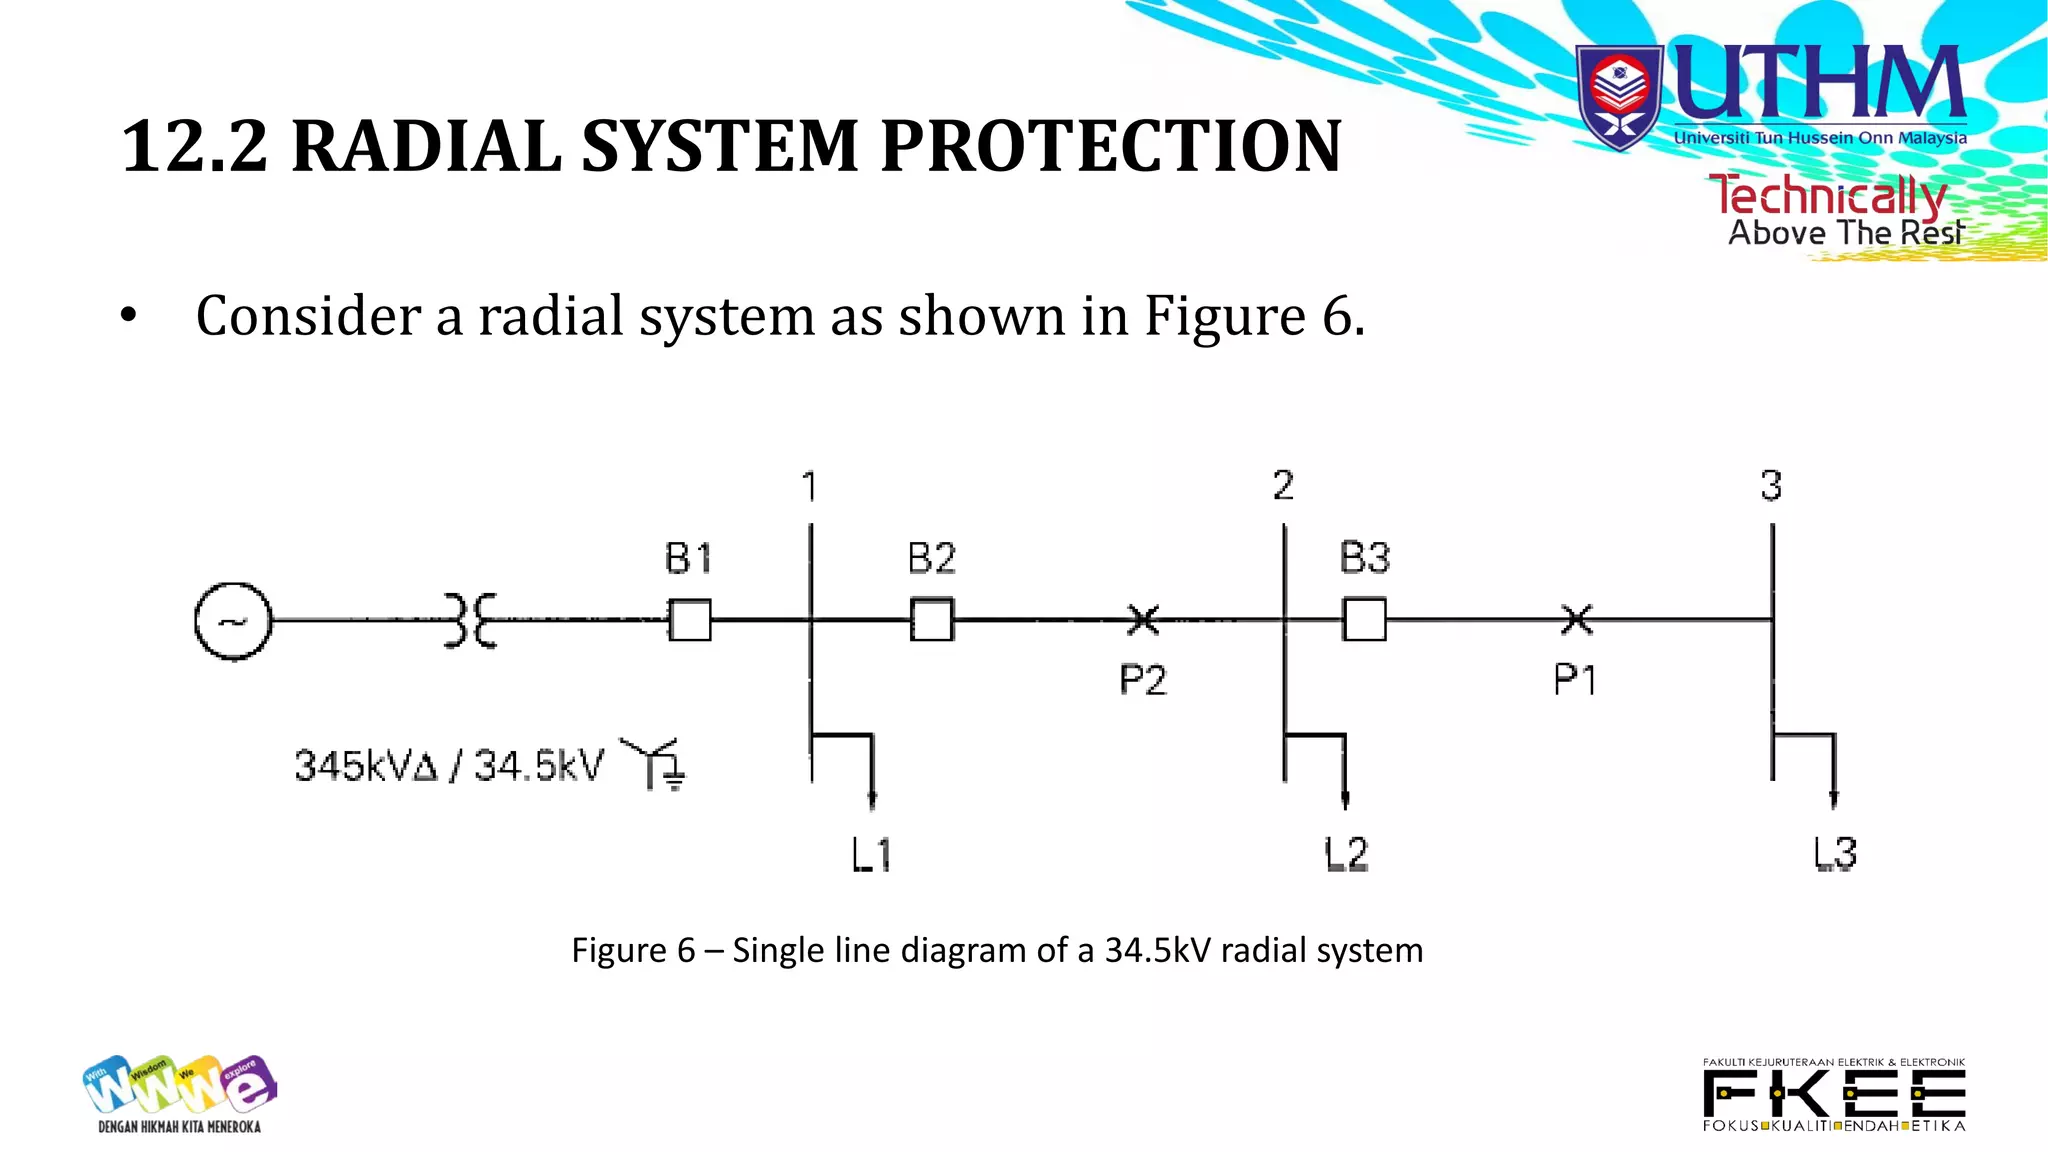
BEF43303
POWER SYSTEM ANALYSIS AND PROTECTION
WEEK 12
OVERCURRENT PROTECTION
12.0 CONTENTS
12.1 Overcurrent relays
12.2 Radial system protection
12.1 OVERCURRENT RELAYS
• Figure 1 shows an overcurrent
protection scheme.
• It shows that the CT secondary
current 𝐼𝐼𝐼 is the input to the
overcurrent relay operating
coil.
Figure 1 – An overcurrent protection scheme
12.1 OVERCURRENT RELAYS
• An instantaneous overcurrent
relays respond to the
magnitude of input current.
• Figure 2 shows the trip and
block regions of an
instantaneous overcurrent
relay.
• 𝐼𝐼𝐼 > 𝐼𝐼𝑝𝑝 (pickup current) →
relay contact close → CB trip
coil energized, instantaneously.
Figure 2 – An instantaneous overcurrent relay block
and trip regions
12.1 OVERCURRENT RELAYS
• Time-delay overcurrent relays
respond to the magnitude of
input current, with an
intentional time delay.
• Figure 3 shows the
characteristics of this relay.
• For smaller multiples of
pickup, the relay trips after a
longer time delay.
Figure 3 – Time delay overcurrent relay block
and trip region
12.1 OVERCURRENT RELAYS
• Typically, overcurrent relays have two settings:
 Current-tap setting: The pickup current in amperes.
 Time-dial setting: The adjustable amount of time delay.
• The characteristic curves are usually shown with the operating time
delay in second versus relay input current as a multiple of the
pickup current as shown in Figure 4.
• The inverse time characteristic can be shifted up and down by
adjusting the time-dial setting.
12.1 OVERCURRENT RELAYS
Figure 4 – CO-8 time-delay overcurrent relay characteristic
12.1 OVERCURRENT RELAYS
Example 1
The CO-8 relay with a current tap setting of 6 amperes and a time-dial
setting of 1 is used with the 100:5 CT. Determine the relay operating
time for each of the following cases.
a) 𝐼𝐼𝐼 = 5𝐴𝐴 (Ans.: Relay does not operate)
b) 𝐼𝐼𝐼 = 8𝐴𝐴 (Ans.: 6s)
c) 𝐼𝐼𝐼 = 15𝐴𝐴 (Ans.: 1.2s)
12.1 OVERCURRENT RELAYS
• Figure 5 shows the time-
current characteristic of five
CO time delay overcurrent
relays.
• The differences depends on the
sensitivity of the relay towards
higher fault currents.
• The choice of relay time-
current characteristic depends
on the sources, lines and loads.
Figure 5 – Comparison of CO relay characteristics
12.2 RADIAL SYSTEM PROTECTION
• Typically, radial system are protected by time-delay overcurrent
relays.
• Adjustable time delays are selected such that the breaker closest to
the fault opens, while other upstream breakers with larger time
delays remain closed.
• The relays are coordinated to operate in sequence so as to interrupt
minimum load during faults.
• Coordination of overcurrent relays usually limits the maximum
number of breakers in a radial system to five or less.
12.2 RADIAL SYSTEM PROTECTION
• Consider a radial system as shown in Figure 6.
Figure 6 – Single line diagram of a 34.5kV radial system
12.2 RADIAL SYSTEM PROTECTION
• The coordination time interval is the time interval between the
primary and remote backup protective device.
• Precise determination of relay operating time is difficult due to
several factors such as:
 CT errors.
 DC offset component of fault current.
 Relay overtravel.
• Thus, typical coordination time intervals from 0.2 to 0.5s are
selected to account for these factors.
12.2 RADIAL SYSTEM PROTECTION
Example 2
Data for the 60-Hz radial system of Figure 6 are given in Tables 1, 2,
and 3. Select current tap settings (TSs) and time-dial settings (TDSs) to
protect the system from faults. Assume three CO-8 relays for each
breaker, one for each phase, with a 0.3s coordination time interval. The
relays for each breaker are connected as shown in Figure 7, so that all
three phases of the breaker open when a fault is detected on any one
phase. Assume a 34.5-kV (line-to-line) voltage at all buses during
normal operation.
12.2 RADIAL SYSTEM PROTECTION
Example 2
Table 1 – Maximum loads
Table 2 – Symmetrical fault currents
12.2 RADIAL SYSTEM PROTECTION
Example 2
Table 3 – CT and relay data
12.2 RADIAL SYSTEM PROTECTION
Example 2
Figure 7 – Relay connections to trip all three phases

BEF43303_-_201620171_W12 Overcurrent Protection.pdf

  • 1.
    BEF43303 POWER SYSTEM ANALYSISAND PROTECTION WEEK 12 OVERCURRENT PROTECTION
  • 2.
    12.0 CONTENTS 12.1 Overcurrentrelays 12.2 Radial system protection
  • 3.
    12.1 OVERCURRENT RELAYS •Figure 1 shows an overcurrent protection scheme. • It shows that the CT secondary current 𝐼𝐼𝐼 is the input to the overcurrent relay operating coil. Figure 1 – An overcurrent protection scheme
  • 4.
    12.1 OVERCURRENT RELAYS •An instantaneous overcurrent relays respond to the magnitude of input current. • Figure 2 shows the trip and block regions of an instantaneous overcurrent relay. • 𝐼𝐼𝐼 > 𝐼𝐼𝑝𝑝 (pickup current) → relay contact close → CB trip coil energized, instantaneously. Figure 2 – An instantaneous overcurrent relay block and trip regions
  • 5.
    12.1 OVERCURRENT RELAYS •Time-delay overcurrent relays respond to the magnitude of input current, with an intentional time delay. • Figure 3 shows the characteristics of this relay. • For smaller multiples of pickup, the relay trips after a longer time delay. Figure 3 – Time delay overcurrent relay block and trip region
  • 6.
    12.1 OVERCURRENT RELAYS •Typically, overcurrent relays have two settings:  Current-tap setting: The pickup current in amperes.  Time-dial setting: The adjustable amount of time delay. • The characteristic curves are usually shown with the operating time delay in second versus relay input current as a multiple of the pickup current as shown in Figure 4. • The inverse time characteristic can be shifted up and down by adjusting the time-dial setting.
  • 7.
    12.1 OVERCURRENT RELAYS Figure4 – CO-8 time-delay overcurrent relay characteristic
  • 8.
    12.1 OVERCURRENT RELAYS Example1 The CO-8 relay with a current tap setting of 6 amperes and a time-dial setting of 1 is used with the 100:5 CT. Determine the relay operating time for each of the following cases. a) 𝐼𝐼𝐼 = 5𝐴𝐴 (Ans.: Relay does not operate) b) 𝐼𝐼𝐼 = 8𝐴𝐴 (Ans.: 6s) c) 𝐼𝐼𝐼 = 15𝐴𝐴 (Ans.: 1.2s)
  • 9.
    12.1 OVERCURRENT RELAYS •Figure 5 shows the time- current characteristic of five CO time delay overcurrent relays. • The differences depends on the sensitivity of the relay towards higher fault currents. • The choice of relay time- current characteristic depends on the sources, lines and loads. Figure 5 – Comparison of CO relay characteristics
  • 10.
    12.2 RADIAL SYSTEMPROTECTION • Typically, radial system are protected by time-delay overcurrent relays. • Adjustable time delays are selected such that the breaker closest to the fault opens, while other upstream breakers with larger time delays remain closed. • The relays are coordinated to operate in sequence so as to interrupt minimum load during faults. • Coordination of overcurrent relays usually limits the maximum number of breakers in a radial system to five or less.
  • 11.
    12.2 RADIAL SYSTEMPROTECTION • Consider a radial system as shown in Figure 6. Figure 6 – Single line diagram of a 34.5kV radial system
  • 12.
    12.2 RADIAL SYSTEMPROTECTION • The coordination time interval is the time interval between the primary and remote backup protective device. • Precise determination of relay operating time is difficult due to several factors such as:  CT errors.  DC offset component of fault current.  Relay overtravel. • Thus, typical coordination time intervals from 0.2 to 0.5s are selected to account for these factors.
  • 13.
    12.2 RADIAL SYSTEMPROTECTION Example 2 Data for the 60-Hz radial system of Figure 6 are given in Tables 1, 2, and 3. Select current tap settings (TSs) and time-dial settings (TDSs) to protect the system from faults. Assume three CO-8 relays for each breaker, one for each phase, with a 0.3s coordination time interval. The relays for each breaker are connected as shown in Figure 7, so that all three phases of the breaker open when a fault is detected on any one phase. Assume a 34.5-kV (line-to-line) voltage at all buses during normal operation.
  • 14.
    12.2 RADIAL SYSTEMPROTECTION Example 2 Table 1 – Maximum loads Table 2 – Symmetrical fault currents
  • 15.
    12.2 RADIAL SYSTEMPROTECTION Example 2 Table 3 – CT and relay data
  • 16.
    12.2 RADIAL SYSTEMPROTECTION Example 2 Figure 7 – Relay connections to trip all three phases