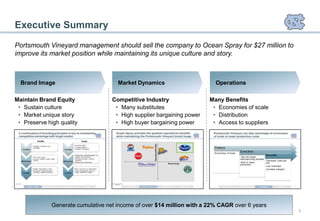
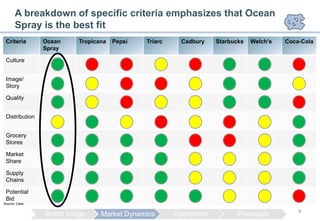
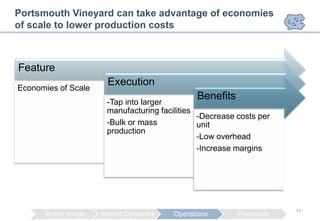
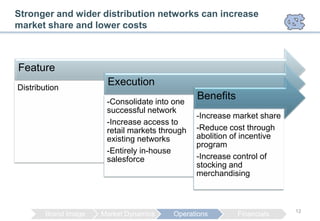
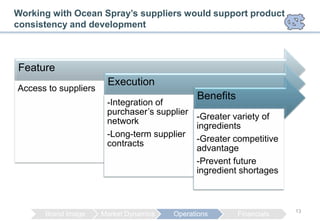
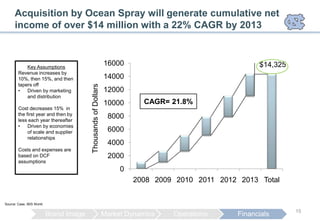
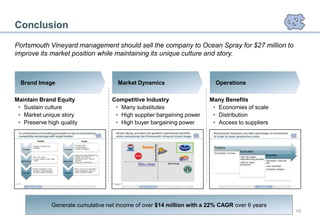
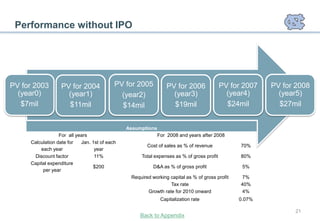
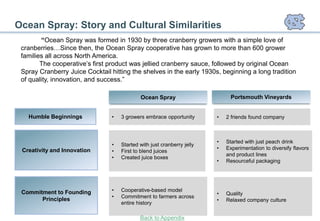
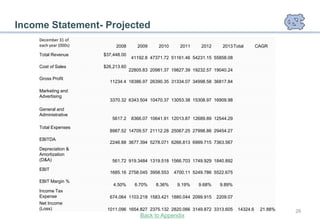
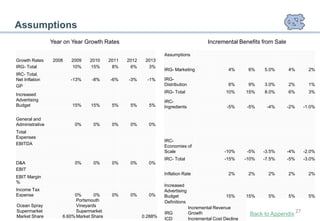
Portsmouth Vineyard management should sell the company to Ocean Spray for $27 million to generate cumulative net income of over $14 million with a 22% CAGR over 6 years while maintaining its unique culture and brand equity. Selling to Ocean Spray provides many operational and financial benefits including economies of scale, improved distribution, and access to suppliers that help overcome weaknesses in Portsmouth Vineyard's market position.


![The Times, They Are Changing May 15 Naed [Autosaved]](https://cdn.slidesharecdn.com/ss_thumbnails/thetimestheyarechangingmay15naedautosaved-12735050512432-phpapp01-thumbnail.jpg?width=640&height=640&fit=bounds)

