Download to read offline
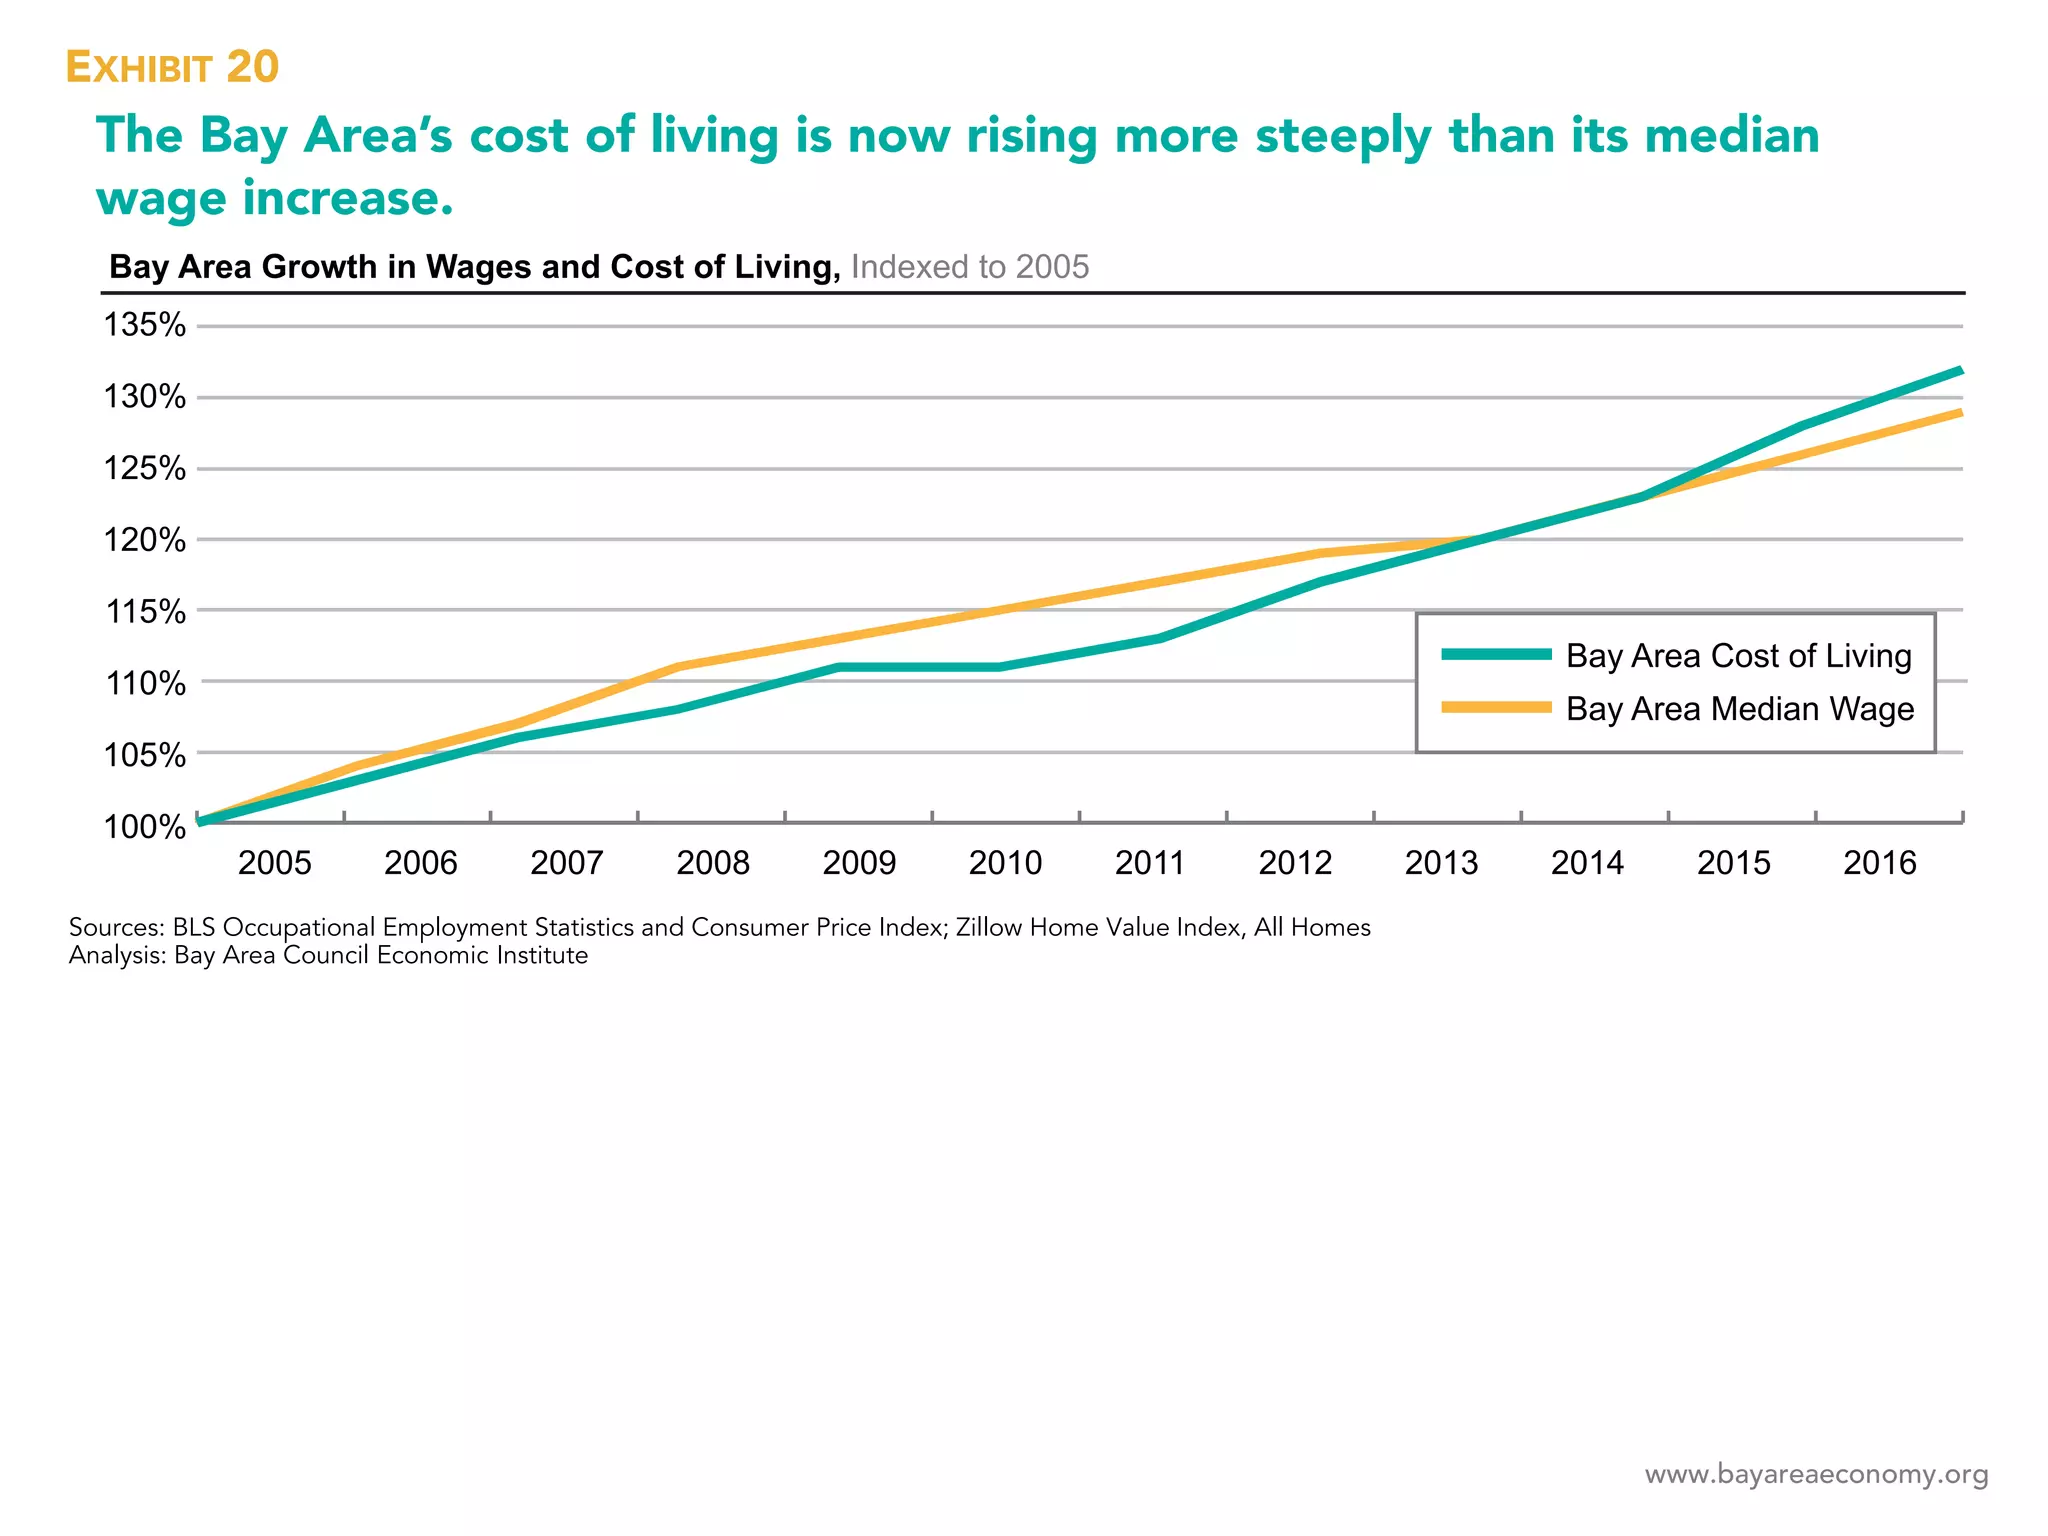
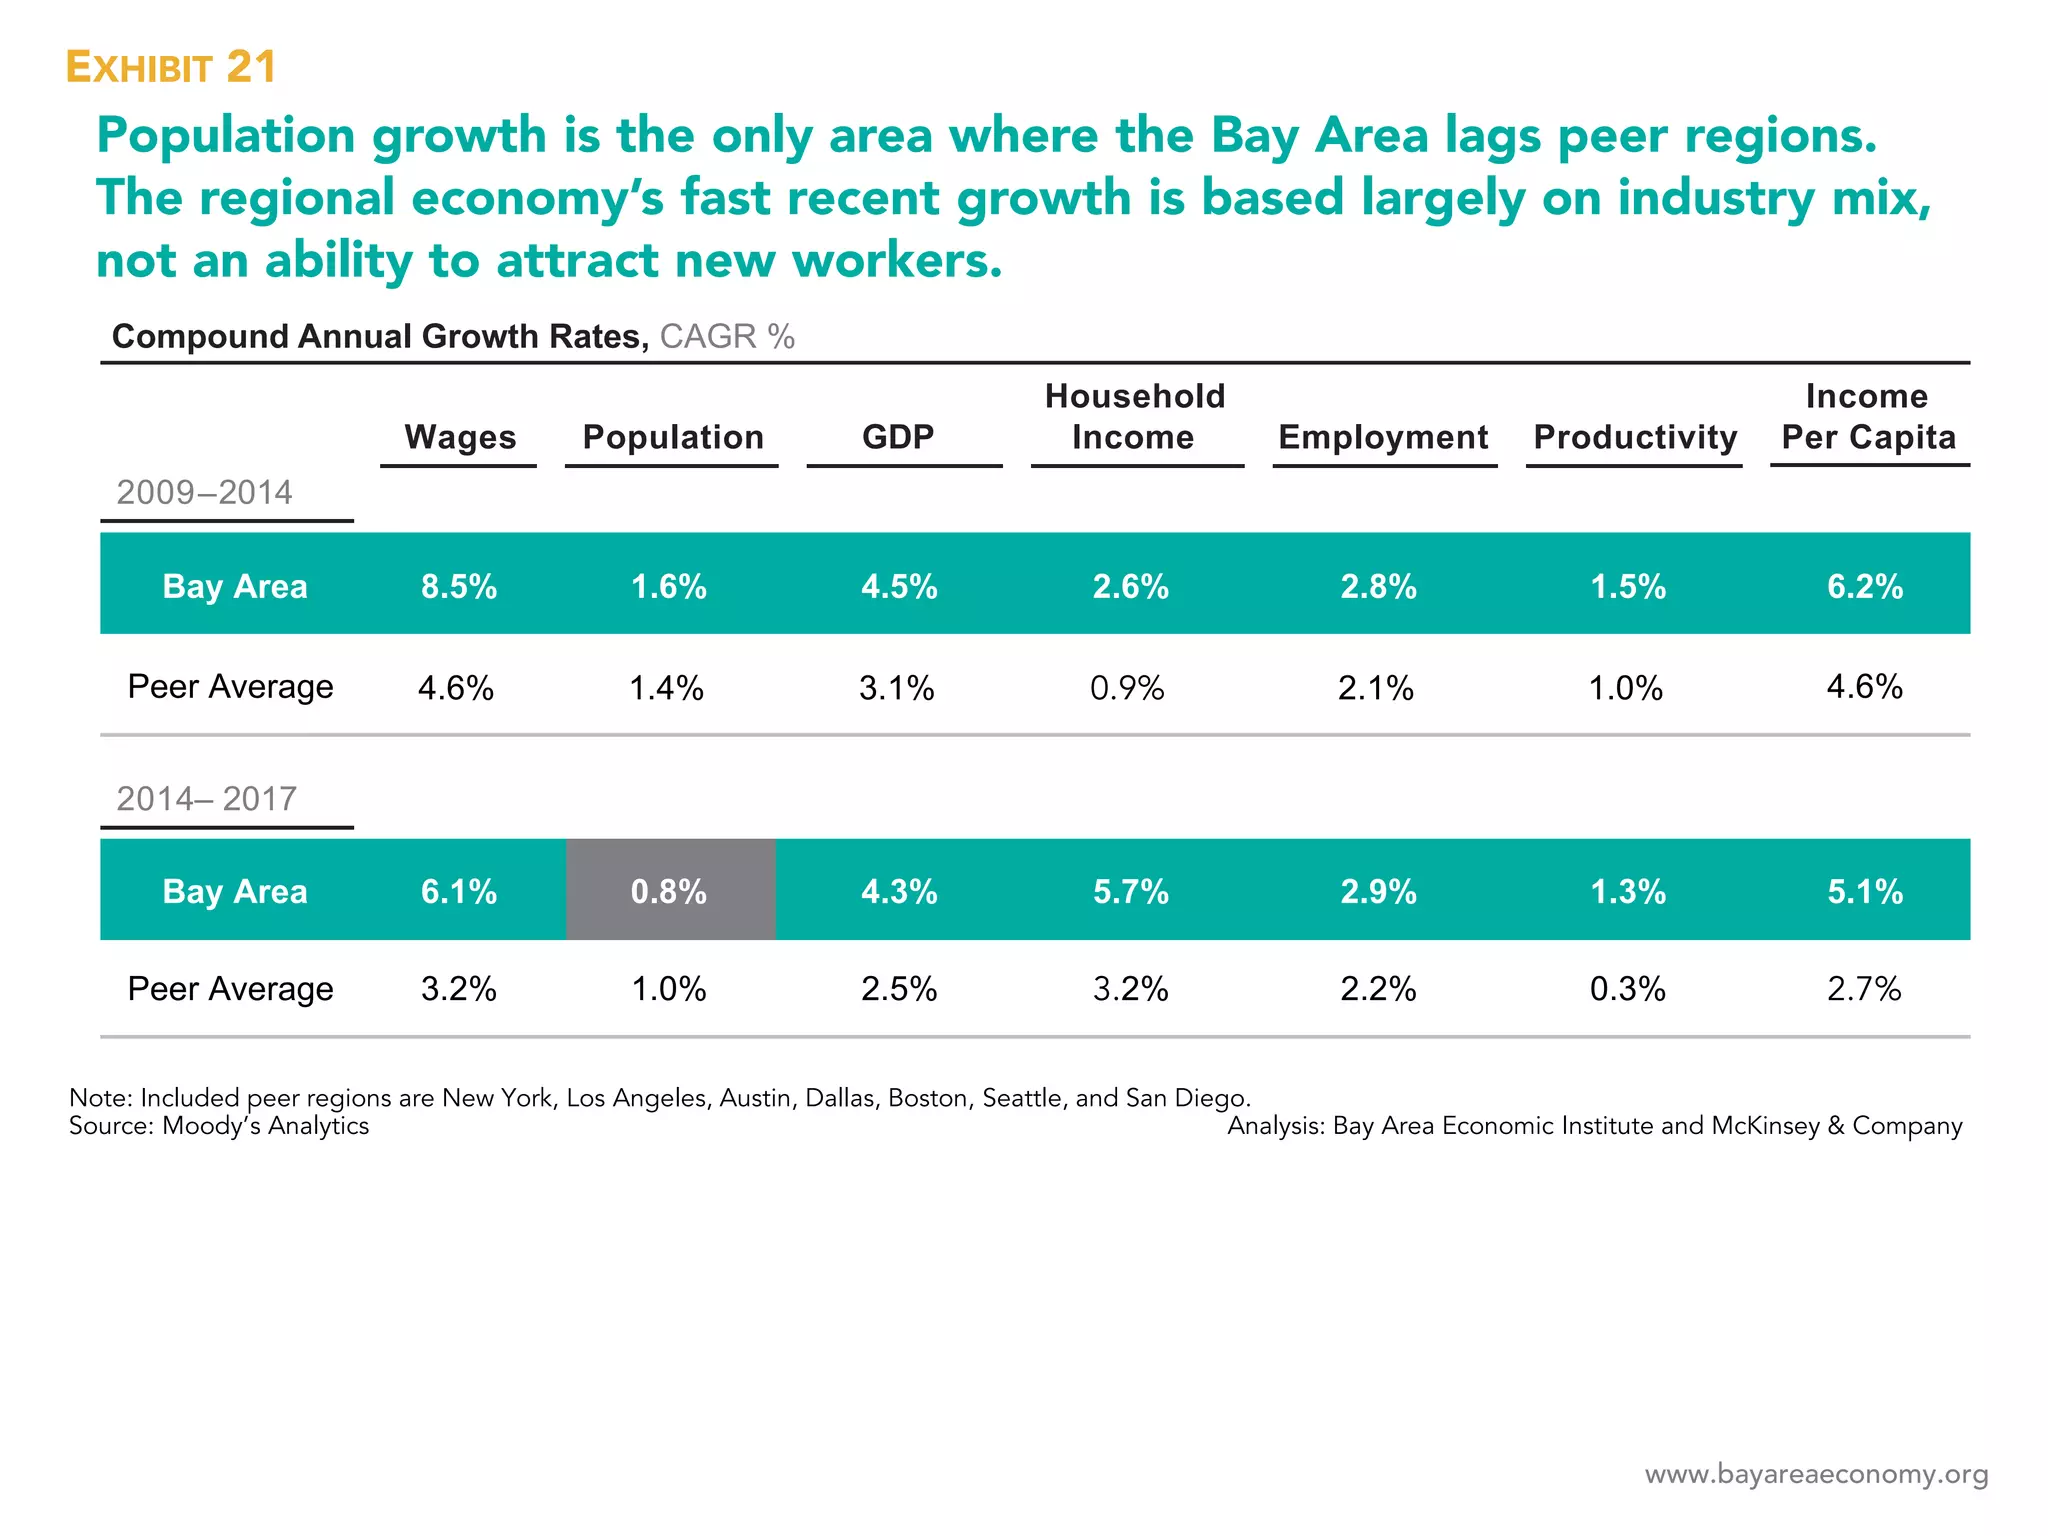
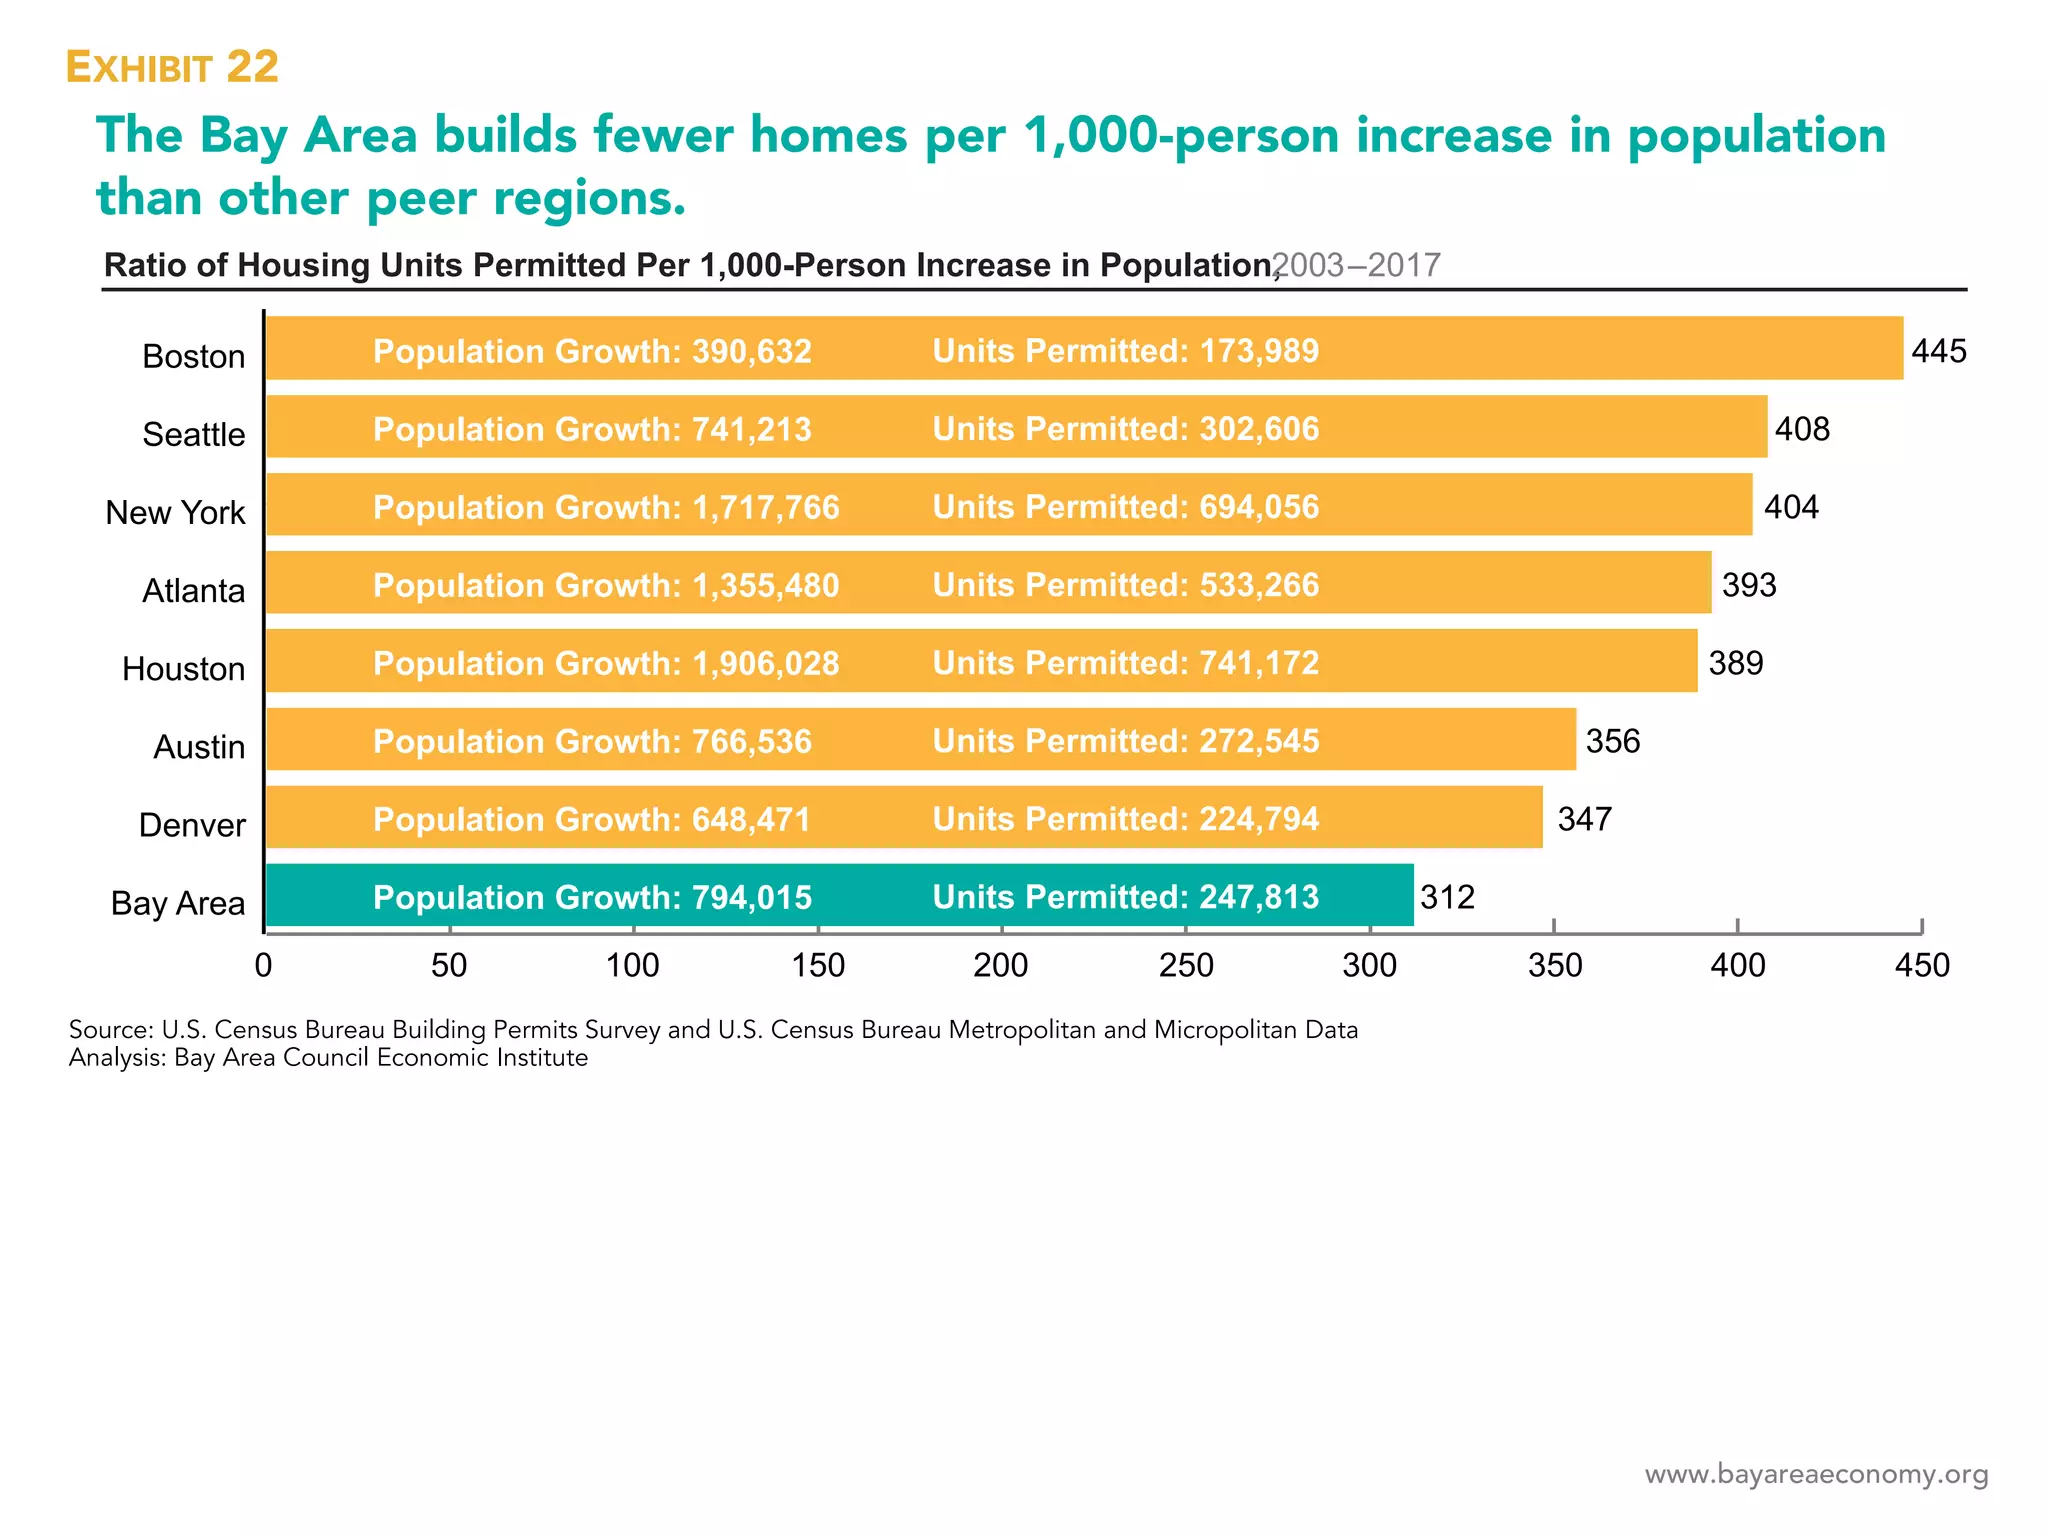


The Bay Area's cost of living is increasing faster than median wages, leading to a higher percentage of housing-cost-burdened households compared to other major regions. Despite strong economic growth, the area struggles with population growth and housing unit permits per capita are significantly lower than peer regions. Additionally, there are substantial income inequities correlated with ethnicity and concerns about meeting future climate goals.


![Explosive Economic Growth in the San Francisco.pdf. [reduced file size]](https://cdn.slidesharecdn.com/ss_thumbnails/03b5c152-d5fb-4352-b732-2f88908ff5bd-160801003230-thumbnail.jpg?width=640&height=640&fit=bounds)


