Konferansa Katılım: Herkes katılabilir. Serbest ve Ücretsiz.
Uygulamalı Bölümü: Konferansa katılan, Zeytinburnu Belediyesi Çalışanlarına Açıktır. Bununla birlikte, sınırlı sayıda (50) kontenjan JFMO İstanbul Şube Üyelerine ayrılmıştır.
Sertifika: Uygulamalı bölüme katılıp başarılı olanlara verilecektir.
Başvuru Koşulu: JFMO İstanbul Şube Üyesi Olmak
Başvuru Tarihi: 31 Aralık 2013
Başvuru Yeri: JFMO İstanbul Şube
Telefon 1:+90 212 2196340
Telefon 2:+90 212 2196341
Faks: +90 212 2196368
https://www.facebook.com/events/232453896924599/
The lift pump operates by raising and lowering a piston inside a cylinder to draw water up from an underground reservoir. When the pump handle is pushed down, valve A opens allowing water to enter the cylinder. When the handle is raised, the piston is pushed down closing valve A and opening valve B, allowing water to flow out. Repeating this process of raising and lowering the piston causes water to be continuously drawn up and discharged from the lift pump.
Gravimetri Dersi için aşağıda ki videoları izleyebilirsiniz.
Link 01: https://www.youtube.com/watch?v=HTyjVaVGx0k
Link 02: https://www.youtube.com/watch?v=fUkfgI8XaOE
The document discusses gravity anomalies and density variations in different regions based on gravity data. It shows how gravity maps reveal details about crustal thickness, tectonic features like faults and volcanic zones, and plate boundaries. Specific examples discussed include the Tibetan Plateau, Central America subduction zone, an area in Chugoku, Japan, and the state of Florida in the US. Regional gravity data can be used to model density changes associated with plate tectonics, crustal evolution, and volcanic and tectonic activity.
The USF team reviewed a geophysical investigation of the Kar Kar region conducted by WesternGeco in 2011. They found that WesternGeco's magnetotelluric (MT) data and models were of high quality. Both the WesternGeco and USF MT models identified a low resistivity zone at 300m depth that correlates with a water-bearing zone found in Borehole 4. USF performed gravity modeling which identified a north-south trending basin reaching 1500m depth, consistent with mapped faults. A preliminary hydrothermal model suggested observed temperatures could result from deep circulation of meteoric waters in the basin without needing a localized heat source. Additional geophysical data is recommended around the Jermaghbyur hot springs to
This document summarizes a study that used gravity data to delineate underground structure in the Beppu geothermal field in Japan. Analysis of Bouguer anomaly maps revealed high anomalies in the southern and northern parts of the study area that correspond to known geological formations. Edge detection filtering of the gravity data helped identify subsurface faults, including the northern edge of the high southern anomaly corresponding to the Asamigawa Fault. Depth modeling of the gravity basement showed differences between the southern and northern hot spring areas, with steep basement slopes along faults in the south and uplifted basement in the north.
This document summarizes the development of a new ultra-high resolution model of Earth's gravity field called GGMplus. Key points:
- GGMplus combines satellite gravity data from GOCE and GRACE with terrestrial gravity data and topography to achieve unprecedented 200m spatial resolution globally.
- It provides gridded estimates of gravity, horizontal and radial field components, and quasi-geoid heights at over 3 billion points covering 80% of the Earth's land.
- GGMplus reveals new details of small-scale gravity variations and identifies locations of minimum and maximum gravity, suggesting peak-to-peak variations are 40% larger than previous estimates. The model will benefit scientific and engineering applications.
Gravity measurements were taken in a region of China covering the south-north earthquake belt in 1998, 2000, 2002, and 2005. Researchers noticed significant gravity changes in the region surrounding Wenchuan and suggested in 2006 that a major earthquake could occur there in 2007 or 2008. While gravity changes were significant at some locations, more research is needed to determine if they could be considered a precursor. Uncertainties exist from measurement errors, hydrologic effects, and crustal movements. Improved data collection and analysis could enhance using gravity monitoring for earthquake research.
The document provides guidelines for implementing the H/V spectral ratio technique using ambient vibration measurements to evaluate site effects. It recommends procedures for experimental design, data processing, and interpretation. The key recommendations include measuring for sufficient duration depending on expected frequency, using multiple measurement points, avoiding disturbances, and interpreting H/V peaks in context with geological and geophysical data. Reliable H/V peaks are defined as having a clear maximum within expected frequency ranges and uncertainties. The guidelines aim to help apply the technique while accounting for its limitations.
Geopsy yaygın olarak kullanılan profesyonel bir program. Özellikle, profesyonel program deneyimi yeni mezunlarda çok aranan bir özellik. Bir öğrencim çalışmasında kullanmayı planlıyor.
Basında Deprem Haberciliği: 20 Saatlik Eğitim Paketi
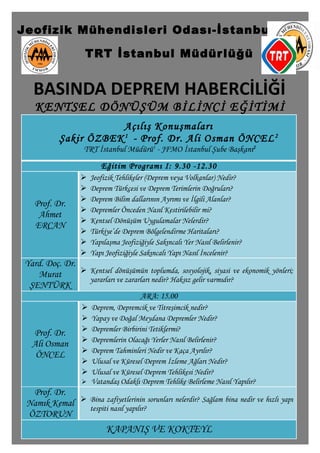
1. TRT İstanbul Müdürlüğü
BASINDA DEPREM HABERCİLİĞİ
KENTSEL DÖNÜŞÜM BİLİNCİ EĞİTİMİ
Açılış Konuşmaları
Şakir ÖZBEK1
- Prof. Dr. Ali Osman ÖNCEL2
TRT İstanbul Müdürü1
- JFMO İstanbul Şube Başkanı2
Eğitim Programı I: 9.30 -12.30
Prof. Dr.
Ahmet
ERCAN
Jeofizik Tehlikeler (Deprem veya Volkanlar) Nedir?
Deprem Türkçesi ve Deprem Terimlerin Doğruları?
Deprem Bilim dallarının Ayrımı ve İlgili Alanlar?
Depremler Önceden Nasıl Kestirilebilir mi?
Kentsel Dönüşüm Uygulamalar Nelerdir?
Türkiye’de Deprem Bölgelendirme Haritaları?
Yapılaşma Jeofiziğiyle Sakıncalı Yer Nasıl Belirlenir?
Yapı Jeofiziğiyle Sakıncalı Yapı Nasıl İncelenir?
Yard. Doç. Dr.
Murat
ŞENTÜRK
Kentsel dönüşümün toplumda, sosyolojik, siyasi ve ekonomik yönleri;
yararları ve zararları nedir? Haksız gelir varmıdır?
ARA: 15.00
Prof. Dr.
Ali Osman
ÖNCEL
Deprem, Depremcik ve Titreşimcik nedir?
Yapay ve Doğal Meydana Depremler Nedir?
Depremler Birbirini Tetiklermi?
Depremlerin Olacağı Yerler Nasıl Belirlenir?
Deprem Tahminleri Nedir ve Kaça Ayrılır?
Ulusal ve Küresel Deprem İzleme Ağları Nedir?
Ulusal ve Küresel Deprem Tehlikesi Nedir?
Vatandaş Odaklı Deprem Tehlike Belirleme Nasıl Yapılır?
Prof. Dr.
Namık Kemal
ÖZTORUN
Bina zafiyetlerinin sorunları nelerdir? Sağlam bina nedir ve hızlı yapı
tespiti nasıl yapılır?
KAPANIŞ VE KOKTEYL
Jeofizik Mühendisleri Odası-İstanbul
Şubesi