Downloaded 499 times
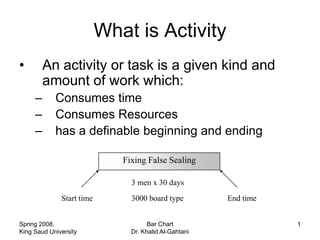
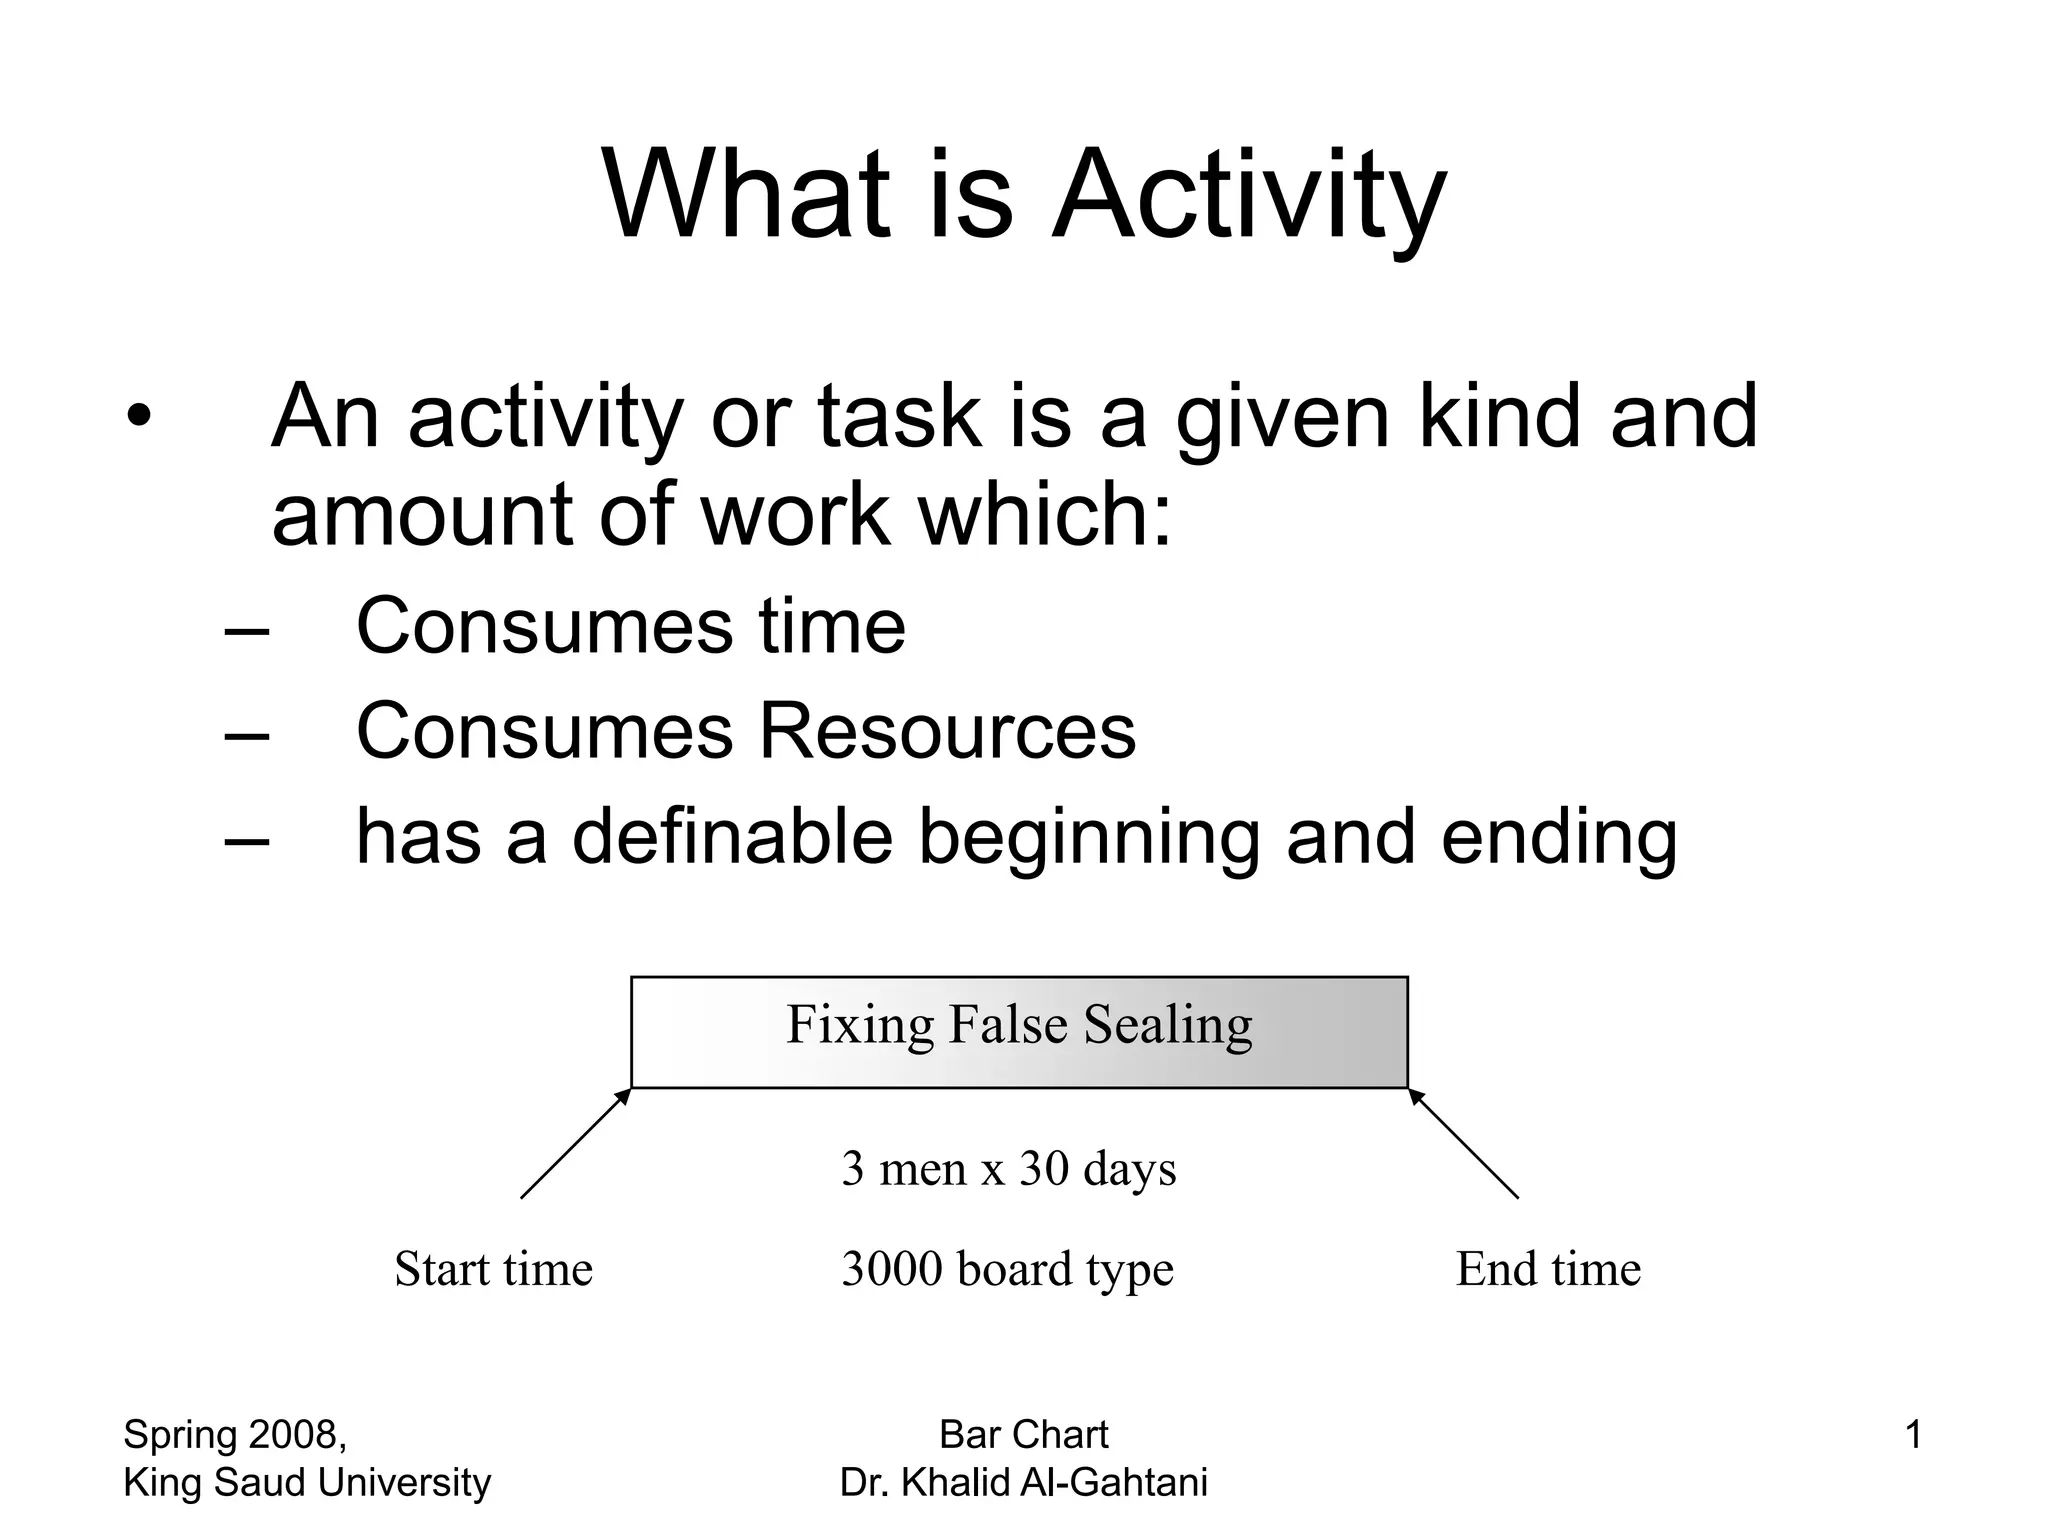
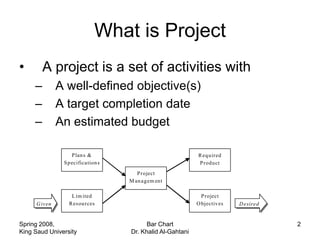
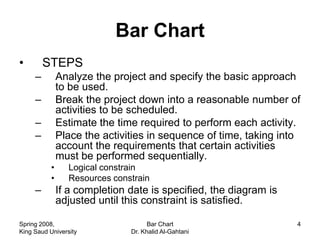
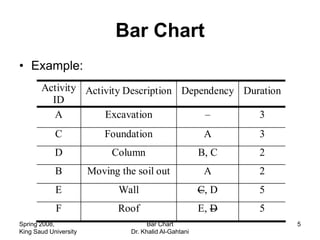
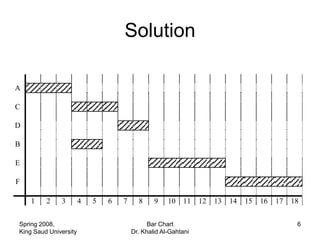
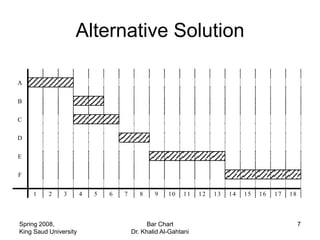
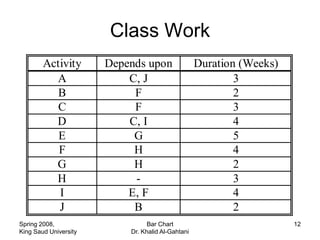
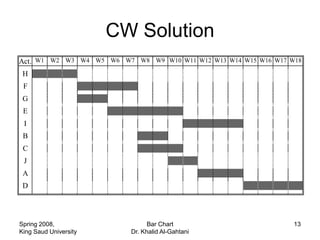

The document discusses activities, projects, and bar charts for project scheduling. An activity has a defined start and end time and uses resources. A project is a set of activities with defined objectives, completion date, and budget. A bar chart is a common project scheduling tool that displays activities as horizontal bars placed sequentially according to duration and dependencies. It can identify critical paths where delays could impact the overall project schedule.


