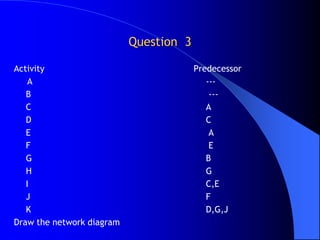
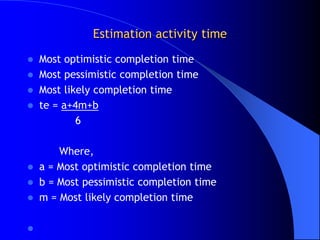
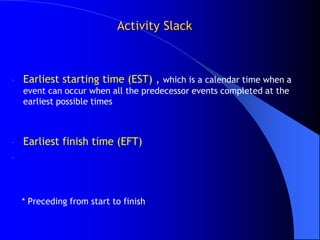
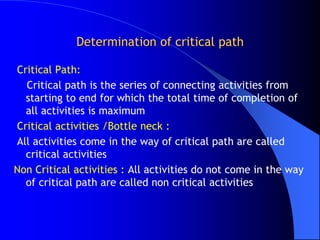
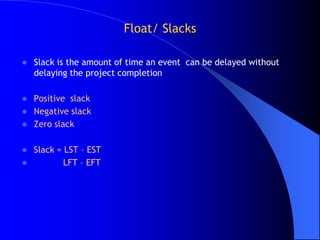
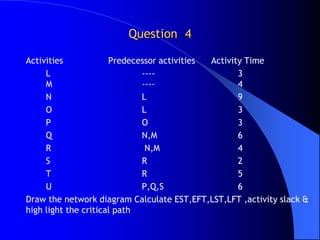
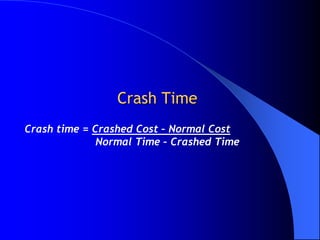
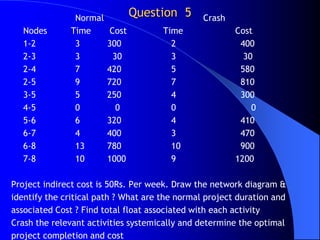
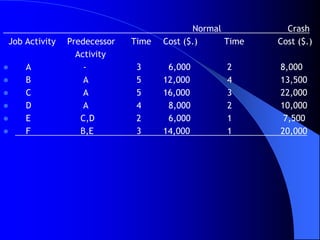
Net work Analysis
   CPM/PERT
Project
   “A project is a series of activities directed
    to accomplishment of a desired objective.”

Work break down structure
   “Project can be splitted into small tasks
    with sequence of the their execution. This
    process is known as work break down
    structure “

    Plan your work first…..then work
    your plan
Network analysis
Network analysis is the general name given to certain specific
techniques which can be used for the planning, management and
control of projects.
Main objectives are:
1. Complete the project within stipulated period..
2. Optimize resources utilization.
3. Better coordination in interdependent activities


C.P.M & P.E.R.T are two methodologies to analyze the network
PERT -
      Project Evaluation & Review Techniques

   Definition:
   In PERT activities are shown as a network of precedence
    relationships in which successive events are joined by arrows.
     – Probabilistic activity times
     – Optimistic time, pessimistic time, most likely time.
     – Event oriented diagram


     USED IN : Project management - for non-repetitive jobs
       (research and development work), where the time and cost
       estimates tend to be quite uncertain. This technique uses
       probabilistic time estimates.
CPM - Critical Path Method

   Definition: CPM activities are shown as a network of
    precedence relationships in which successive activities are
    represented by arrows. .also called PPS
     – Single estimate of activity time
     – Deterministic activity times
     – Activity oriented diagram


     USED IN : Production management - for the jobs of
       repetitive in nature where the activity time estimates can
       be predicted with considerable certainty due to the
       existence of past experience.
Terminologies used in C.P.M

   Use of nodes and arrows


     Arrows       An arrow leads from tail to head directionally
    – Indicate ACTIVITY, a time or resource consuming effort that is
      required to perform a part of the work.
    – Direction of the progress of the project


      Nodes      A node is represented by a circle
    - Indicate EVENT, a point in time where one or more activities
      start and/or finish.
    - Some part of the project has been complete
    - Merge events, brust events.
Terminologies used in C.P.M

   Relation ship between Events:
   1. Successor Events
   2. Predecessor Events

   Activity:
   1. Successor Activity
   2. Predecessor Activity
   3. Dummy Activity
   4. Concurrent Activity
Activity on Node & Activity on Arrow

Activity on Node                Activity on Arrow

- A completion of an activity   - An arrow represents a task,
  is represented by a node         while a node is the
                                   completion of a task
                                - Arrows represent order of
                                   events
Rules to draw the network
1. Each event is presented by the nodes & activity by an
   arrow
2. The starting event should be represented by i
3. The completion of project should be assigned highest
   number in the network
4. The activities emerging from event i should have no
   predecessor activities & event having highest number in
   diagram should have no successor activity
5. The activity must have highest number for its head
   (arrow) than its tail
6. Network diagram cannot have more than one starting
   node or end node
Rules to draw the network

7.   7. There should not be a loop in diagram
8.   8. An event cannot occur or an activity cannot start unless all its
     preceding activities have been completed (not applicable on dummy
     activity )
Fulkerson’s Rule
The starting event(having no predecessor activity is
numbered as 1 ) other events are numbered in increasing
order from 1 to rightwards , if there are more then 1
initial event found in a diagram , anywhere they are to be
numbered fro top to bottom in increase order no two
events can have the same number in any case
Question 1

Activity                           Predecessor
    A                                   ---
   B                                    A
   C                                    B
   D                                    C,E
   E                                      B
   F                                      C,E
   G                                    F
   H                                    G
   I                                    H,D
   J                                    I
Draw the network diagram
Question 2

A project consist of 7 activities .Activities P,Q,R run simultaneously . The
   relationship among the various activities is as follow
Activity                                      successor
   P                                               S
   Q                                               T
   R                                               U

Activity V is the immediate successor to S, T, & U
Draw the network diagram
Question 3

Activity                                Predecessor
    A                                      ---
   B                                        ---
   C                                       A
   D                                       C
   E                                        A
   F                                        E
   G                                       B
   H                                       G
   I                                       C,E
   J                                       F
   K                                       D,G,J
Draw the network diagram
Estimation activity time
   Most optimistic completion time
   Most pessimistic completion time
   Most likely completion time
   te = a+4m+b
            6

      Where,
 a = Most optimistic completion time
 b = Most pessimistic completion time
 m = Most likely completion time



Question 4
Q: Draw the network, labeling activities


Job Activity   Immediate       Optimistic time   Most likely   Pessimistic time
                Predecessor                a              m              b
   A          -                          5              6              7
   B          -                          2              5              8
   C          A                          6               7            14
   D           B                         1               2             3
   E          C, D                      3               3             3
   F            B                       6                8            10
   G            E                        1                4            7
   H            F, G                    4                5             6
Activity Slack


-   Earliest starting time (EST) , which is a calendar time when a
    event can occur when all the predecessor events completed at the
    earliest possible times


-   Earliest finish time (EFT)
-


    * Preceding from start to finish
Activity Slack


-    Latest starting time (LST): The latest time by which an activity
     is started with out delaying the total project completion.

-    Latest finish time (LFT):


    * Start working from finish to start
Determination of critical path

Critical Path:
  Critical path is the series of connecting activities from
  starting to end for which the total time of completion of
  all activities is maximum
Critical activities /Bottle neck :
All activities come in the way of critical path are called
  critical activities
Non Critical activities : All activities do not come in the way
  of critical path are called non critical activities
Float/ Slacks

   Slack is the amount of time an event can be delayed without
    delaying the project completion

   Positive slack
   Negative slack
   Zero slack

   Slack = LST – EST
           LFT – EFT
Question 4

Activities            Predecessor activities Activity Time
     L                       ----                   3
     M                       ----                   4
     N                       L                      9
     O                       L                      3
     P                       O                      3
     Q                       N,M                    6
     R                        N,M                   4
     S                       R                      2
     T                       R                      5
     U                       P,Q,S                  6
Draw the network diagram Calculate EST,EFT,LST,LFT ,activity slack &
high light the critical path
Crash Time
Crash time = Crashed Cost – Normal Cost
              Normal Time – Crashed Time
Normal           Question 5     Crash
   Nodes       Time       Cost        Time              Cost
   1-2          3        300            2                400
   2-3          3          30           3                 30
   2-4          7        420            5                580
   2-5          9        720            7                810
   3-5          5        250            4                300
   4-5          0           0           0                   0
   5-6          6        320            4                410
   6-7          4        400            3                470
   6-8          13       780            10               900
   7-8          10       1000           9               1200

Project indirect cost is 50Rs. Per week. Draw the network diagram &
identify the critical path ? What are the normal project duration and
associated Cost ? Find total float associated with each activity
Crash the relevant activities systemically and determine the optimal
project completion and cost
Question 6
 On May 1,Arnie Watson sent a memo to his boss, the
  director of the project      (6)
   management. Stating that the MX project would
  require 13 weeks for the completion. Arnie realized
  that customer wanted the job completed in less
  time, after discussions with the functional
  managers,Arnie developed the table shown.
 According to the contract there is a penalty payment of
  $5,000 per week for every week over six. What is the
  minimum amount of additional funding that arnie
  should request.
Normal          Crash
Job Activity   Predecessor   Time   Cost ($.)     Time   Cost ($.)
                 Activity
   A              -          3      6,000        2      8,000
   B              A          5     12,000        4      13,500
   C              A          5     16,000        3      22,000
   D              A          4      8,000        2      10,000
   E             C,D         2      6,000        1       7,500
   F             B,E         3     14,000        1      20,000
Benefits of CPM/PERT

 Interdependencies of activity
 Project completion time
 Impact of late start
 Impact of early start
 “what if “ exercise
 Evaluation of performance
Questions Answered by CPM & PERT

 Completion date?
 On Schedule?
 Within Budget?
 Critical Activities?
 How can the project be finished early at the least
  cost?
Limitations to CPM/PERT

   Clearly defined, independent and stable activities
   Specified precedence relationships
   Over emphasis on critical paths
Thank you

Pert cpm

  • 1.
  • 2.
    Project  “A project is a series of activities directed to accomplishment of a desired objective.” Work break down structure  “Project can be splitted into small tasks with sequence of the their execution. This process is known as work break down structure “ Plan your work first…..then work your plan
  • 3.
    Network analysis Network analysisis the general name given to certain specific techniques which can be used for the planning, management and control of projects. Main objectives are: 1. Complete the project within stipulated period.. 2. Optimize resources utilization. 3. Better coordination in interdependent activities C.P.M & P.E.R.T are two methodologies to analyze the network
  • 4.
    PERT - Project Evaluation & Review Techniques  Definition:  In PERT activities are shown as a network of precedence relationships in which successive events are joined by arrows. – Probabilistic activity times – Optimistic time, pessimistic time, most likely time. – Event oriented diagram USED IN : Project management - for non-repetitive jobs (research and development work), where the time and cost estimates tend to be quite uncertain. This technique uses probabilistic time estimates.
  • 5.
    CPM - CriticalPath Method  Definition: CPM activities are shown as a network of precedence relationships in which successive activities are represented by arrows. .also called PPS – Single estimate of activity time – Deterministic activity times – Activity oriented diagram USED IN : Production management - for the jobs of repetitive in nature where the activity time estimates can be predicted with considerable certainty due to the existence of past experience.
  • 6.
    Terminologies used inC.P.M  Use of nodes and arrows Arrows  An arrow leads from tail to head directionally – Indicate ACTIVITY, a time or resource consuming effort that is required to perform a part of the work. – Direction of the progress of the project Nodes  A node is represented by a circle - Indicate EVENT, a point in time where one or more activities start and/or finish. - Some part of the project has been complete - Merge events, brust events.
  • 7.
    Terminologies used inC.P.M  Relation ship between Events:  1. Successor Events  2. Predecessor Events  Activity:  1. Successor Activity  2. Predecessor Activity  3. Dummy Activity  4. Concurrent Activity
  • 8.
    Activity on Node& Activity on Arrow Activity on Node Activity on Arrow - A completion of an activity - An arrow represents a task, is represented by a node while a node is the completion of a task - Arrows represent order of events
  • 9.
    Rules to drawthe network 1. Each event is presented by the nodes & activity by an arrow 2. The starting event should be represented by i 3. The completion of project should be assigned highest number in the network 4. The activities emerging from event i should have no predecessor activities & event having highest number in diagram should have no successor activity 5. The activity must have highest number for its head (arrow) than its tail 6. Network diagram cannot have more than one starting node or end node
  • 10.
    Rules to drawthe network 7. 7. There should not be a loop in diagram 8. 8. An event cannot occur or an activity cannot start unless all its preceding activities have been completed (not applicable on dummy activity )
  • 11.
    Fulkerson’s Rule The startingevent(having no predecessor activity is numbered as 1 ) other events are numbered in increasing order from 1 to rightwards , if there are more then 1 initial event found in a diagram , anywhere they are to be numbered fro top to bottom in increase order no two events can have the same number in any case
  • 12.
    Question 1 Activity Predecessor A --- B A C B D C,E E B F C,E G F H G I H,D J I Draw the network diagram
  • 13.
    Question 2 A projectconsist of 7 activities .Activities P,Q,R run simultaneously . The relationship among the various activities is as follow Activity successor P S Q T R U Activity V is the immediate successor to S, T, & U Draw the network diagram
  • 14.
    Question 3 Activity Predecessor A --- B --- C A D C E A F E G B H G I C,E J F K D,G,J Draw the network diagram
  • 15.
    Estimation activity time  Most optimistic completion time  Most pessimistic completion time  Most likely completion time  te = a+4m+b 6 Where,  a = Most optimistic completion time  b = Most pessimistic completion time  m = Most likely completion time 
  • 16.
    Question 4 Q: Drawthe network, labeling activities Job Activity Immediate Optimistic time Most likely Pessimistic time Predecessor a m b  A - 5 6 7  B - 2 5 8  C A 6 7 14  D B 1 2 3  E C, D 3 3 3  F B 6 8 10  G E 1 4 7  H F, G 4 5 6
  • 18.
    Activity Slack - Earliest starting time (EST) , which is a calendar time when a event can occur when all the predecessor events completed at the earliest possible times - Earliest finish time (EFT) - * Preceding from start to finish
  • 19.
    Activity Slack - Latest starting time (LST): The latest time by which an activity is started with out delaying the total project completion. - Latest finish time (LFT): * Start working from finish to start
  • 20.
    Determination of criticalpath Critical Path: Critical path is the series of connecting activities from starting to end for which the total time of completion of all activities is maximum Critical activities /Bottle neck : All activities come in the way of critical path are called critical activities Non Critical activities : All activities do not come in the way of critical path are called non critical activities
  • 21.
    Float/ Slacks  Slack is the amount of time an event can be delayed without delaying the project completion  Positive slack  Negative slack  Zero slack  Slack = LST – EST  LFT – EFT
  • 22.
    Question 4 Activities Predecessor activities Activity Time L ---- 3 M ---- 4 N L 9 O L 3 P O 3 Q N,M 6 R N,M 4 S R 2 T R 5 U P,Q,S 6 Draw the network diagram Calculate EST,EFT,LST,LFT ,activity slack & high light the critical path
  • 23.
    Crash Time Crash time= Crashed Cost – Normal Cost Normal Time – Crashed Time
  • 24.
    Normal Question 5 Crash Nodes Time Cost Time Cost 1-2 3 300 2 400 2-3 3 30 3 30 2-4 7 420 5 580 2-5 9 720 7 810 3-5 5 250 4 300 4-5 0 0 0 0 5-6 6 320 4 410 6-7 4 400 3 470 6-8 13 780 10 900 7-8 10 1000 9 1200 Project indirect cost is 50Rs. Per week. Draw the network diagram & identify the critical path ? What are the normal project duration and associated Cost ? Find total float associated with each activity Crash the relevant activities systemically and determine the optimal project completion and cost
  • 25.
    Question 6  OnMay 1,Arnie Watson sent a memo to his boss, the director of the project (6) management. Stating that the MX project would require 13 weeks for the completion. Arnie realized that customer wanted the job completed in less time, after discussions with the functional managers,Arnie developed the table shown.  According to the contract there is a penalty payment of $5,000 per week for every week over six. What is the minimum amount of additional funding that arnie should request.
  • 26.
    Normal Crash Job Activity Predecessor Time Cost ($.) Time Cost ($.) Activity  A - 3 6,000 2 8,000  B A 5 12,000 4 13,500  C A 5 16,000 3 22,000  D A 4 8,000 2 10,000  E C,D 2 6,000 1 7,500  F B,E 3 14,000 1 20,000
  • 27.
    Benefits of CPM/PERT Interdependencies of activity  Project completion time  Impact of late start  Impact of early start  “what if “ exercise  Evaluation of performance
  • 28.
    Questions Answered byCPM & PERT  Completion date?  On Schedule?  Within Budget?  Critical Activities?  How can the project be finished early at the least cost?
  • 29.
    Limitations to CPM/PERT  Clearly defined, independent and stable activities  Specified precedence relationships  Over emphasis on critical paths
  • 30.