Download as PPSX, PPTX

![Program Evaluation and Review
Technique [PERT]
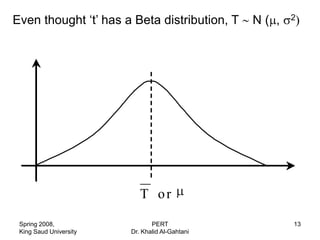
• Activity time is very much probabilities.
• three activity durations should be
estimated for each activity:
– Optimistic duration =a =4
– Pessimistic duration =b =7
– Most Likely duration =m =6
Spring 2008, PERT 8
King Saud University Dr. Khalid Al-Gahtani](https://image.slidesharecdn.com/pert-130107203849-phpapp01/85/Pert-8-320.jpg)
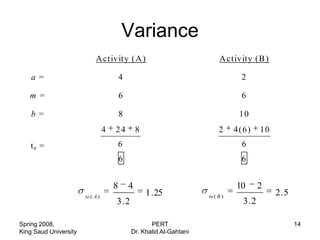
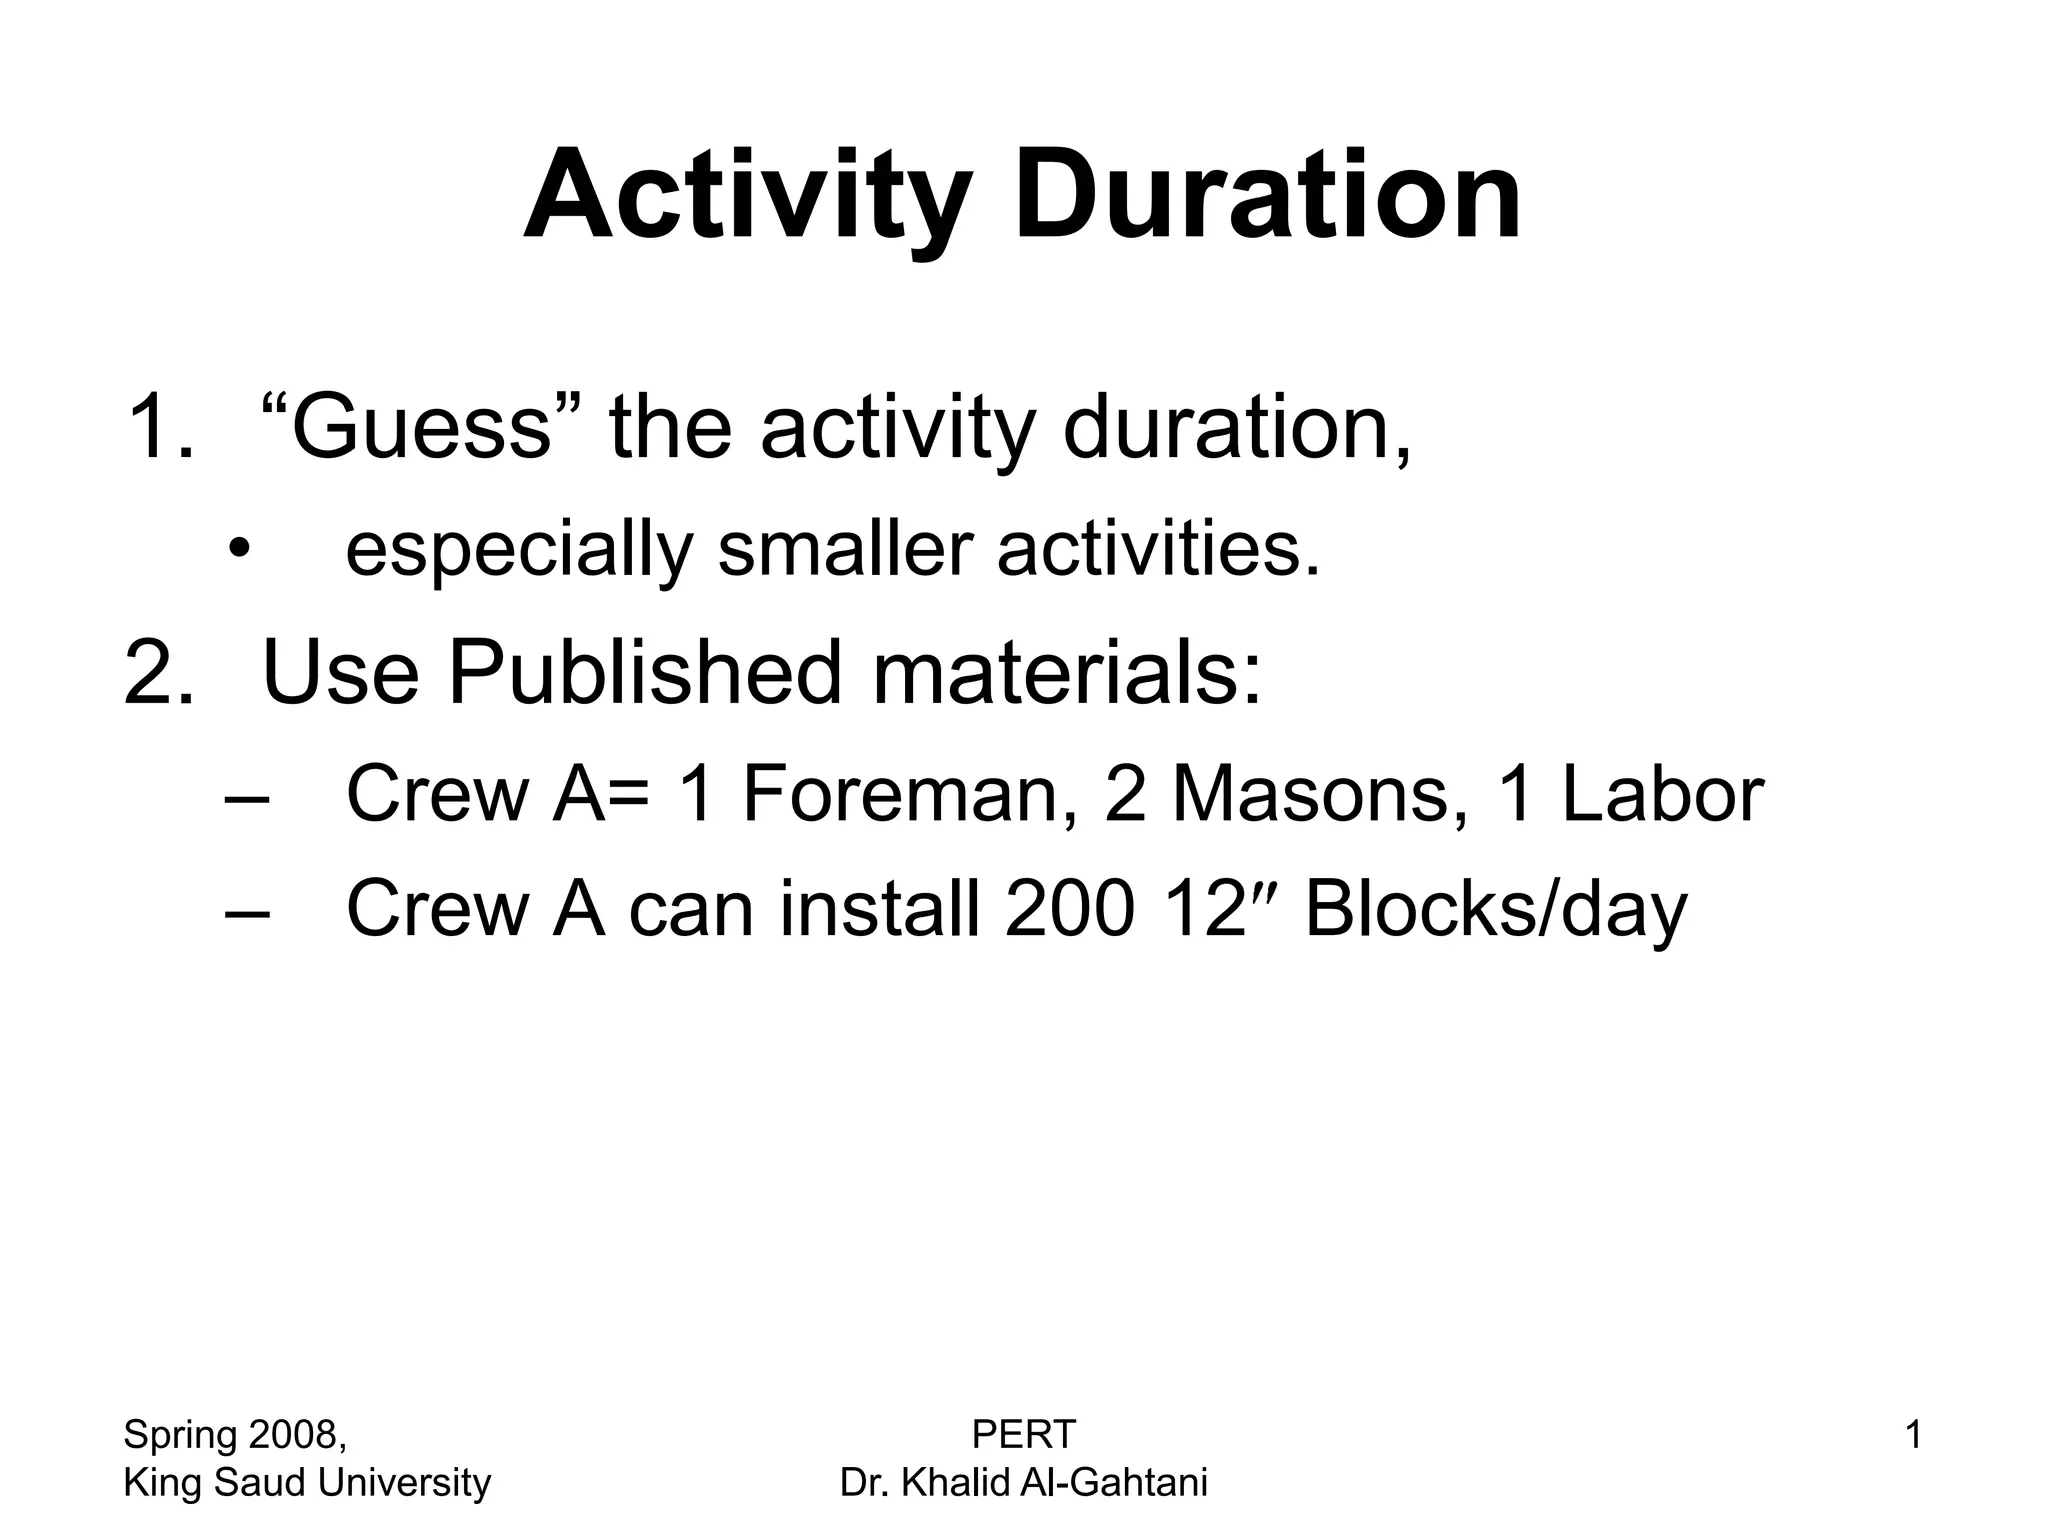
![Variance
• 2 (te) = [(b-a) /3.2]2
– (5%-95% Assumption)
• 2
(te) = Uncertainty about the activity
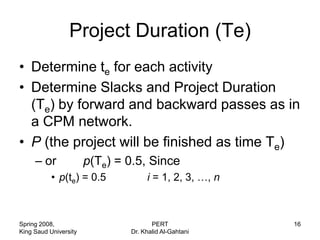
durations, where:
– If (b-a) is a large figure, greater uncertainty.
– If (b-a) is small amount, less uncertainty.
Spring 2008, PERT 15
King Saud University Dr. Khalid Al-Gahtani](https://image.slidesharecdn.com/pert-130107203849-phpapp01/85/Pert-15-320.jpg)
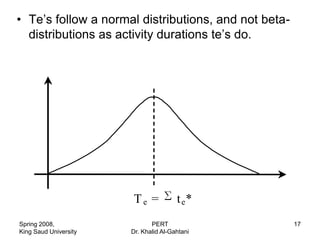
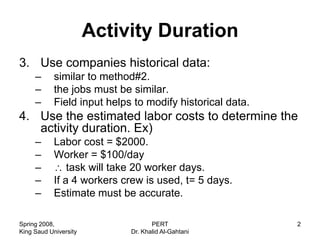
![Example 1
A B C D
a = 4 3 2 4
m = 6 8 4 5
b = 8 9 7 6
2 2 2 2 2 2
(t e ) = [(b-a)/3.2 ] (1.25 ) (1.875 ) (1.5625 ) (0.625 )
te 6 7.33 4.17 5
P ro ject D uratio ns T e = 6 + 7.33 + 4.17 + 5
o r, T e = 22.50 da ys
2 2 2 2
(T e ) = 1 .2 5 1 .8 7 5 1 .5 6 3 0 .6 2 5
= (T e ) = 2.81 3
Spring 2008, PERT 18
King Saud University Dr. Khalid Al-Gahtani](https://image.slidesharecdn.com/pert-130107203849-phpapp01/85/Pert-18-320.jpg)

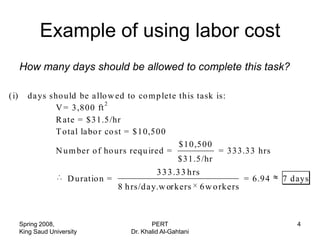
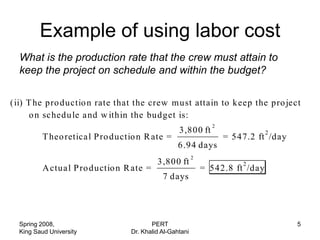
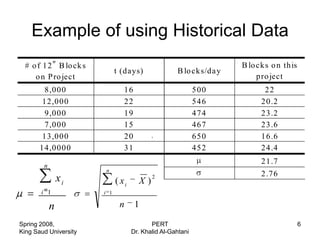
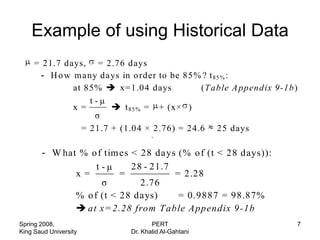
The document discusses four methods for estimating activity durations in project management: 1) guessing, 2) using published materials on similar tasks, 3) using a company's historical data on similar past projects, and 4) calculating duration based on labor costs and rates. It then provides an example of estimating duration using labor costs. The document also discusses using a beta distribution and three time estimates to model activity duration variability in PERT analysis.