
More Related Content
Recently uploaded
Recently uploaded (20)
Featured
Featured (20)
Bab 3
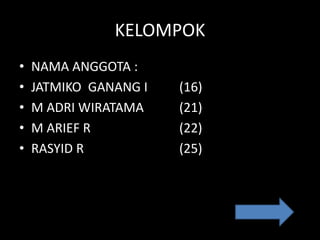
- 1. KELOMPOK • NAMA ANGGOTA : • JATMIKO GANANG I (16) • M ADRI WIRATAMA (21) • M ARIEF R (22) • RASYID R (25)
- 10. PILIHAN CHAPTER CHAPTER 1 CARA MEMBUAT TABEL
- 11. PILIHAN CHAPTER CHAPTER 2 CARA MEMBUAT GRAFIK
- 12. PILIHAN CHAPTER CHAPTER 3 CARA MEMBUAT DIAGRAM
- 14. CHAPTER 1 CARA MEMBUAT TABEL
- 17. TURTORIAL : KLIK INSERT TABLE
- 18. TURTORIAL : TENTUKAN UKURAN TABEL , LALU KLIK OK
- 19. TABEL SUDAH SELESAI DIBUAT CONGRATULATION
- 20. TABEL SUDAH SELESAI DIBUAT CONGRATULATION
- 22. CHAPTER 2 CARA MEMBUAT GRAFIK
- 25. TURTORIAL : PILIH GRAFIK , LALU KLIK OK
- 26. TURTORIAL : TENTUKAN GRAFIK DENGAN MENGGUNAKAN MS EXCEL , LALU TUTUP PROGRAM MS EXCEL
- 27. GRAFIK SUDAH SELESAI DIBUAT CONGRATULATION
- 28. GRAFIK SUDAH SELESAI DIBUAT CONGRATULATION
- 30. CHAPTER 3 CARA MEMBUAT DIAGRAM ORGANISASI
- 32. TURTORIAL : KLIK SMART ART
- 34. TURTORIAL : KLIK ORGANIZATION CHART
- 35. TURTORIAL : TENTUKAN NAMA , LALU TUTUP
- 36. DIAGRAM ORGANISASI SELESAI DIBUAT CONGRATULATION ;
- 37. DIAGRAM ORGANISASI SELESAI DIBUAT CONGRATULATION ;