Download to read offline


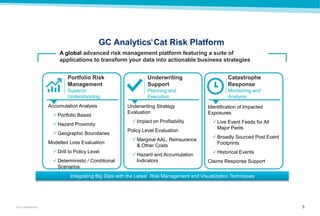
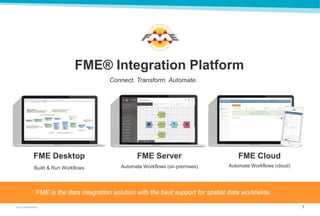
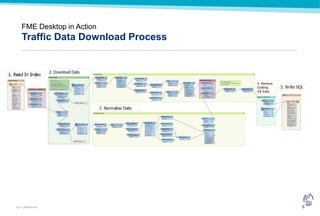
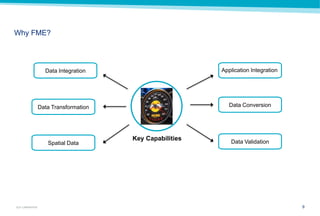
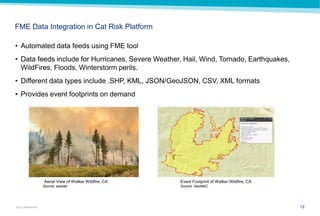
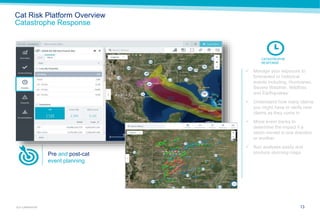
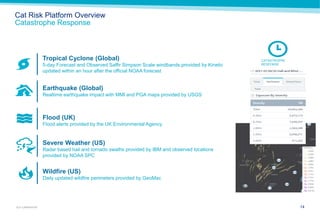
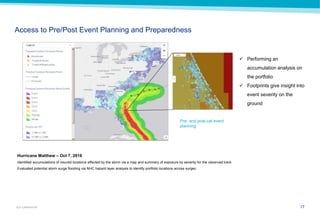
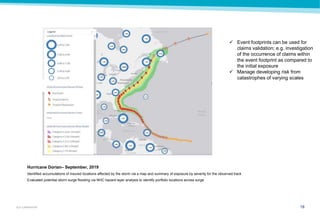
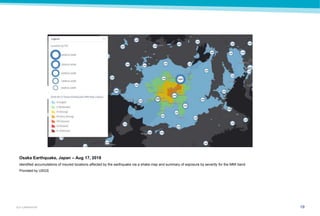
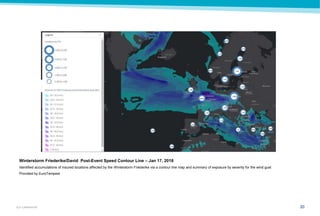
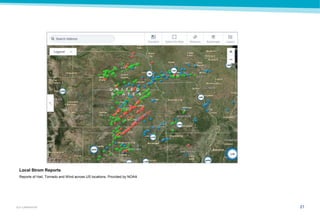

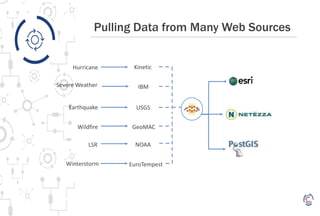
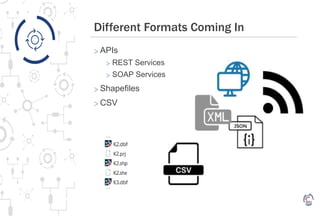
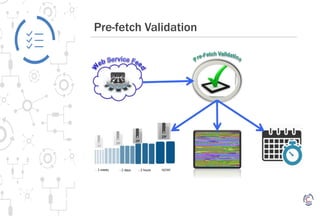
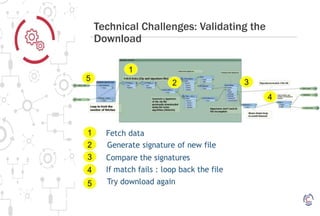
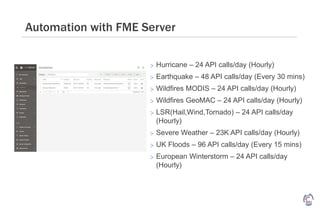


The document discusses how Guy Carpenter uses FME to automate the integration of geographic data on catastrophic events into its risk analysis platform. It loads data from various sources on hurricanes, earthquakes, wildfires, and other perils and transforms it into usable formats. This allows for pre-event planning and post-event response like claims validation. FME enables scheduling automated data feeds and validating the loads. The platform provides exposure analysis, event monitoring, and underwriting support through access to live and historical event footprints.