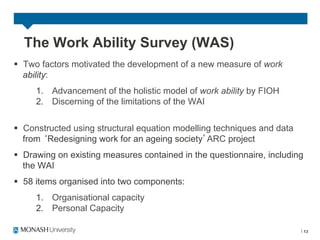
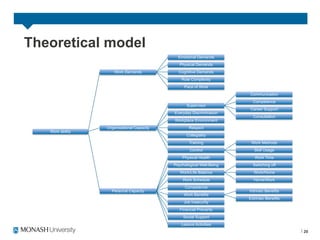
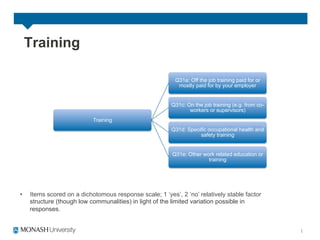
What is the Workability of the
  Australian Workforce?
         Professor Philip Taylor
           Chris McLoughlin
              Erin Watson


                                   16 August 2011
Todays Presentation
§  Background on our research and the concept work ability
§  Describe our current research activities
§  Preview upcoming developments in work ability research


                                                              2
Section 1: Background


                        3
Work ability: Development
§  Developed at the Finnish Institute of Occupational Health
     –    30 year longitudinal study
     –    Work Ability Index (WAI)
     –    Framework for PWA
     –    International Symposia
     –    Evolving theoretical model


                                                                4
The Work Ability Index (WAI)
§  Work ability was first used in the early 1980s, the WAI following shortly
    after
§  Primary tool for the Finnish longitudinal study
§  Identified factors associated with work ability
§  Formed the basis for activities to promote individuals work ability
§  Facilitated development of new ways of thinking about work ability


                                                                                5
The Work Ability Index: 7 Items
1.  Current work ability compared to lifetime best
2.  Work ability in relation to the demands of job (two items)
3.  Number of diseases diagnosed by a physician (14 disease
    categories)
4.  Estimated work impairment due to disease
5.  Sick leave during the past year
6.  Own prognosis of work ability two years from now
7.  Mental resources (3 items)


                                                                 6
50


45


40


35


30


25


20


15


10


5
18

      20

           22

                24

                     26

                          28

                               30

                                    32

                                         34

                                              36

                                                   38

                                                        40

                                                             42

                                                                  44

                                                                       46

                                                                            48

                                                                                 50

                                                                                      52

                                                                                           54

                                                                                                56

                                                                                                     58

                                                                                                          60

                                                                                                               62

                                                                                                                    64
     WAI score by age – Finnish longitudinal study


                                                                                                                         7
The holistic model of work ability


                                     8
Redesigning work for an ageing society
§  Australian Research Council funded project
§  Mixed method approach including large employee survey (n ≈ 1700)
§  Employed or modified items from:
     –    WAI
     –    Copenhagen Psychosocial Questionnaire
     –    European Foundation survey on working conditions
     –    Household Income and Labour Dynamics in Australia


§  Unexpected results obtained for the WAI


                                                                       9
WAI scores: Australia and Finland
                         '#$                    89:$;8<$3606=6/>$
          7225$
                         !#$
                                                ?@//@:A$;8<$

                                      &!#$
      423+560+$
                                      &!#$


                                                               !(#$
          1223$
                                                                              %!#$


                                                                      '%#$
      +,-+..+/0$
                                                       !"#$


                   )#$         &)#$      ")#$   !)#$          ')#$     %)#$          *)#$

Drawing on three Australian studies conducted between 2005 and 2009, we found poor discrimination
among participants using the WAI – a trend that is similar to Finnish longitudinal data.


                                                                                                    10
Limitations of the WAI: So what?
§  Psychometric considerations
     –  Poor discrimination between participants means:

          1.  interventions are difficult to evaluate and
          2.  screening suffers high false negative classification

     –  Highly skewed data limits multivariate analysis
§  Theoretical considerations
     –  Measuring an evolving construct using a static measure?
     –  Face validity cannot be clearly asserted
     –  Work ability has implications beyond retirement intentions


                                                                     11
Section 2: Current Activities


                                12
The Work Ability Survey (WAS)
§  Two factors motivated the development of a new measure of work
    ability:
     1.  Advancement of the holistic model of work ability by FIOH
     2.  Discerning of the limitations of the WAI


§  Constructed using structural equation modelling techniques and data
    from Redesigning work for an ageing society ARC project
§  Drawing on existing measures contained in the questionnaire, including
    the WAI
§  58 items organised into two components:
     1.  Organisational capacity
     2.  Personal Capacity

                                                                             13
14
WAS characteristics
§  The WAS demonstrated improved predictive validity compared to the
    WAI (shown in table below)
§  Business is engaged by personal/organisational dichotomy
     –  Case and intervention studies across 4 organisations
§  Clear delineation and measurement of underlying factors
§  Relative importance of underlying factors assessable

Variance in outcome variables explained (R2)
                                                           WAS   WAI
Job Satisfaction                                           31%   6%
Personally meaningful work                                 24%   5%
Number of health problems due to work                      20%   19%

                                                                        15
WAS: Advantages
§  Psychometric considerations
     –  Improved discrimination allows the investigation of intervention
        effects across the work ability continuum
     –  Normally distributed scale scores are suitable for robust
        multivariate analysis


§  Theoretical considerations
     –  Measure based current conceptualisations of work ability
     –  Face validity can be asserted and assessed by researchers
     –  Reflects the change in the use of the work ability concept beyond
        a predictor of retirement intentions


                                                                            16
WAS: Limitations
§  With 58 items, the measure is currently not suitable for screening
§  Limited coverage of conceptual elements of work ability
§  Developed using non-representative data
§  Indications of model misspecification confounded by item response
    categories


                                                                         17
Section 3: Preview


                     18
Work Ability Survey Revised (WAS-R)
§  Monash University and Safe Work Australia
§  Nationally representative sample of workers (n ≈ 3200)
§  Methodologically sound approach to scale development
§  Improved coverage of operationalisable elements of the conceptual
    model
§  Current status:
      –  Data collection to be completed this month
      –  Assessing problems in patterns of responses
      –  Initiating modelling analyses


                                                                        19
Theoretical model
                                              Emotional Demands
                                               Physical Demands
                      Work Demands            Cognitive Demands
                                                Role Complexity
                                                 Pace of Work
                                                                       Communication
                                                                         Competence
                                                   Supervisor
                                                                       Career Support
                                            Everyday Discrimination
                                                                         Consultation
                                            Workplace Environment
                  Organisational Capacity           Respect
   Work ability
                                                   Collegiality
                                                    Training            Work Methods
                                                     Control              Skill Usage
                                                Physical Health           Work Time
                                            Psychological Well-Being     Switching off
                                               Work/Life Balance         Work/Home
                                                Work Schedule            Home/Work
                                                  Competence
                    Personal Capacity                                  Intrinsic Benefits
                                                 Work Benefits
                                                                       Extrinsic Benefits
                                                 Job Insecurity
                                               Financial Precarity
                                                 Social Support
                                                Leisure Activities
                                                                                            20
Loss of
                                            confidence


Psychological                                Social
 well-being                               performance

                                          Anhedonia –
                                             sleep
                                          disturbance
Personal capacity: Psychological well-being
Using 12 item General Health Questionnaire (GHQ-12) we identified
three elements of psychological well-being – a structure
recommended in previous literature.


                                                                    21
Loss of Confidence        Social Performance        Anhedonia; Sleep Disturbance


               60

               50

               40

               30

               20

               10

                0
                      18 - 24        25 - 34    35 - 44        45 - 54    55 - 64      65 and older


                         Psychological well-being and age
The overall psychological well-being score was highest for the oldest age group, the mean scale score was 6%
to 12% higher than all other age groups. A similar pattern was obtained for respondents between the age of 55
to 64 years, with a mean scale score around 6% higher than the younger age groups. There were no significant
mean differences among the younger age groups. The three sub-scales constituting the psychological well-
being scale reflected a similar pattern of responses, with participants over the age of 55 years reporting the
most positive assessment of their psychological well-being.


                                                                                                          22
Everyday discrimination
                                     Q27a: Being ignored by colleagues or treated as if you didn’t exist


                                             Q27b: Being left out of a social gathering at work
                       Social
                   Discrimination
                                                Q27c: Being excluded from a work meeting


                                                       Q27d: Being set up for failure
    Everyday
  discrimination
                                                  Q27e: Being passed over for promotion


                                                 Q27f: Not getting privileges others receive
                   Advancement
                   Discrimination
                                           Q27j: Your work performance being evaluated unfairly


                                    Q27k: Not getting the opportunities you needed to be competitive for
                                                                 promotion
Everyday discrimination: Removed items


                     Q27g Your property being damaged


                      Q27h: Insulting jokes or comments
REMOVED
 ITEMS
          Q27i: Receiving insufficient information to do your job properly


               Q27l: Feeling as though you were being pushed out
Everyday Discrimination; Social Discrimination

                              Everyday Discrimination; Advancement Discrimination

             20


             18


             16


             14


             12


             10
                   18 - 24     25 - 34         35 - 44          45 - 54        55 - 64   65 and older


                             Everyday discrimination
The everyday discrimination scale scores were largely comparable across the age groups. However, when
advancement discrimination was considered, it was found that respondents aged 65 and over reported
higher mean scores than employees aged between 25 and 54. A notable distinction was that the oldest age
group did not report more advancement related everyday discrimination on average than participants
between 55 and 64 years and those aged 18 to 24 years.


                                                                                                        25
Employment insecurity
                                    Q24a: Becoming
                                     unemployed


                                 Q24b: New technology
                                 making you redundant

      Employment insecurity
                              Q24c: Finding it difficult to find
                               another job if you become
                                      unemployed


                                Q24d: Being transferred to
                               another job against your will
19


            18


            18


            17


            17


            16


            16
                   18 - 24     25 - 34     35 - 44     45 - 54     55 - 64   65 and older


                                         Job insecurity
Respondents over the age of 65 years reported the highest levels of job insecurity, a notable
distinction from those participants between the age of 45 and 64 years that reported the lowest
levels of job insecurity. Interestingly, workers aged between 18 and 44 years reported
comparable levels of job insecurity.


                                                                                                  27
Training

                                                           Q31a: Off the job training paid for or
                                                            mostly paid for by your employer


                                                         Q31c: On the job training (e.g. from co-
                                                                workers or supervisors)
                            Training
                                                         Q31d: Specific occupational health and
                                                                    safety training


                                                         Q31e: Other work related education or
                                                                       training


•    Items scored on a dichotomous response scale; 1 ‘yes’, 2 ‘no’ relatively stable factor
     structure (though low communalities) in light of the limited variation possible in
     responses.
Training: removed items


     Removed    Q31b: Off the job education
      items        paid for by yourself
7


 6


 5


 4


 3


 2


 1
        18 - 24       25 - 34      35 - 44       45 - 54       55 - 64    65 and older


                                         Training

Participants over the age of 55 years were the least likely to report undertaking work
related training over the last 12 months. This group scored significantly lower on average
on the training scale score though the mean differences were small.


                                                                                             30
Does management at your
                                            workplace respect you


                                          Are you treated fairly at your
                                                   workplace


                                          Are conflicts resolved in a fair
            Respect
                                                        way


                                        Are employees appreciated when
                                           they have done a good job


                                        Are all suggestions from employees
                                         treated seriously by management


Organisational Capacity: Respect
Drawing from items used in the Copenhagen Psychosocial
Questionnaire, this factor has been important for the majority of case
study organisations using the WAS


                                                                             31
19.5


 19


18.5


 18


17.5


 17


16.5
       18 - 24   25 - 34    35 - 44   45 - 54    55 - 64   65 and older


   Organisational respect
   There was a statistically significant downwards trend in
   reports of levels of respect.


                                                                          32
Work Ability Survey Revised (WAS-R)
§  Next steps:
     –  Complete modelling process
     –  Consider work ability and workplace injuries
     –  Delve into; industry, sectorial, occupational, organisation type,
        gender, age, socio-economic position and work ability
§  Future directions
     –  Benchmark WAS-R scores for Australian workers
     –  Extend project through longitudinal design
     –  Refine measure – responding to data and method advances
     –  Track changes in work ability over time and developing
        international comparison data
                                                                            33
Thank you
Professor Philip Taylor
philip.taylor@monash.edu


                           34

Australian work ability presentation

  • 1.
    What is theWorkability of the Australian Workforce? Professor Philip Taylor Chris McLoughlin Erin Watson 16 August 2011
  • 2.
    Todays Presentation §  Backgroundon our research and the concept work ability §  Describe our current research activities §  Preview upcoming developments in work ability research 2
  • 3.
  • 4.
    Work ability: Development § Developed at the Finnish Institute of Occupational Health –  30 year longitudinal study –  Work Ability Index (WAI) –  Framework for PWA –  International Symposia –  Evolving theoretical model 4
  • 5.
    The Work AbilityIndex (WAI) §  Work ability was first used in the early 1980s, the WAI following shortly after §  Primary tool for the Finnish longitudinal study §  Identified factors associated with work ability §  Formed the basis for activities to promote individuals work ability §  Facilitated development of new ways of thinking about work ability 5
  • 6.
    The Work AbilityIndex: 7 Items 1.  Current work ability compared to lifetime best 2.  Work ability in relation to the demands of job (two items) 3.  Number of diseases diagnosed by a physician (14 disease categories) 4.  Estimated work impairment due to disease 5.  Sick leave during the past year 6.  Own prognosis of work ability two years from now 7.  Mental resources (3 items) 6
  • 7.
    50 45 40 35 30 25 20 15 10 5 18 20 22 24 26 28 30 32 34 36 38 40 42 44 46 48 50 52 54 56 58 60 62 64 WAI score by age – Finnish longitudinal study 7
  • 8.
    The holistic modelof work ability 8
  • 9.
    Redesigning work foran ageing society §  Australian Research Council funded project §  Mixed method approach including large employee survey (n ≈ 1700) §  Employed or modified items from: –  WAI –  Copenhagen Psychosocial Questionnaire –  European Foundation survey on working conditions –  Household Income and Labour Dynamics in Australia §  Unexpected results obtained for the WAI 9
  • 10.
    WAI scores: Australiaand Finland '#$ 89:$;8<$3606=6/>$ 7225$ !#$ ?@//@:A$;8<$ &!#$ 423+560+$ &!#$ !(#$ 1223$ %!#$ '%#$ +,-+..+/0$ !"#$ )#$ &)#$ ")#$ !)#$ ')#$ %)#$ *)#$ Drawing on three Australian studies conducted between 2005 and 2009, we found poor discrimination among participants using the WAI – a trend that is similar to Finnish longitudinal data. 10
  • 11.
    Limitations of theWAI: So what? §  Psychometric considerations –  Poor discrimination between participants means: 1.  interventions are difficult to evaluate and 2.  screening suffers high false negative classification –  Highly skewed data limits multivariate analysis §  Theoretical considerations –  Measuring an evolving construct using a static measure? –  Face validity cannot be clearly asserted –  Work ability has implications beyond retirement intentions 11
  • 12.
    Section 2: CurrentActivities 12
  • 13.
    The Work AbilitySurvey (WAS) §  Two factors motivated the development of a new measure of work ability: 1.  Advancement of the holistic model of work ability by FIOH 2.  Discerning of the limitations of the WAI §  Constructed using structural equation modelling techniques and data from Redesigning work for an ageing society ARC project §  Drawing on existing measures contained in the questionnaire, including the WAI §  58 items organised into two components: 1.  Organisational capacity 2.  Personal Capacity 13
  • 14.
  • 15.
    WAS characteristics §  TheWAS demonstrated improved predictive validity compared to the WAI (shown in table below) §  Business is engaged by personal/organisational dichotomy –  Case and intervention studies across 4 organisations §  Clear delineation and measurement of underlying factors §  Relative importance of underlying factors assessable Variance in outcome variables explained (R2) WAS WAI Job Satisfaction 31% 6% Personally meaningful work 24% 5% Number of health problems due to work 20% 19% 15
  • 16.
    WAS: Advantages §  Psychometricconsiderations –  Improved discrimination allows the investigation of intervention effects across the work ability continuum –  Normally distributed scale scores are suitable for robust multivariate analysis §  Theoretical considerations –  Measure based current conceptualisations of work ability –  Face validity can be asserted and assessed by researchers –  Reflects the change in the use of the work ability concept beyond a predictor of retirement intentions 16
  • 17.
    WAS: Limitations §  With58 items, the measure is currently not suitable for screening §  Limited coverage of conceptual elements of work ability §  Developed using non-representative data §  Indications of model misspecification confounded by item response categories 17
  • 18.
  • 19.
    Work Ability SurveyRevised (WAS-R) §  Monash University and Safe Work Australia §  Nationally representative sample of workers (n ≈ 3200) §  Methodologically sound approach to scale development §  Improved coverage of operationalisable elements of the conceptual model §  Current status: –  Data collection to be completed this month –  Assessing problems in patterns of responses –  Initiating modelling analyses 19
  • 20.
    Theoretical model Emotional Demands Physical Demands Work Demands Cognitive Demands Role Complexity Pace of Work Communication Competence Supervisor Career Support Everyday Discrimination Consultation Workplace Environment Organisational Capacity Respect Work ability Collegiality Training Work Methods Control Skill Usage Physical Health Work Time Psychological Well-Being Switching off Work/Life Balance Work/Home Work Schedule Home/Work Competence Personal Capacity Intrinsic Benefits Work Benefits Extrinsic Benefits Job Insecurity Financial Precarity Social Support Leisure Activities 20
  • 21.
    Loss of confidence Psychological Social well-being performance Anhedonia – sleep disturbance Personal capacity: Psychological well-being Using 12 item General Health Questionnaire (GHQ-12) we identified three elements of psychological well-being – a structure recommended in previous literature. 21
  • 22.
    Loss of Confidence Social Performance Anhedonia; Sleep Disturbance 60 50 40 30 20 10 0 18 - 24 25 - 34 35 - 44 45 - 54 55 - 64 65 and older Psychological well-being and age The overall psychological well-being score was highest for the oldest age group, the mean scale score was 6% to 12% higher than all other age groups. A similar pattern was obtained for respondents between the age of 55 to 64 years, with a mean scale score around 6% higher than the younger age groups. There were no significant mean differences among the younger age groups. The three sub-scales constituting the psychological well- being scale reflected a similar pattern of responses, with participants over the age of 55 years reporting the most positive assessment of their psychological well-being. 22
  • 23.
    Everyday discrimination Q27a: Being ignored by colleagues or treated as if you didn’t exist Q27b: Being left out of a social gathering at work Social Discrimination Q27c: Being excluded from a work meeting Q27d: Being set up for failure Everyday discrimination Q27e: Being passed over for promotion Q27f: Not getting privileges others receive Advancement Discrimination Q27j: Your work performance being evaluated unfairly Q27k: Not getting the opportunities you needed to be competitive for promotion
  • 24.
    Everyday discrimination: Removeditems Q27g Your property being damaged Q27h: Insulting jokes or comments REMOVED ITEMS Q27i: Receiving insufficient information to do your job properly Q27l: Feeling as though you were being pushed out
  • 25.
    Everyday Discrimination; SocialDiscrimination Everyday Discrimination; Advancement Discrimination 20 18 16 14 12 10 18 - 24 25 - 34 35 - 44 45 - 54 55 - 64 65 and older Everyday discrimination The everyday discrimination scale scores were largely comparable across the age groups. However, when advancement discrimination was considered, it was found that respondents aged 65 and over reported higher mean scores than employees aged between 25 and 54. A notable distinction was that the oldest age group did not report more advancement related everyday discrimination on average than participants between 55 and 64 years and those aged 18 to 24 years. 25
  • 26.
    Employment insecurity Q24a: Becoming unemployed Q24b: New technology making you redundant Employment insecurity Q24c: Finding it difficult to find another job if you become unemployed Q24d: Being transferred to another job against your will
  • 27.
    19 18 18 17 17 16 16 18 - 24 25 - 34 35 - 44 45 - 54 55 - 64 65 and older Job insecurity Respondents over the age of 65 years reported the highest levels of job insecurity, a notable distinction from those participants between the age of 45 and 64 years that reported the lowest levels of job insecurity. Interestingly, workers aged between 18 and 44 years reported comparable levels of job insecurity. 27
  • 28.
    Training Q31a: Off the job training paid for or mostly paid for by your employer Q31c: On the job training (e.g. from co- workers or supervisors) Training Q31d: Specific occupational health and safety training Q31e: Other work related education or training •  Items scored on a dichotomous response scale; 1 ‘yes’, 2 ‘no’ relatively stable factor structure (though low communalities) in light of the limited variation possible in responses.
  • 29.
    Training: removed items Removed Q31b: Off the job education items paid for by yourself
  • 30.
    7 6 5 4 3 2 1 18 - 24 25 - 34 35 - 44 45 - 54 55 - 64 65 and older Training Participants over the age of 55 years were the least likely to report undertaking work related training over the last 12 months. This group scored significantly lower on average on the training scale score though the mean differences were small. 30
  • 31.
    Does management atyour workplace respect you Are you treated fairly at your workplace Are conflicts resolved in a fair Respect way Are employees appreciated when they have done a good job Are all suggestions from employees treated seriously by management Organisational Capacity: Respect Drawing from items used in the Copenhagen Psychosocial Questionnaire, this factor has been important for the majority of case study organisations using the WAS 31
  • 32.
    19.5 19 18.5 18 17.5 17 16.5 18 - 24 25 - 34 35 - 44 45 - 54 55 - 64 65 and older Organisational respect There was a statistically significant downwards trend in reports of levels of respect. 32
  • 33.
    Work Ability SurveyRevised (WAS-R) §  Next steps: –  Complete modelling process –  Consider work ability and workplace injuries –  Delve into; industry, sectorial, occupational, organisation type, gender, age, socio-economic position and work ability §  Future directions –  Benchmark WAS-R scores for Australian workers –  Extend project through longitudinal design –  Refine measure – responding to data and method advances –  Track changes in work ability over time and developing international comparison data 33
  • 34.
    Thank you Professor PhilipTaylor philip.taylor@monash.edu 34