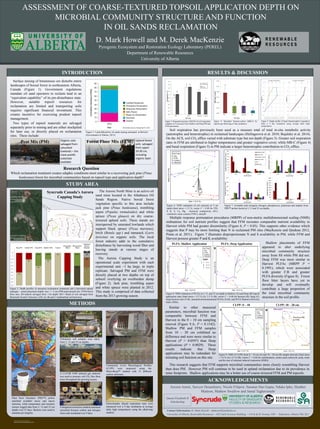
RESEARCH POSTER PRESENTATION DESIGN © 2012
www.PosterPresentations.com
INTRODUCTION
Contact Information: D. Mark Howell ~ dmhowell@ualberta.ca
University of Alberta, Renewable Resources ~ 442 Earth Sciences Building ~ 116 St & 85 Avenue, NW ~ Edmonton, Alberta T6G 2E3
Pyrogenic Ecosystem and Restoration Ecology Laboratory (PEREL)
Department of Renewable Resources
University of Alberta
D. Mark Howell and M. Derek MacKenzie
ASSESSMENT OF COARSE-TEXTURED TOPSOIL APPLICATION DEPTH ON
MICROBIAL COMMUNITY STRUCTURE AND FUNCTION
IN OIL SANDS RECLAMATION
R E N E W A B L E
R E S O U R C E S
STUDY AREA
METHODS
RESULTS & DISCUSSION
ACKNOWLEDGEMENTS
Research Question
Which reclamation treatment creates edaphic conditions most similar to a recovering jack pine (Pinus
banksiana) forest for microbial communities based on topsoil type and application depth?
Surface mining of bituminous ore disturbs entire
landscapes of boreal forest in northeastern Alberta,
Canada (Figure 1). Government regulations
mandate oil sand operators to reclaim land to an
“equivalent capability” of its pre-disturbance state.
However, suitable topsoil resources for
reclamation are limited and transporting soils
requires significant financial investment. This
creates incentive for exercising prudent topsoil
management.
Two types of topsoil materials are salvaged
separately prior to mining and are either stockpiled
for later use, or directly placed on reclamation
sites. These include:
Figure 1: Land affected by oil sands mining estimated at 844 km2
(Government of Alberta, 2013).
Syncrude Canada’s Aurora
Capping Study
Figure 2: Depth profiles of measured reclamation treatments and a harvested natural
analogue – actual placement depths vary +/- 5 cm (PM=peat/mineral mix; FFM=forest
floor mix; SS=subsoil salvaged from >1m depth; B/C= blend of soil salvaged from
Brunisolic B and C horizons; LFH, Ae, Bt and C=undisturbed soil horizons).
Fort McMurray,
AB
Aurora North
Mine
The Aurora North Mine is an active oil
sand mine located in the Athabasca Oil
Sands Region. Native boreal forest
vegetation specific to this area include
jack pine (Pinus banksiana), trembling
aspen (Populus tremuloides) and white
spruce (Picea glauca) on dry coarse-
textured upland soils. These stands are
interspersed by saturated lowlands which
support black spruce (Picea mariana),
birch (Betula spp.) and tamarack (Larix
laricina) on organic soils. The local
forest industry adds to the cumulative
disturbance by harvesting wood fiber and
leaving stands at various stages of
recovery.
The Aurora Capping Study is an
operational scale experiment with each
experimental unit ~1 ha large, in triple
replicate. Salvaged PM and FFM were
directly placed at two depths on top of
subsoil overlying an overburden dump
(Figure 2). Jack pine, trembling aspen
and white spruce were planted in 2012.
This study is comprised of data collected
from the 2013 growing season.
Community Level Physiological Profiles
(CLPP) were measured using the
MircroResp™ method with 15 different
carbon substrates.
Plant Root Simulator (PRS™) probes
adsorbed available micro and macro
nutrients, while temperature and moisture
sensors logged data from 5, 15 and 35 cm
depths over 57 days. Buckets were used to
maintain pit integrity.
Volumetric soil samples were taken
from 5, 15 and 35 cm depths.
A LI-COR 8100 infrared gas analyzer
was used to measure soil CO2 flux three
times throughout the growing season.
Heterotrophic (basal) respiration rates were
measured over a 9 day incubation at average
daily high temperatures using the alkali-trap
method.
Fumigation/extraction method measured
microbial biomass carbon and nitrogen
from soils incubated over 9 days.
Soil respiration has previously been used as a measure total of total in-situ metabolic activity
(autotrophic and heterotrophic) in reclaimed landscapes (Helingerová et al. 2010; Bujalský et al. 2014).
On the ACS, soil CO2 efflux varied with substrate type but not depth (Figure 3). Greater soil respiration
rates in FFM are attributed to higher temperatures and greater vegetative cover, while MB-C (Figure 4)
and basal respiration (Figure 5) in PM indicate a larger heterotrophic contribution to CO2 efflux.
This research suggests that FFM supports microbial communities more closely resembling Harvest
than does PM. However PM will continue to be used in upland reclamation due to its prevalence in
mine footprints. Shallow applications may be a better use of coarse-textured FFM and PM topsoils.
Arezoo Amini, Sawyer Desaulniers, Nicole Filipow, Sanatan Das Gupta, Nduka Ipko, Heather
Mattson, Mathew Swallow and Jamal Taghavimehr
Queen Elizabeth II
Scholarship
Forest Floor Mix (FFM)Peat Mix (PM) Organic soils
salvaged from
saturated
lowlands – the
most prolific
substrate
available
Upland forest
soils salvaged
from upper
10-20 cm,
including
organic layer.
CLPP
Multiple response permutation procedures (MRPP) of non-metric multidimensional scaling (NMS)
ordinations for soil nutrient profiles suggest that FFM recreates comparable nutrient availability to
Harvest while PM had greater dissimilarity (Figure 6; P < 0.05). This supports other evidence which
suggests that P may be more limiting than N in reclaimed PM sites (MacKenzie and Quideau 2012,
Pinno et al. 2011). Figure 7 illustrates disproportionate N and S availability in PM, while FFM and
Harvest possess greater P and K availability.
Figure 3: Repeated measures ANOVA of soil respiration
sampled on 3 occasions from Shallow and Deep PM and
FFM placements.
Figure 4: Microbial biomass-carbon (MB-C) by
topsoil type following a 9 day incubation.
Figure 5: Depth profile of basal (heterotrophic) respiration
from a 9 day incubation using average daily high
temperatures.
Figure 6: NMS ordination of soil nutrients at 5 cm
depth (final stress = 3.2 %; vector r2 > 0.40 for TIN,
P, K, S, Ca, Mg , electrical conductivity (EC),
volumetric water content (VWC), and pH
VWC
pH
ECTIN
Ca
Mg
K
P
S
Axis 1 (2.4 %)
Axis2(77.3%)
Soil Type
PM
FFM
Control
Harvest
Figure 7: Available total inorganic nitrogen, phosphorous, potassium and sulphur from
PRS™ probes buried at 5, 15 and 35 cm depths.
F:B
S:M
SDI
Axis 1 (5.4 %)
Axis2(76.2%)
TRTxDept
105
115
135
705
715
735
1235
1305
1315
1335
Figure 8: NMS ordination of PLFAs at 5, 15, and 35 cm depth in Shallow (A) and Deep (B) topsoil
application rates (final stress = 5.2 % (A), 3.3 % (B); vector r2 > 0.40 for bacteria (B), fungi (F),
fungi:bacteria ratio (F:B), saturated:monounsaturated PLFAs (S:M), and PLFA Shannon Diversity
Index (SDI)).
MB-C
F
B
S:M
SDI
Axis 1 (6.8 %)
Axis2(84.5%)
TRTxDept
205
215
235
305
315
335
1235
1305
1315
1335
A B
PLFA: Shallow Application PLFA: Deep Application Shallow placements of FFM
appeared to alter underlying
microbial community structure
away from SS while PM did not.
Deep FFM was most similar to
Harvest PLFAs (MRPP P =
0.1991), which were associated
with greater F:B and greater
PLFA diversity (Figure 8). Forest
floor litter layers have yet to
develop and will eventually
contribute a large proportion of
the total microbial community
structure in the soil profile.
Similar to other measured
parameters, microbial function was
comparable between FFM and
Harvest in the 0 – 10 cm sampling
interval (Figure 9.A; P = 0.1542).
Shallow PM and FFM samples
from 10 – 20 cm exhibited no
difference and were more similar to
Harvest (P = 0.0597) than Deep
applications (P = 0.0029). These
results indicate that Deep
applications may be redundant for
initiating soil function on this site.
Depth
● 5 cm
▲ 15 cm
■ 35 cm
SSIR
Carbohydrates
Amino Acids
Carboxylic Acids
Water
Axis 1 (13.1 %)
Axis2(77.7%)
Soil Type
PM
FFM
Control
Harvest
Figure 9: NMS of CLPPs from 0 – 10 cm (A) and 10 – 20 cm (B) sample intervals (final stress
= 7.6 % (A), 4.3 % (B); vector r2 > 0.40 for carbohydrates, amino acids carboxylic acids, water
and the sum of substrate induced respiration (SSIR)).
A B
CLPP: 0 – 10 CLPP: 10 – 20 cm
SSIR
Carbohydrates
Amino Acids
Carboxylic Acids
Water
Axis 1 (13.1 %)
Axis2(77.7%)
Soil Type
PM
FFM
Control
Harvest

Aurora poster for ASSW 2015

  • 1.
    RESEARCH POSTER PRESENTATIONDESIGN © 2012 www.PosterPresentations.com INTRODUCTION Contact Information: D. Mark Howell ~ dmhowell@ualberta.ca University of Alberta, Renewable Resources ~ 442 Earth Sciences Building ~ 116 St & 85 Avenue, NW ~ Edmonton, Alberta T6G 2E3 Pyrogenic Ecosystem and Restoration Ecology Laboratory (PEREL) Department of Renewable Resources University of Alberta D. Mark Howell and M. Derek MacKenzie ASSESSMENT OF COARSE-TEXTURED TOPSOIL APPLICATION DEPTH ON MICROBIAL COMMUNITY STRUCTURE AND FUNCTION IN OIL SANDS RECLAMATION R E N E W A B L E R E S O U R C E S STUDY AREA METHODS RESULTS & DISCUSSION ACKNOWLEDGEMENTS Research Question Which reclamation treatment creates edaphic conditions most similar to a recovering jack pine (Pinus banksiana) forest for microbial communities based on topsoil type and application depth? Surface mining of bituminous ore disturbs entire landscapes of boreal forest in northeastern Alberta, Canada (Figure 1). Government regulations mandate oil sand operators to reclaim land to an “equivalent capability” of its pre-disturbance state. However, suitable topsoil resources for reclamation are limited and transporting soils requires significant financial investment. This creates incentive for exercising prudent topsoil management. Two types of topsoil materials are salvaged separately prior to mining and are either stockpiled for later use, or directly placed on reclamation sites. These include: Figure 1: Land affected by oil sands mining estimated at 844 km2 (Government of Alberta, 2013). Syncrude Canada’s Aurora Capping Study Figure 2: Depth profiles of measured reclamation treatments and a harvested natural analogue – actual placement depths vary +/- 5 cm (PM=peat/mineral mix; FFM=forest floor mix; SS=subsoil salvaged from >1m depth; B/C= blend of soil salvaged from Brunisolic B and C horizons; LFH, Ae, Bt and C=undisturbed soil horizons). Fort McMurray, AB Aurora North Mine The Aurora North Mine is an active oil sand mine located in the Athabasca Oil Sands Region. Native boreal forest vegetation specific to this area include jack pine (Pinus banksiana), trembling aspen (Populus tremuloides) and white spruce (Picea glauca) on dry coarse- textured upland soils. These stands are interspersed by saturated lowlands which support black spruce (Picea mariana), birch (Betula spp.) and tamarack (Larix laricina) on organic soils. The local forest industry adds to the cumulative disturbance by harvesting wood fiber and leaving stands at various stages of recovery. The Aurora Capping Study is an operational scale experiment with each experimental unit ~1 ha large, in triple replicate. Salvaged PM and FFM were directly placed at two depths on top of subsoil overlying an overburden dump (Figure 2). Jack pine, trembling aspen and white spruce were planted in 2012. This study is comprised of data collected from the 2013 growing season. Community Level Physiological Profiles (CLPP) were measured using the MircroResp™ method with 15 different carbon substrates. Plant Root Simulator (PRS™) probes adsorbed available micro and macro nutrients, while temperature and moisture sensors logged data from 5, 15 and 35 cm depths over 57 days. Buckets were used to maintain pit integrity. Volumetric soil samples were taken from 5, 15 and 35 cm depths. A LI-COR 8100 infrared gas analyzer was used to measure soil CO2 flux three times throughout the growing season. Heterotrophic (basal) respiration rates were measured over a 9 day incubation at average daily high temperatures using the alkali-trap method. Fumigation/extraction method measured microbial biomass carbon and nitrogen from soils incubated over 9 days. Soil respiration has previously been used as a measure total of total in-situ metabolic activity (autotrophic and heterotrophic) in reclaimed landscapes (Helingerová et al. 2010; Bujalský et al. 2014). On the ACS, soil CO2 efflux varied with substrate type but not depth (Figure 3). Greater soil respiration rates in FFM are attributed to higher temperatures and greater vegetative cover, while MB-C (Figure 4) and basal respiration (Figure 5) in PM indicate a larger heterotrophic contribution to CO2 efflux. This research suggests that FFM supports microbial communities more closely resembling Harvest than does PM. However PM will continue to be used in upland reclamation due to its prevalence in mine footprints. Shallow applications may be a better use of coarse-textured FFM and PM topsoils. Arezoo Amini, Sawyer Desaulniers, Nicole Filipow, Sanatan Das Gupta, Nduka Ipko, Heather Mattson, Mathew Swallow and Jamal Taghavimehr Queen Elizabeth II Scholarship Forest Floor Mix (FFM)Peat Mix (PM) Organic soils salvaged from saturated lowlands – the most prolific substrate available Upland forest soils salvaged from upper 10-20 cm, including organic layer. CLPP Multiple response permutation procedures (MRPP) of non-metric multidimensional scaling (NMS) ordinations for soil nutrient profiles suggest that FFM recreates comparable nutrient availability to Harvest while PM had greater dissimilarity (Figure 6; P < 0.05). This supports other evidence which suggests that P may be more limiting than N in reclaimed PM sites (MacKenzie and Quideau 2012, Pinno et al. 2011). Figure 7 illustrates disproportionate N and S availability in PM, while FFM and Harvest possess greater P and K availability. Figure 3: Repeated measures ANOVA of soil respiration sampled on 3 occasions from Shallow and Deep PM and FFM placements. Figure 4: Microbial biomass-carbon (MB-C) by topsoil type following a 9 day incubation. Figure 5: Depth profile of basal (heterotrophic) respiration from a 9 day incubation using average daily high temperatures. Figure 6: NMS ordination of soil nutrients at 5 cm depth (final stress = 3.2 %; vector r2 > 0.40 for TIN, P, K, S, Ca, Mg , electrical conductivity (EC), volumetric water content (VWC), and pH VWC pH ECTIN Ca Mg K P S Axis 1 (2.4 %) Axis2(77.3%) Soil Type PM FFM Control Harvest Figure 7: Available total inorganic nitrogen, phosphorous, potassium and sulphur from PRS™ probes buried at 5, 15 and 35 cm depths. F:B S:M SDI Axis 1 (5.4 %) Axis2(76.2%) TRTxDept 105 115 135 705 715 735 1235 1305 1315 1335 Figure 8: NMS ordination of PLFAs at 5, 15, and 35 cm depth in Shallow (A) and Deep (B) topsoil application rates (final stress = 5.2 % (A), 3.3 % (B); vector r2 > 0.40 for bacteria (B), fungi (F), fungi:bacteria ratio (F:B), saturated:monounsaturated PLFAs (S:M), and PLFA Shannon Diversity Index (SDI)). MB-C F B S:M SDI Axis 1 (6.8 %) Axis2(84.5%) TRTxDept 205 215 235 305 315 335 1235 1305 1315 1335 A B PLFA: Shallow Application PLFA: Deep Application Shallow placements of FFM appeared to alter underlying microbial community structure away from SS while PM did not. Deep FFM was most similar to Harvest PLFAs (MRPP P = 0.1991), which were associated with greater F:B and greater PLFA diversity (Figure 8). Forest floor litter layers have yet to develop and will eventually contribute a large proportion of the total microbial community structure in the soil profile. Similar to other measured parameters, microbial function was comparable between FFM and Harvest in the 0 – 10 cm sampling interval (Figure 9.A; P = 0.1542). Shallow PM and FFM samples from 10 – 20 cm exhibited no difference and were more similar to Harvest (P = 0.0597) than Deep applications (P = 0.0029). These results indicate that Deep applications may be redundant for initiating soil function on this site. Depth ● 5 cm ▲ 15 cm ■ 35 cm SSIR Carbohydrates Amino Acids Carboxylic Acids Water Axis 1 (13.1 %) Axis2(77.7%) Soil Type PM FFM Control Harvest Figure 9: NMS of CLPPs from 0 – 10 cm (A) and 10 – 20 cm (B) sample intervals (final stress = 7.6 % (A), 4.3 % (B); vector r2 > 0.40 for carbohydrates, amino acids carboxylic acids, water and the sum of substrate induced respiration (SSIR)). A B CLPP: 0 – 10 CLPP: 10 – 20 cm SSIR Carbohydrates Amino Acids Carboxylic Acids Water Axis 1 (13.1 %) Axis2(77.7%) Soil Type PM FFM Control Harvest