Computing net radiation from temperature variables: Improvising for under-res...
Atmospheric Environment 38 Thesis
1. Atmospheric Environment 38 (2004) 6139-6147
Surface ozone over southern Africa: Synthesis of monitoring results during the Cross border Air
Pollution Impact Assessment project
M. Zunckela,C3, K. Venjonokab, J.J. Pienaarc, E-G. Brunked, O. Pretoriuse, A. Koosialeea, A.
Raghunandana, A.M. van Tienhovena aCSIR Environmentek, Durban, P.O. Box 17001, Congella
4051, South Africa bDepartment of Environment, Gabarone, Botswana cSchool of Chemistry and
Biochemistry, North-West University (Potchefstroom Campus), Potchefstroom, South Africa
dSouth African Weather Service, Stellenbosch, South Africa eSasol Synfuels, Secunda, South
Africa
Received 6 April 2004; received in revised form 7 July 2004; accepted 15 July 2004
Abstract
Measurements of surface ozone in the southern African region are limited to a few active and
passive monitoring sites. Over the region, the mean surface ozone concentrations exhibit strong
seasonal and diurnal variations. The seasonal maximum generally occurs in the spring months
from August to November and the minimum occurs in December and January. With the exception
of Cape Point, a strong diurnal variation is observed at all sites. Ozone concentrations increase
from a minimum near sunrise to a maximum in the afternoon, then decrease again to the early
morning minimum. The highest ozone concentrations occur over Botswana and the Mpumalanga
Highveld. In both regions the springtime maximum is between 40 and 60 ppb, but reached more
than 90 ppb as a mean in October 2000. In these two regions the monthly minimum is between
20 and 30 ppb. The mean daytime ozone concentrations in Botswana and on the Highveld reach
40 ppb as early as 10:00 and remain above this level for up to 10 h. At the background stations
at Cape Point, in Namibia and areas adjacent to the Highveld the maximum concentrations are
between 20 and 30 ppb with minimums between 10 and 20 ppb. In the Cross border Air Pollution
Impact Assessment project, CAPIA, a threshold value of 40 ppb is used to assess the potential
risk of damage to maize by ozone. Measured data show that this threshold is exceeded over
Botswana and on the South African Highveld. 2004 Elsevier Ltd. All rights reserved.
Keywords: Ozone; Botswana; South Africa; Zimbabwe; Zambia; CAPIA; Cape Point
1. Introduction
Ozone in the lower troposphere forms through the reaction between oxides of nitrogen (NOx)
and volatile organic compounds (VOC) in sunlight. High ozone concentrations near the earth’s
surface are associated with negative health impacts (Lippman, 1989), and can result in damage
to vegetation (Emberson et al., 2001), and be harmful to materials (Lee et al., 1996; Massey,
1999). In southern Africa anthropogenic sources of NOx occur throughout the region (Fleming and
van der Merwe,2002) and also result from soil emission(Levine et al., 1996). VOC emissions occur
throughout the region from vegetation (Greenberget al., 2003; Harleyet al., 2003), and from
anthropogenic activities (Fleming and van der Merwe, 2002). Biomass burning is also a major
source of trace gases and particulates (Scholes et al., 1996; Helas and Pienaar, 1996). The region
lies in sub-tropical and temperate latitudes with high levels of sunshine, suggesting ozone may
readily form in the presence of the precursor gases.
Some studies have provided information on ozone concentrations in the lower troposphere, but
very little information is available on ground level ozone concentrations over southern Africa.
Using balloon-borne ozonesonde during the SAFARI-92 campaign, Thompson et al. (1996) and Diab
et al. (1996) reported ozone concentrations to increase with height from approximately 20 ppb
near the surface to 50 ppb or more at 700 m AGL at Pretoria (South Africa) and Etosha National
Park (Namibia). Meixner and Helas (1994) found a similar pattern at the Victoria Falls (Zimbabwe)
during SAFARI-92. Airborne measurements during SAFARI-94 showed ozone concentrations to
increase from 30 ppb near the surface to 50 ppb at a height of 3 km over the Alexander Bay on
the Namibian coast (Helas et al., 1995).
2. Lacaux et al. (1993) reported surface ozone concentrations between 30 and 40 ppb in central
Africa during 1983 and 1988. Combrink et al. (1995) showed surface ozone concentrations to
range between 25 and 50 ppb at two stations in South Africa. During the period 1991/1993 a
network of ozone monitoring stations was in operation in the eastern highlands of Zimbabwe
(Jonnalagadda et al., 2001). At these sites, the mean annual surface ozone concentrations ranged
between 37 and 49 ppb, with a mean standard deviation of about 11 ppb. In addition to these
studies, there are a few on-going ozone-monitoring initiatives in southern Africa.
These include monitoring by local metropolitan councils in urban areas, measurements in rural
and industrial environments and at so-called background stations. This paper focuses on surface
ozone monitoring outside urban areas during the period 1999/2001. The intention is to describe
surface ozone characteristics in the southern African region during a period that coincides with
the Cross border Air Pollution Impact Assessment project (CAPIA, 2002).
2. Monitoring sites and measurement type
During 1999/2001 surface ozone monitoring was conducted in four countries in southern Africa,
namely Botswana, Namibia and South Africa, using both continuous and passive sampling
techniques. The monitoring stations are listed in Table 1 together with explanatory notes on the
sampling technique, the instrumentation and the monitoring period. The relative position of
these sites is illustrated in Fig. 1.
Surface ozone measurements have been made at South Africa’s Cape Point Global Atmosphere
Watch (GAW) station since 1983 (Scheel et al., 1994; Combrink et al., 1995; Brunke and Scheel,
1998; Oltmans et al., 1998). Monitoring is done with a TEI 49 UV O3 instrument, which analyses
the air drawn in through a 4 m high glass tube ventilated by means of a high-volume fan. The
data are recorded as 1-min averages, which in turn are compiled to yield half-hourly, daily and
monthly averages. An external zero test as well as a span check are performed once every day.
The calibration of the instrument is tied to the GAW ozone reference scale through three audits,
involving O3 inter-comparisons, which were performed by the GAW O3 calibration centre (EMPA,
http://www.empa.ch/gaw) since 1995. Cape Point surface ozone data have been submitted to
the World Data Centre for Greenhouse Gases (WDCGG) in Tokyo on an annual basis.
ARTICLE IN PRESS
Table 1
Surface ozone-monitoring sites in southern Africa
Country Site Sampling type Latitude (S)/Longitude (E)
Botswana Maun Continuous 191 580 231 240
Namibia Etosha Passive 191 090 151 490
South Africa Bosjesspruit Continuous 261 320 291 140
Cape Point Continuous & Passive 341 210 181 290
Amersfoort Continuous & Passive 271 000 291 510
Elandsfontein Passive 261 100 281 110
Ben MacDhui Passive 301 380 271 570
Palmer Passive 251 310 301 030
Louis Trichardt Passive 231 030 291 540
Skukuza Passive 241 590 311 350
M. Zunckel et al. / Atmospheric Environment 38 (2004) 6139?6147
On South Africa’s industrialised Mpumalanga Highveld, surface ozone is monitored at three
stations. A number of coal-fired power stations, foundries and a large petrochemical industry are
located on the Highveld. Bosjesspruit (Fig. 1) is located approximately 5 km from the Secunda
industrial complex and Amersfoort is approximately 90 km to the southeast of Secunda and is
located near the eastern escarpment, on the edge of the Highveld. Continuous monitoring is
undertaken at Bojesspruit with a Monitor Labs 9810 analyser and at Amersfoort with an API 400A
3. analyser, both using UV adsorption. Zero and span tests are done every 2 weeks and a full dynamic
gas calibration is performed every 3 months by the National Metrology Laboratory.
In Botswana, surface ozone has been monitored at Maun (Fig. 1) since July 1999. Maun is a small
town of approximately 44 000 inhabitants in a largely rural environment near the Okavango
Swamps. North-Easterly winds prevail approximately 70% of the time. The ozone monitor is
located upwind of Maun in order to measure ozone concentrations that are not strongly
influenced by urban activities. The area is well vegetated with mopani and acacia trees in thick
grassy savanna.
At Maun ozone is monitored on a continuous basis with a Horiba APOA 360 analyser, using UV
absorption. The continuous measurements are used to calculate hourly averages. Routine zero,
span, step and diurnal calibration tests are performed and the instrument is calibrated every
three months. From when monitoring commenced to the end of 2001 the data recovery varied
from more than 90% in eight months, to zero data return in other months.
Five air quality stations are operated within the DEBITS (Deposition of Bio-geochemically
Important Trace Species) program of IGAC (International Global Atmospheric Chemistry) in
southern Africa where monthly average background concentrations of key pollutants are
monitored, including ozone. These sites are remote and are removed from any direct
anthropogenic influences. Monitoring is conducted at Etosha National Park in Namibia, and in
South Africa at Cape Point, at the high-altitude site on Ben McDhui, at Elandsfontein, Amersfoort
and Palmer on the Mpumalanga Highveld and near the South African border with Zimbabwe at
Louis Trichardt (Fig. 1).
Monitoring at the DEBITS sites is done by means of passive samplers that are tested extensively
within DEBITS and WMO programmes (Dhammapala, 1996; Carmichael, 1997; Carmichael et al.,
2003). Passive samplers are based on chemical and physical processes. The rate at which gaseous
pollutants in ambient air diffuse into the sampler is controlled by the diffusion coefficients of
the respective gases. In theory, inside the sampler the gases impinge on a paper disk that has
been impregnated with a chemical that reacts very specifically with the gas of interest and so
quantitatively traps the pollutant. The Atmospheric Chemistry Research Group (ACRG) at the
North-West University (Potchefstroom Campus) does the sampler analysis and results are
submitted routinely to DEBITS.
3. Results
3.1. Botswana
Monthly average ozone concentrations at Maun for 1999 to 2001 show a marked seasonal variation
with maximum concentrations occurring from spring to early summer, August to November, in
all years (Fig. 2).
During this period the average ozone concentration generally exceeds 40 ppb. In other months
the average concentration is somewhat lower. The observed spring time ozone maximum
(August/October) does not coincide with the observer seasonal cycle in biomass burning in
southern Africa being most active between May and September, peaking in July. Silva et al.
(2003) report a total burned area of about 340 000 km2 in southern Africa in July 2000, decreasing
to less than 150 000 km2 in September and to about 40 000 km2 in October. In the Maun area
alone more than 3.6 million ha of savanna burnt in the period between 1999 and 2001. Rather,
the observed ozone maximum coincides with the onset of summer rains and the associated spring
growth in vegetation and nitrogen emissions from soil wetting.
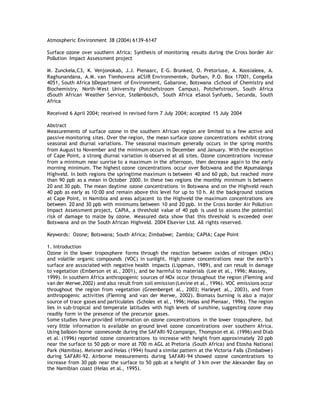
The diurnal variation is also pronounced at Maun (Fig. 2). Here the mean of the hourly average
concentrations for July 1999 to October 2001 show the concentration to increase from about 30
ppb before Fig. 1. The southern African region, indication the relative position of the ozone
passive and continuous monitoring sites. There after the concentration decreases rapidly to
sunset at about 19:00, it is followed by a more gradual decrease to the minimum at sunrise. The
average concentration is above 40 ppb for about 11 h.
4. 3.2. Namibia
The monthly surface ozone concentrations at Etosha during the period June 2000-May 2002 range
between a maximum of 30 ppb in October 2000 and August 2001 to a minimum of about 11 ppb
in March 2001, and in the summer months from October 2001 to January 2002 (Fig. 3). The mean
concentration during this period is 17 ppb. Similar to Maun, a seasonal variation is evident with
the maximum occurring in the spring and the minimum during the summer. During the SAFARI-
92 campaign, Thompson et al. (1996) and Diab et al. (1996) reported surface ozone
concentrations of approximately 20 ppb using ozonesondes, increasing with height to 50 ppb or
more at about 3000 m AGL.
3.3. South Africa
Trace gas data collected at Cape Point are primarily of maritime origin due to the dominance of
winds from the SE-W quadrant, which affect air from the S-W Atlantic region to the measuring
site. At times northerly air also reaches Cape Point with a continental and often anthropogenic
influence from the City of Cape Town.
Such pollution events tend to enhance O3 levels at Cape Point during the summer months due to
photochemical production, whilst suppressing O3 concentrations in winter in response to ozone
titration by nitrogen oxides (Brunke and Scheel, 1998). When long-term trends and seasonality
under baseline conditions are determined, only data that have passed statistical filtering criteria
are used. This applies to surface ozone as well as to the other trace gases measured at Cape
Point.
Since the 1990s, the Cape Point O3 data have shown a small but steady increase of 0.4 ppbyrC01
(Labuschagne et al., 2001). The minimum ozone concentration for the 3 years at Cape Point
(range: 14-17ppb) occurs during January/February and the maximum (range:31?32ppb) during
July-September, constituting peak-to-peak values, which vary between 14 and 18 ppb O3 (Fig.
4). In 2000, the minimum value occurred in February and not in January due to O3 production
brought about by unusual bush fires, which occurred in the Western Cape.
Overall, the seasonal cycle is fairly repetitive from year to year and typical for the background
Southern Hemispheric marine troposphere. Summer and winter months are characterized by
different O3 levels as well as varying degrees of data variability.
The composite diurnal cycles (1999-2001) depict the data as well as two background data sets
based on a percentile (PF) filtering technique and a 222Rn selection criterion (Fig. 4). The latter
technique, which is marginally stricter than the PF method, selects O3 data on the basis of
222Rno150 mBqmC03 thereby providing an even higher degree of maritime data.
The all data set gives rise to a diurnal cycle showing minima between 06:00 and 08:00 and maxima
at about 15:00 with an average peak-to-peak value of 4 ppb. It is suggested that this cycle to
some extent reflects anthropogenic processes from the greater Cape Town area involving oxides
of nitrogen, which lead to photochemical O3 production during the day and O3 titration at night.
Moreover, ozone loss due to dry deposition might also play a role. In contrast, both the PF data
as well as the 222Rn filtered data, which essentially exclude continental/urban influences, give
rise to a much smaller diurnal cycle (amplitudeo1 ppbO3) maximizing between 12:00 and 15:00.
This is in accordance with a low NOx environment.
Results obtained from passive samples collected at Cape Point do not discriminate between
background and polluted episodes and hence reflect all data. For the period June 2000-May 2002
these samples have shown O3 levels ranging between 33 ppb (June 2000) to 12 ppb (December
2000) (Fig. 3). As with the active sampling, the peak values occur in the winter between May and
July and the minimum values occur in mid- summer, December and January. The average ozone
concentration provided by the passive sampling for the period is 24 ppb in fair agreement with
the in situ measurements.
Marked seasonal and diurnal ozone variations are also evident over the Mpumalanga Highveld.
The spring Fig. 2. Mean monthly ozone concentration in ppb at Maun for 1999-2001 (top) where
crosses indicate missing data and mean hourly concentrations in ppb in 1999-2001 (bottom).
M. Zunckel et al. / Atmospheric Environment 38 (2004) 6139-6147 and early summer maximum
between August and October is observed at Bosjesspruit and at Amersfoort. As with Maun, this
may be partly due to the regional scale trend in biomass burning. It may also be attributed to
5. the region scale meteorology. The dominant winter anticyclone is responsible for pronounced
thermally stable layers in the lower troposphere where accumulation and recirculation occur.
The diurnal variation at these two stations is similar to that observed at Maun, increasing from a
minimum near sunrise to maximum values in the early afternoon, and then decreasing steadily
(Fig. 5). The mean hourly concentrations exceed 40 ppb at Amersfoort for approximately 7 h
from about 10:00 until 17:00. The mean hourly ozone concentrations at Bosjesspruit approach
this threshold in the middle of the day. Ozone concentrations are consistently higher at
Amersfoort than at Bosjesspruit. With dominant north-westerly winds both sites are downwind
Fig. 3. Mean monthly ozone concentrations in ppb at the DEBITS sites for June 2000-May 2002 for
the South African highveld (top) and the background sites (bottom).
M. Zunckel et al. / Atmospheric Environment 38 (2004) 6139-6147 6143 of the precursor source
area. Ozone has not had time to form at the closer located Bosjesspruit station compared with
Amersfoort some 50 km further downwind.
The passive sampling programme at Amersfoort has not been as continuous as elsewhere with
some data missing during the period June 2000-May 2002. Nevertheless, the springtime maximum
shown by the active sampling in Fig. 5 is clearly seen in the passivedata in the spring (September
2002) and early summer (November 2002) with lower concentrations during the rest of the year
(Fig. 3). Due to the gaps in the passive data it is not meaningful to compare these with the active
sampler as was done for Cape Point. At Palmer the spring time maximum is also clearly evident,
reaching monthly average concentrations of more than 30 ppb in 2001 and more than 40 ppb in
2002. The highest ozone monthly average concentrations do not occur at Elandsfontein which is
located closest to the industrial activity, but at Palmer which is located some 100 km from the
main source region. The mean monthly ozone concentration near the source area at both
Elandsfontein and Amersfoort is 25 ppb compared with the mean concentration of 29 ppb for the
passive sampling period at Palmer. Skukuza is located below the escarpment and away from the
direct influence of industrial sources. Here the annual average concentration is 25 ppb and the
monthly average concentrations compare with the other background stations (Fig. 3). Biomass
burning also influences the observed seasonal cycle at Skukuza. The seasonal trend in ozone
concentration of a maximum in spring that is observed at all stations in southern Africa other
than Cape Point is also evident in the spring of 2000 and 2001 at Louis Trichardt, reaching mean
monthly concentrations of 30 and 26 ppb, respectively. The monthly maximumof 34 ppb,
however, occurs in May 2002 with the lowest values of about 14 ppb occurring in April and May
2002. At Ben MacDhui, the high-altitude station, ozone concentration ranges between 10 ppb in
January 2002 to more than 30 ppb in April and May 2002. These are similar to concentrations
measured at the other background sites, namely Etosha and Cape Point. The mean monthly ozone
concentrations from the passive samplers at Louis Trichardt and Ben MacDhui are 23 and 24 ppb,
respectively.
Dhammapala (1996) have compared mean monthly ozone concentrations measured with passive
samplers at Elandsfontein and Cape Point with active sampling at the two stations. At Cape Point
48 months of data were compared, while 24 months of data were used at Elandsfontein. At Cape
Point the mean monthly concentrations range between 12 and 33 ppb and passive and active
sampling correlated with a coefficient of 0.7.
At Elandsfontein the concentration range is greater, ranging from similar low concentrations to
maximum values that exceed 40 ppb. Here a correlation coefficient of 0.8 was observed. The
weaker correlation at Cape Point may be due to the fact that the inlets of the active and passive
samplers are not at the same height. Ozone is not collected directly by the passive sampler, but
rather by the overall oxidation potential which is proportional to the ozone concentration. An
empirical Fig.4. Monthly O3 statistics at Cape Point based on half- hourly averages for all data
from 1999-2001. The 25th and 75th
percentiles determine the box; the whiskers indicate the 5th
and 95th percentiles. Squares are the arithmetic mean and thecrosses the 1st and 99th
percentile. Bottom:Average diurnal variations (1999-2001) of O3 at Cape Point as calculated from
individual data points normalized to the respective daily mean and smoothed by 3-h moving
averages. The triangles represent the all data set, the solid circles the statistically filtered (PF)
data, and the diamonds the data filtered according to 222Rno150 mBqmC03.
6. Fig. 5. Mean hourly ozone concentration in ppb at Bosjesspruit for July to December 2000 for all
months in 2001 and at Amersfoort for August to December 2001.
The ratio can be ascribed to wall effects in the passive sampler that results in ozone losses inside
the sampler.
4. Discussion
The location of the various background monitoring sites in southern Africa allows a broad
classification of the monitoring sites. Cape Point is a background site that is primarily influenced
by maritime air masses and may therefore be classified as a background-maritime site. Etosha,
Ben MacDhui, Skukuza and possibly Louis Trichardt are also background sites, but are influenced
by air masses with continental origins. These may therefore be classified as background-
continental sites.
Maun is well removed from any direct anthropogenic sources, but is strongly influenced by
biomass burning.
The remainder of the sites are located on the industrialised South African Highveld.
Anthropogenic emissions of ozone precursors resulting from transportation, domestic fuel
burning, industry and mining occur throughout the southern African region. They are, however,
dominated by the industrial and mining activities on the South African Highveld and the Zambian
copper belt (Fleming and van der Merwe, 2002), where emission occurs on a continuous basis.
Greenberg et al. (2003) and Harley et al. (2003) showed that biogenic emissions of hydrocarbons
from southern African vegetation are significant sources of these important ozone precursors.
Most biogenic emissions are dependent on the solar cycle and the availability of moisture. As a
result, they vary with season and time of the day, being higher in summer than winter and higher
during the day than at night. Biogenic emissions also vary spatially and are typically higher in the
more moist tropics and subtropics than in temperate latitudes, and higher in the moist eastern
coastal areas than on the relatively dry interior plateau. In addition, biomass burning has been
shown by Levine et al. (1996) and Silva et al. (2002) to be a majorvsource of gases and aerosols
in the southern African atmosphere. Biomass burning is seasonal and occurs almost exclusively
during the winter and into spring, from July to September (Silva et al., 2002).
The synoptic scale meteorology of southern Africa is largely influenced by the semi-permanent
mid-latitude high-pressure systems. The circulation is anticyclonic and subsident. The
atmosphere is also characterised by a number of semi-permanent absolutely stable layers (Cosijn
and Tyson, 1996). Pollutants are commonly trapped between these layers where they accumulate
and may be transported great distances from the source, often recirculating over the source area
(Tyson et al., 1996; Garstang et al., 1996). This situation provides an ideal environment and the
time necessary for the formation of ozone.
Over southern Africa, the mean surface ozone concentrations exhibit strong seasonal and diurnal
variations. At all sites other than Cape Point the seasonal maximum occurs in the spring months
from August to October and sometimes extends into the early summer, due to biomass burning
at this time of the year. The minimum occurs in December and January. In contrast, maritime
air masses affected at Cape Point originate primarily from the SW Atlantic Ocean (NOAA CMDL
back trajectories) and as such do not reflect the influences of biomass burning from Central
Africa. The observed ozone seasonal cycle is therefore largely driven by the solar cycle within
this low NOx environment, giving rise to a winter maximum (July). In contrast, Etosha and
Skukuza may be regarded as background stations that are mostly influenced by air masses of
continental origin, or that have been modified by continental effects. As a result, the observed
ozone at these two sites may be influenced more strongly by biomass burning and the annual
maximum is shifted towards spring (September), coinciding with the ob- served peak in burning
(Silva et al., 2003). The highest hourly ozone concentrations occur over Botswana and the
Mpumalanga Highveld. In both regions the springtime maximum is between 40 and 60 ppb, but
reached more than 90 ppb as a mean in
October 2000. In these two regions, the monthly minimum is between 20 and 30 ppb. The mean
daytime ozone concentrations at Maun and on the Highveld reach 40 ppb as early as 10:00 and
remain above this level for up to 10 h. At the background stations of Cape Point, Etosha and
Louis Trichardt the maximum concentration is between 20 and 30 ppb and the minimums range
7. between 10 and 20 ppb. Jonnalagadda et al. (2001) reported surface ozone concentrations over
eastern Zimbabwe during the period 1991-1993 where they ranged between 37 and 49 ppb. From
the results of the current and earlier work an area of relatively high ozone concentrations
covering Botswana, Zimbabwe and the north-eastern parts of South Africa is suggested.
A clear diurnal variation is observed at all sites with continuous monitoring with concentration
increasing from a minimum near sunrise to a maximum in the afternoon, after which
concentrations decrease again to the early morning minimum. At Maun and the two sites on the
South African Highveld, Bosjesspruit and Amersfoort, the daily range is marked, reaching 20-30
ppb (Figs. 2 and 5). The daily range at Cape Point for maritime air is considerably smaller at less
than 1 ppb (Fig. 4). The observed diurnal variation in the surface ozone is primarily attributed
to the photo- chemical process and the diurnal variation in the solar ARTICLE IN PRESS
The atmospheric chemistry of tropospheric ozone formation is complex. It is initiated by the
photo-dissociation of NO2 by solar radiation to form oxygen atoms, and subsequent reactions of
these with hydrocarbons to form ozone in chain reactions (National Research Council, 1991).
5. Conclusion
Even though southern Africa is a region with numerous sources of ozone precursors and presents
ideal conditions for the formation of ozone, measurements of surface ozone are limited to a few
continuous monitoring and passive sampling monitoring sites.
Surface ozone concentrations exhibit strong seasonal and diurnal variations with the maximum
occurring in the months from August to November and the mini- mum in December and January.
A strong diurnal variation also occurs with surface ozone concentrations increasing from a
minimum near sunrise to a maximum in the afternoon, then decreasing again to the early morning
minimum. The highest ozone concentrations occur over Botswana and the Mpumalanga Highveld.
In both regions the hourly springtime maximum is between 40 and 60 ppb, but reached more
than 90 ppb as a mean in October 2000. In these two regions the mean monthly minimum is
between 20 and 30 ppb. The mean daytime ozone concentrations in Botswana and on the
Highveld reach 40 ppb as early as 10:00 and remain above this level for up to 10 h. At the
background stations at Cape Point, in Namibia and areas adjacent to the Highveld the maximum
hourly concentration is between 20 and 30 ppb with minimums between 10 and 20 ppb.
Acknowledgements
Funding from the Department of Arts, Culture, Science and technology Regional Science and
Technology Fund made the CAPIA project possible. Data were graciously supplied by the
Department of Environment in Botswana. Sasol are acknowledged for making the Bosjesspruit
data available. The NRF and Eskom TSI are gratefully acknowledged for their financial support
of the DEBITS passivesampler network in southern Africa. The Stockholm Environmental Institute
(York) and the Air Pollution Information Network-Africa (APINA) are acknowledged for their in-
kind support.
References
Brunke, E-G., Scheel, H.E., 1998. Surface ozone measurements at Cape Point (341S,
181E):In:Bojkov, R.D., Visconti, G. (Eds.),”Atmospheric Ozone”, Proceedings of the XVIII
Quadrennial Ozone Symposium, L’Aquila, Italy, 12-21 September 1996, pp. 331-334.
CAPIA, 2002. Cross border air pollution impact assessment, http://dbn.csir.co.za/capia/
Carmichael, G.R., 1997. Report on passive samplers for atmospheric chemistry measurements
and their role in GAW. WMO Report No. 122, 19pp.
Carmichael, G.R., Ferm, M.,Thongboonchoo, H., Woo,J.-H., et al., 2003. Measurements of sulfur
dioxide, ozone and ammonia concentrations in Asia, Africa, and South America using passive
samplers. Atmospheric Environment 37 (9-10), 1293-1308.
8. Combrink, J., Diab, R.D., Sokolic, F., Brunke, E.G., 1995. Relationships between surface free
tropospheric and total column ozone in two contrasting area in South Africa. Atmospheric
Environment 29, 685-691.
Cosijn, C., Tyson, P.D., 1996. Stable discontinuities in the atmosphere over southern Africa.
South African Journal of Science 92, 381-396.
Dhammapala, R., 1996. Use of diffusive samplers for the sampling of atmospheric pollutants.
M.Sc. Thesis. Potchefstroom University for CHE.
Diab, R.D., Thompson, A.M., Zunckel, M., Coetzee, G.J.R., Combrink, J., Bodeker, G.E.,
Fishman, J., Sokolic, F., McNamara, D.P., Archer, C.B., Nganga, D., 1996. Vertical ozone
distribution over southern Africa and adjacent oceans during SAFARI-92. Journal of Geophysical
Research 101 (D19), 23 823-23 833.
Emberson, L.D., Ashmore, M.R., Murray, F., Kuylenstierna, J.C.I., Percy, K.E., Izuta, T., Zheng,
H., Sheu, B.H., Liu, C.P., Agrawal, M., Wahid, A., Abdel-Latif, N.M., van Tienhoven, M., de
Bauer, L.I., Domingos, M., 2001. Impacts of air pollutants on vegetation in developing countries.
Water, Air and Soil Pollution 130, 107-118.
Fleming, G., van der Merwe, M., 2002. Spatial disaggregation of greenhouse gas emissions
inventory data for Africa south of the equator, http://gis.esri.com/library/userconf/proc00/
professional/papers/PAP896/p896.htm.
Garstang, M.,Tyson, P.D., Swap, R.J., Edwards, M.,Kallberg, P., Lindsay, J.A., 1996. Horizontal
and vertical transport of air over southern Africa. Journal of Geophysical Research 101, 23 721-
23 736.
Greenberg, J.P., Guenther, A., Harley, P., Otter, L., Veenendaal, E.M., Hewitt, C.N., James,
A.E., Owen, S.M., 2003. Eddy flux and leaf-level measurement of biogenic VOC emissions from
mopane woodland of Botswana. Journal of Geophysical Research 108 (D13), 8466.
Harley, P., Otter, L., Guenther, A., Greenberg, J., 2003. Micrometeorological and leaf-level
measurements of isoprene emissions from a southern African savanna. Journal of Geophysical
Research 108 (D13), 8468.
Helas, G., Pienaar, J.J., 1996. The influence of vegetation fires on the chemical composition of
the atmosphere. South African Journal of Science 92, 132-136.
Helas, G., Andreae, M.O., Schebeske, G., LeCanut, P., 1995. SAFARI-94:A preliminary review of
results. South African Journal of Science 91, 360/362.
Jonnalagadda, S.B., Bwila, J., Kosmos, W., 2001. Surface ozone concentrations in Eastern
Highlands of Zimbabwe. Atmospheric Environment 35, 4341-4346.
M. Zunckel et al. / Atmospheric Environment 38 (2004) 6139-6147
Labuschagne, C., Brunke, E-G., Scheel, H.E., 2001. Long-term observations of trace gases at
Cape Point. National Association for Clean Air Conference, Port Elizabeth, South Africa, 11-12
October 2001.
Lacaux, J.-P., Cachier, H., Delmas, R., 1993. Biomass burning in Africa:An overview of its impact
on atmospheric chemistry. In:Crutzen, P.J., Goldammer, J.G. (Eds.), Fire in the Environment:The
Ecological Atmospheric and Climatic Importance of Vegetation Fires. Wiley,New York, pp. 163-
191.
9. Lee, D.S., Holland,M.R.,Fella, N., 1996. The potential impact of ozone on materialsin the
UK.AtmosphericEnvironment 30 (7), 1053-1065.
Levine, J.S., Winstead, E.L., Parsons, D.A.B., Scholes, M.C., Scholes, R.J., Cofer III., W.R.,
Cahoon Jr., D.R., Sebacher, D.I., 1996. Biogenic soil emissions of nitric oxide (NO) and nitrous
oxide (N2O) from savannas in South Africa: the impact of wetting and burning. Journal of
Geophysical Research 101 (D19), 23 689-23 697.
Lippman, M., 1989. Health effects of ozone:a critical review. Journal of the Air and waste
Management Association 39, 672-695.
Massey, S.W., 1999. The effects of ozone and NOx on the deterioration of calcareous stone.
Science of the Total Environment 227 (2-3), 109-121.
Meixner, F.X., Helas, G., 1994. Meteorology, transport and boundary layer ozone at Victoria Falls
(Zimbabwe): Ground level and airborne observations, Proceedings of the AUG Fall Meeting 1994,
AUG, San Francisco, 147pp.
National Research Council, 1991. Rethinking the Ozone Problem in Urban and Regional Air
Pollution. National Academy Press, Washington DC, 500pp.
Oltmans, S.J., Lefohn, A.S., Scheel, H.E., Harris, J.M., Levy II., H., Galbally, I.E., Brunke, E-G.,
Meyer,C.P., Lathrop, J.A., Johnson, B.J., Shadwick, D.S., Cuevas, E., Schmidlin, F.J., Tarasick,
D.W., Claude, H., Kerr, J.B., Uchino, O., 1998. Trends of ozone in the troposphere. Geophysical
Research Letters 25 (2), 139-142.
Scheel, H.E., Sladkovic, R., Brunke, E-G., Seiler, W., 1994. Measurements of lower tropospheric
ozone at mid-latitudes of the Northern and Southern Hemisphere. In:Hudson, R.D. (Ed.), Ozone
in the Troposphere and Stratosphere, Part 1, Proceedings of the Quadrennial Ozone Symposium
1992, NASA Conference Publication, vol. 3266, pp. 11-14.
Scholes, R.J., Kendall, J., Justice, C.O., 1996. Emissions of trace gases and aerosol particles due
to vegetation burning in southern Africa. Journal of Geophysical Research 101 (D19), 23 677-
23 682.
Silva, J.M.N., Pereira, J.M.C., Cabral, A.I., Sa, A.C.L., Vasconcelos, M.J.P., Mota, B., Gregoire,
J.M., 2003. An estimate of area burned in southern Africa during the 2000 dry season using SPOT-
VETETATION satellite data. Journal of Geophysical Research 108 (D13), 8498.
Thompson, A.M., Diab, R.D., Bodeker, G.E., Zunckel, M., Coetzee, G.J.R., Archer, C.B.,
McNamara, D.P., Pickering, K.E., Combrink, J., Fishman, J., Nganga, D., 1996. Ozone over
southern Africa during SAFARI-92/TRACE A. Journal of Geophysical Research 101 (D19), 23 793-
23 807.
Tyson, P.D., Garstang, M.,Swap, R.J., Kallberg, P., Edwards, M., 1996. Air transport climatology
for subtropical south- ern Africa. International Journal of Climate 16, 265-291.