Download as PDF, PPTX


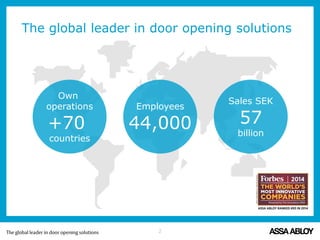
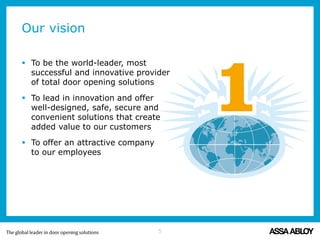

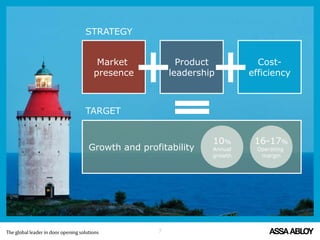

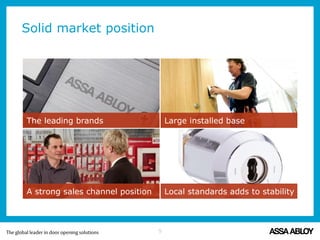
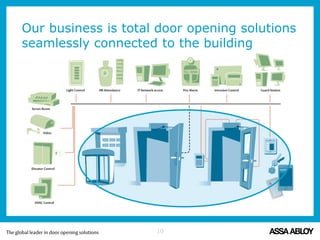
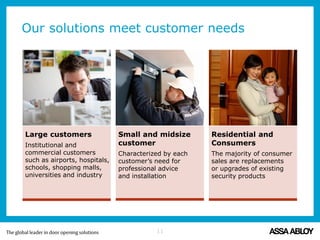


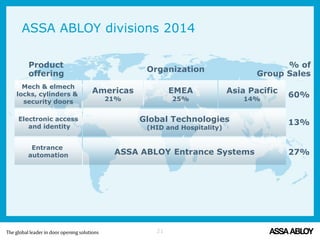
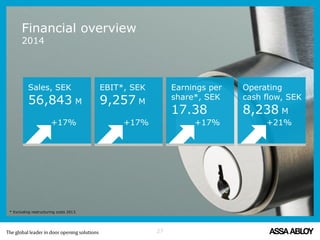
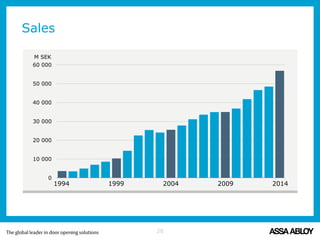
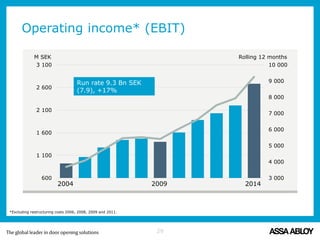


Assa Abloy is the global leader in door opening solutions, focused on security, safety, and convenience, with a significant presence in over 70 countries and sales reaching SEK 57 billion in 2014. The company emphasizes innovation, product leadership, and cost-efficiency as its main growth drivers, aiming to enhance customer value and expand into emerging markets. With a diverse range of brands and a commitment to continuous improvement, Assa Abloy targets a 10% annual growth rate and operates with a healthy operating margin of 16-17%.


![Report on Business Plan on UNISTORE, a Retail Superstore [Elegant (VII)]](https://cdn.slidesharecdn.com/ss_thumbnails/businessplanonunistoreelegantvii-130516133513-phpapp02-thumbnail.jpg?width=640&height=640&fit=bounds)


