The document summarizes Stanford University's experience transitioning from Excel to Oracle's Hyperion Planning software for budgeting. Key points:
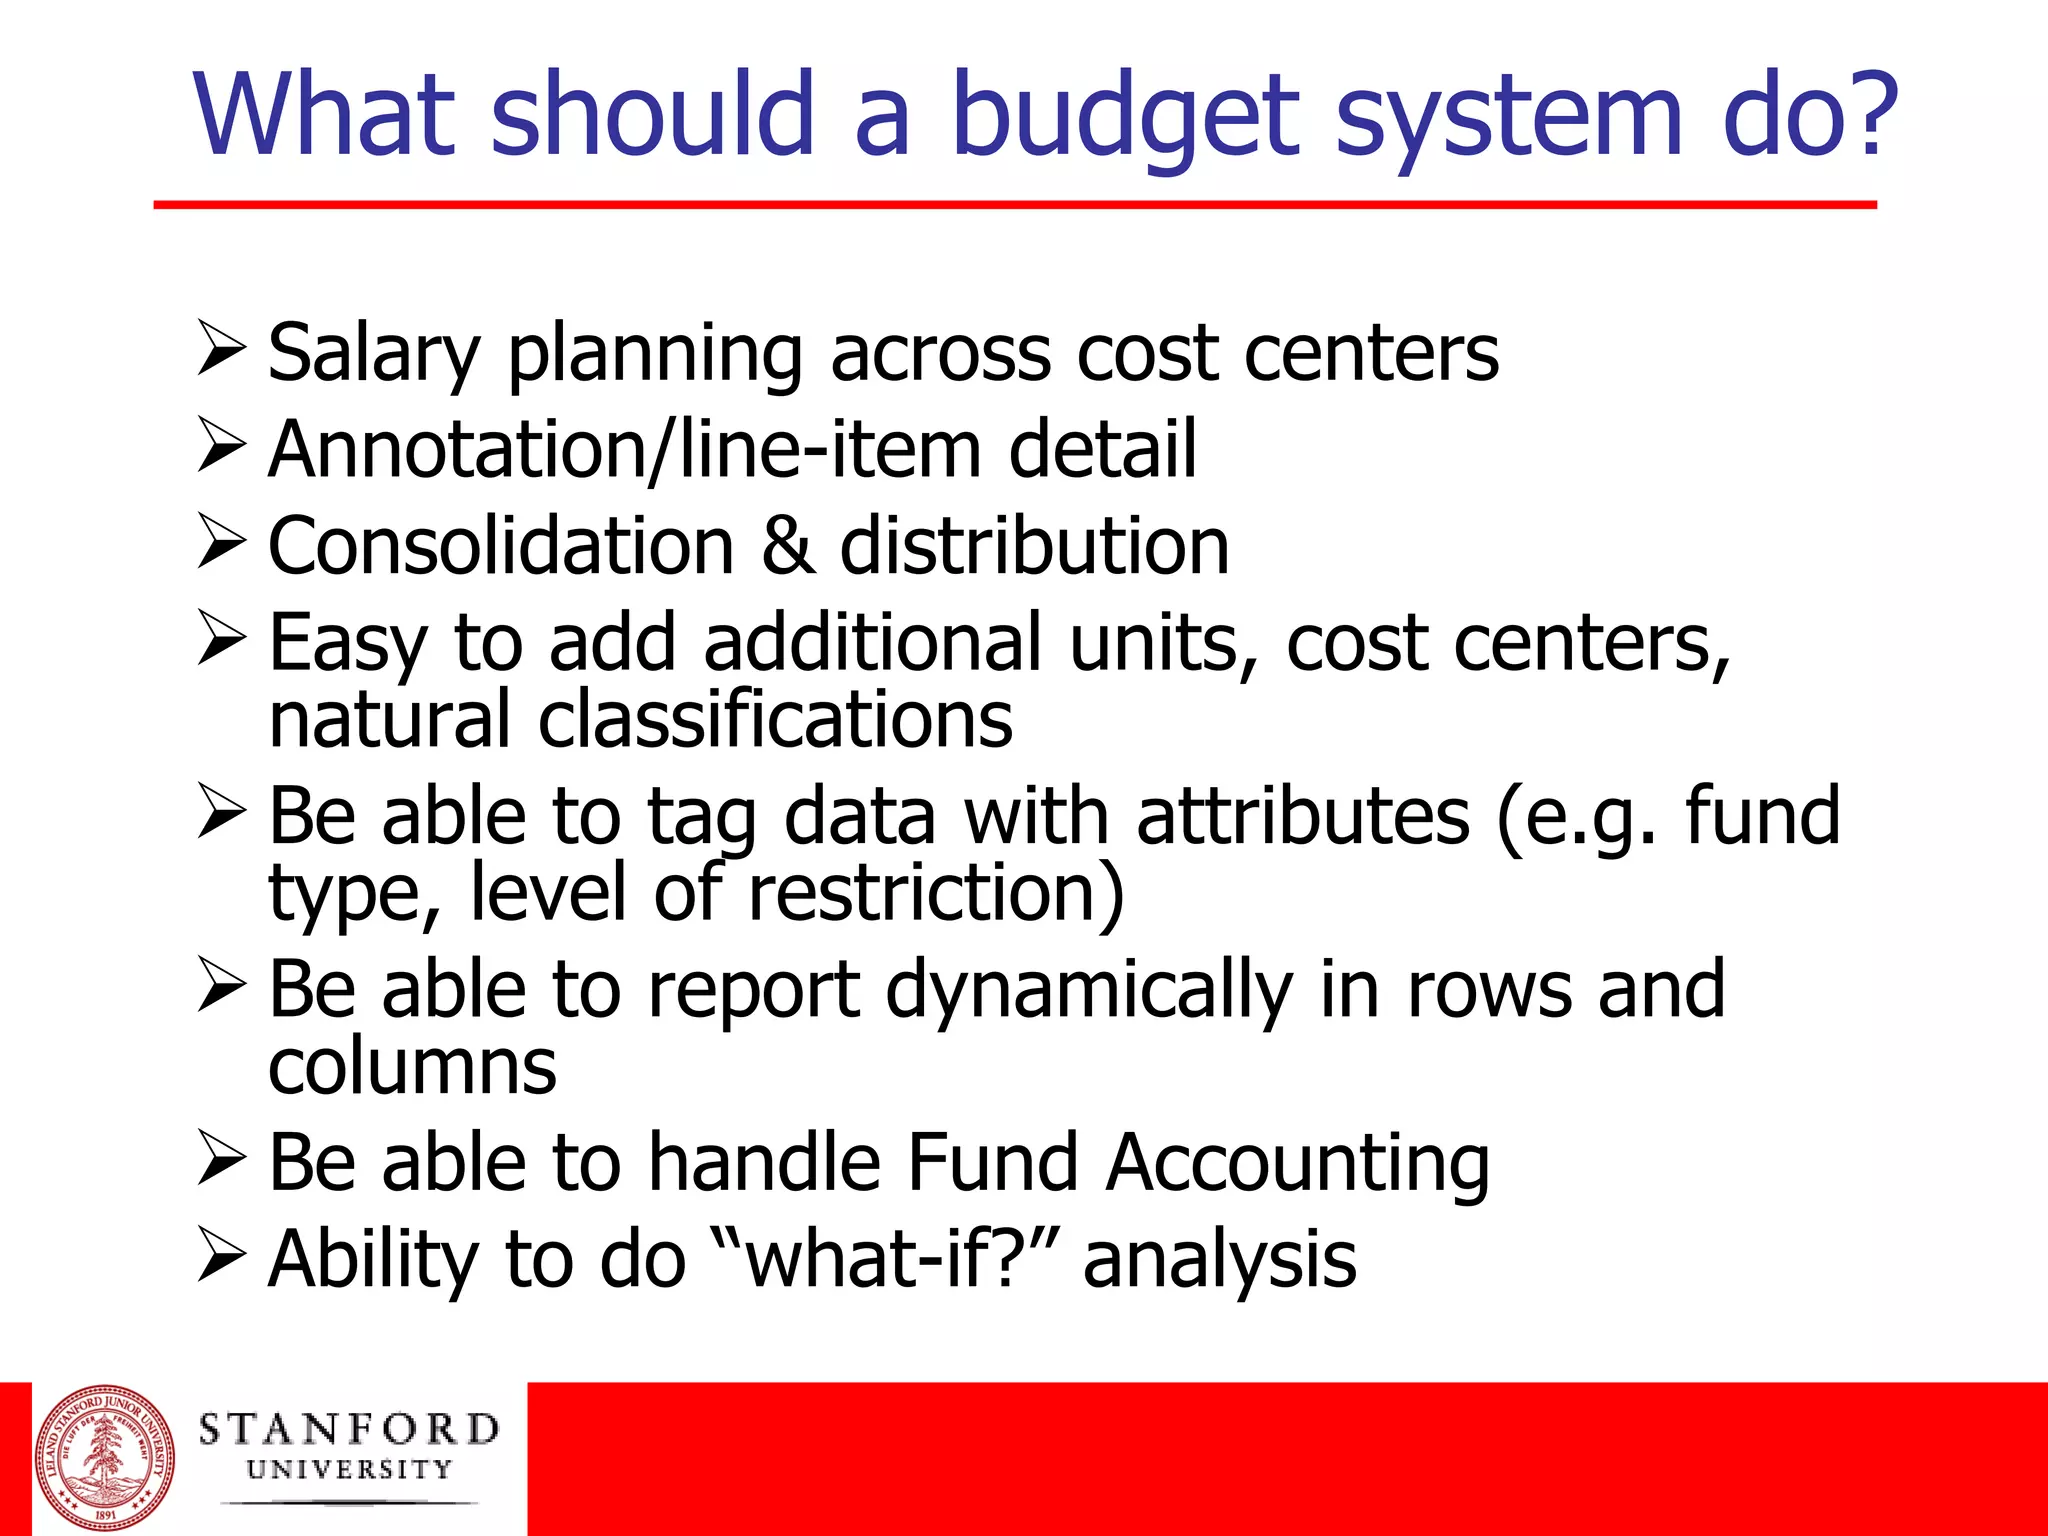
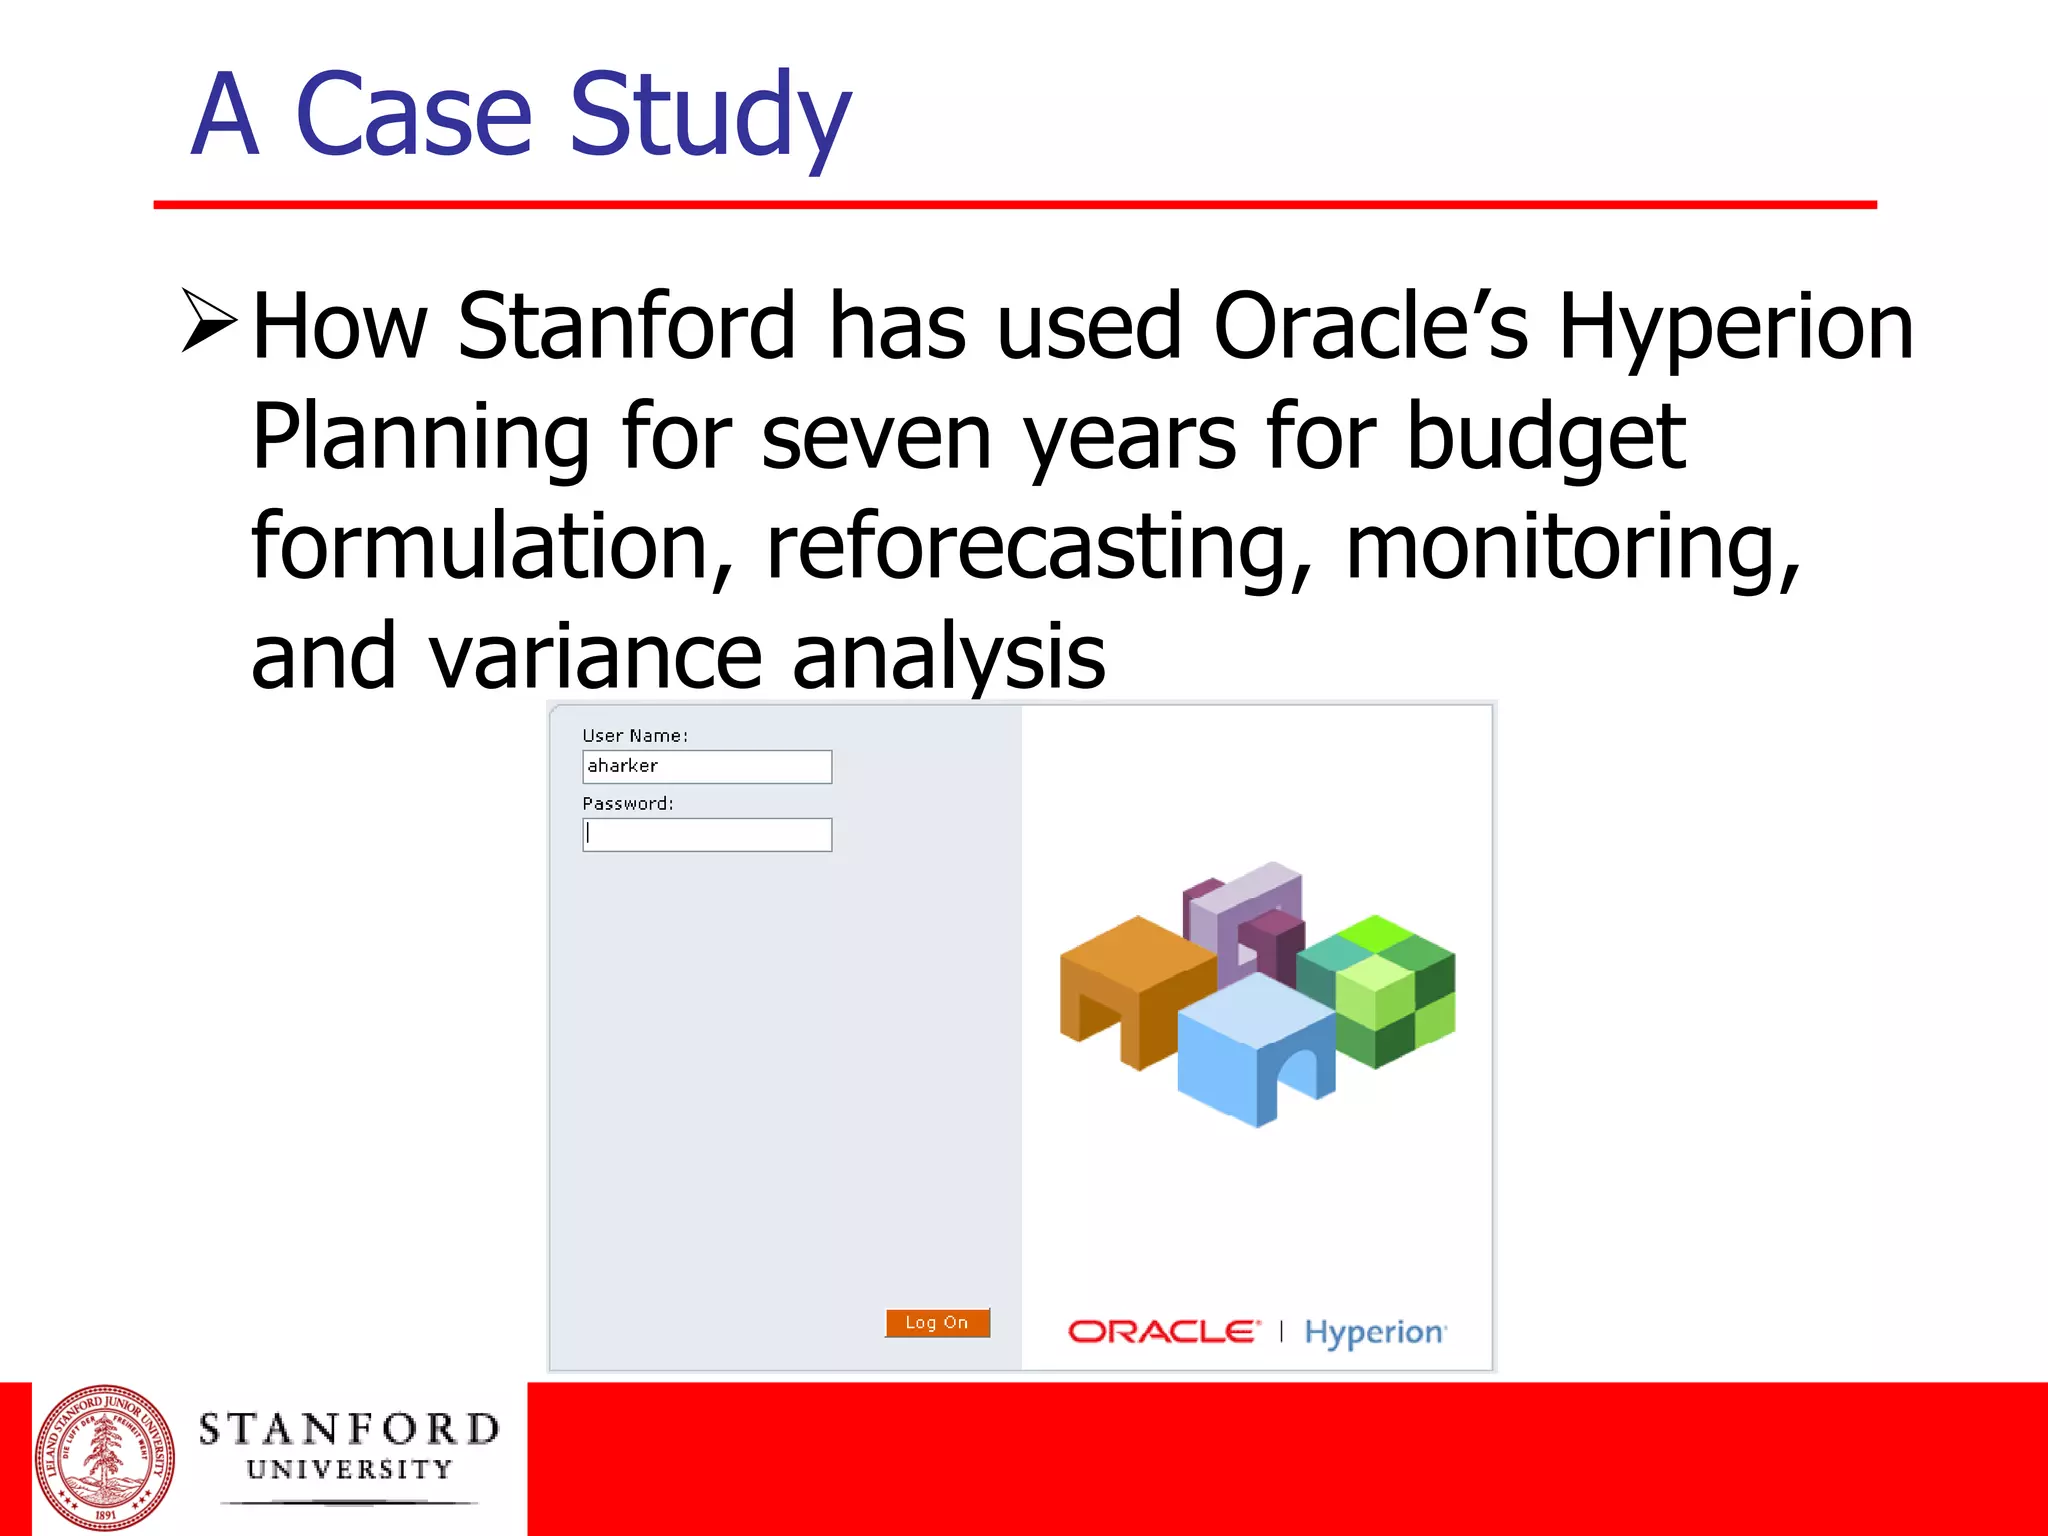
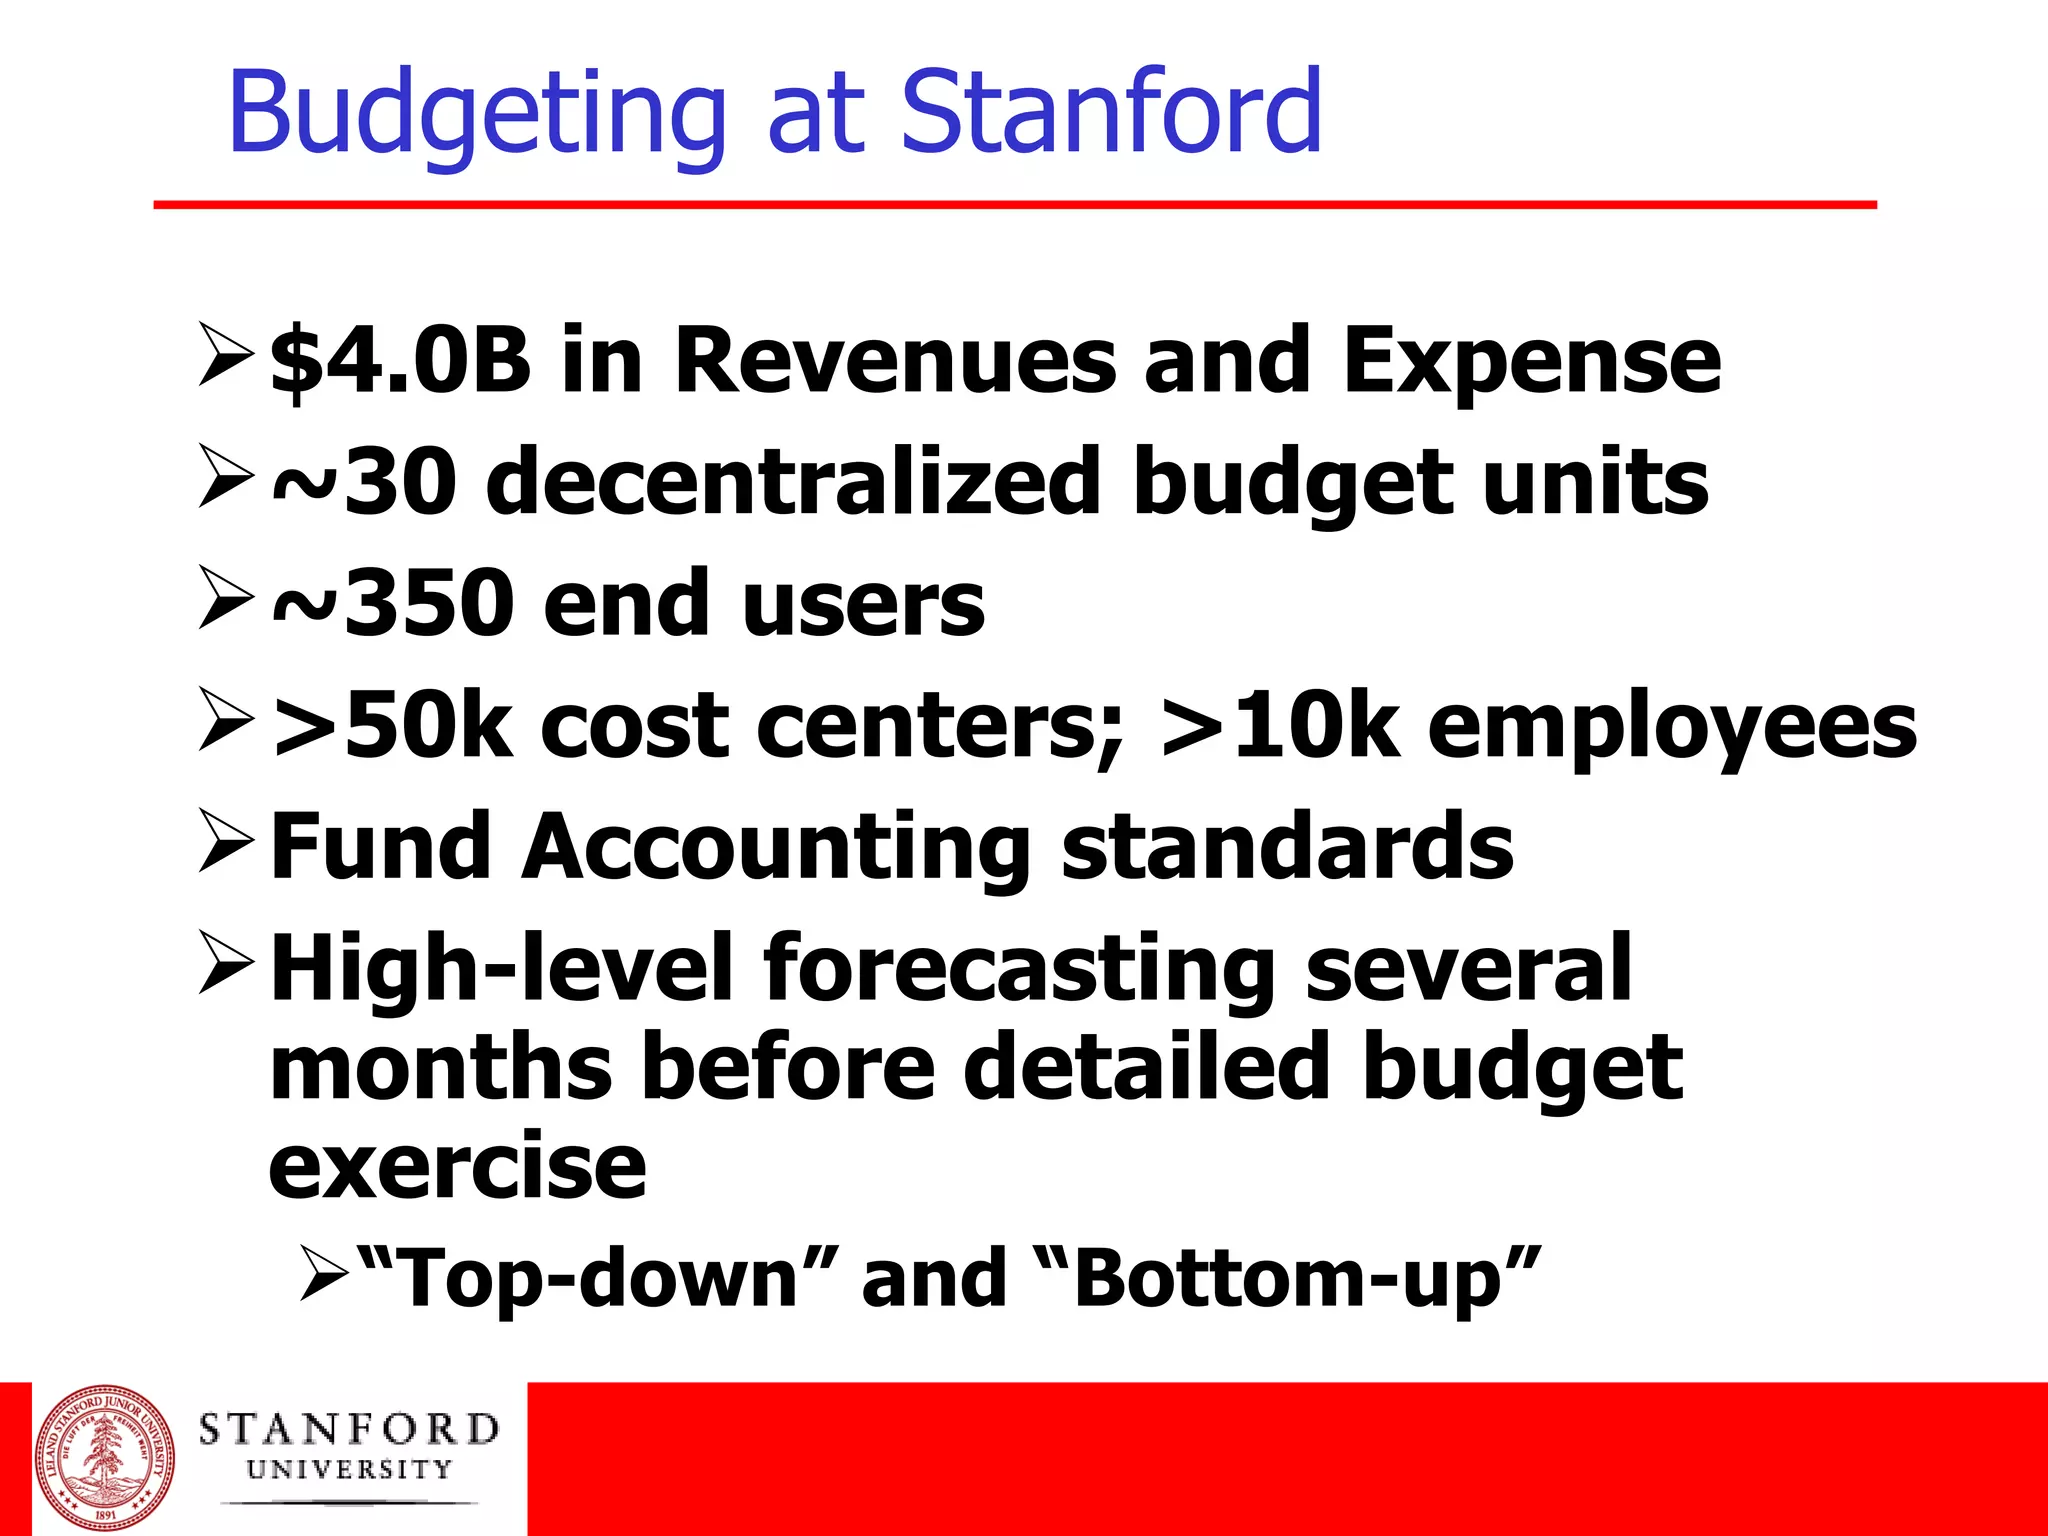
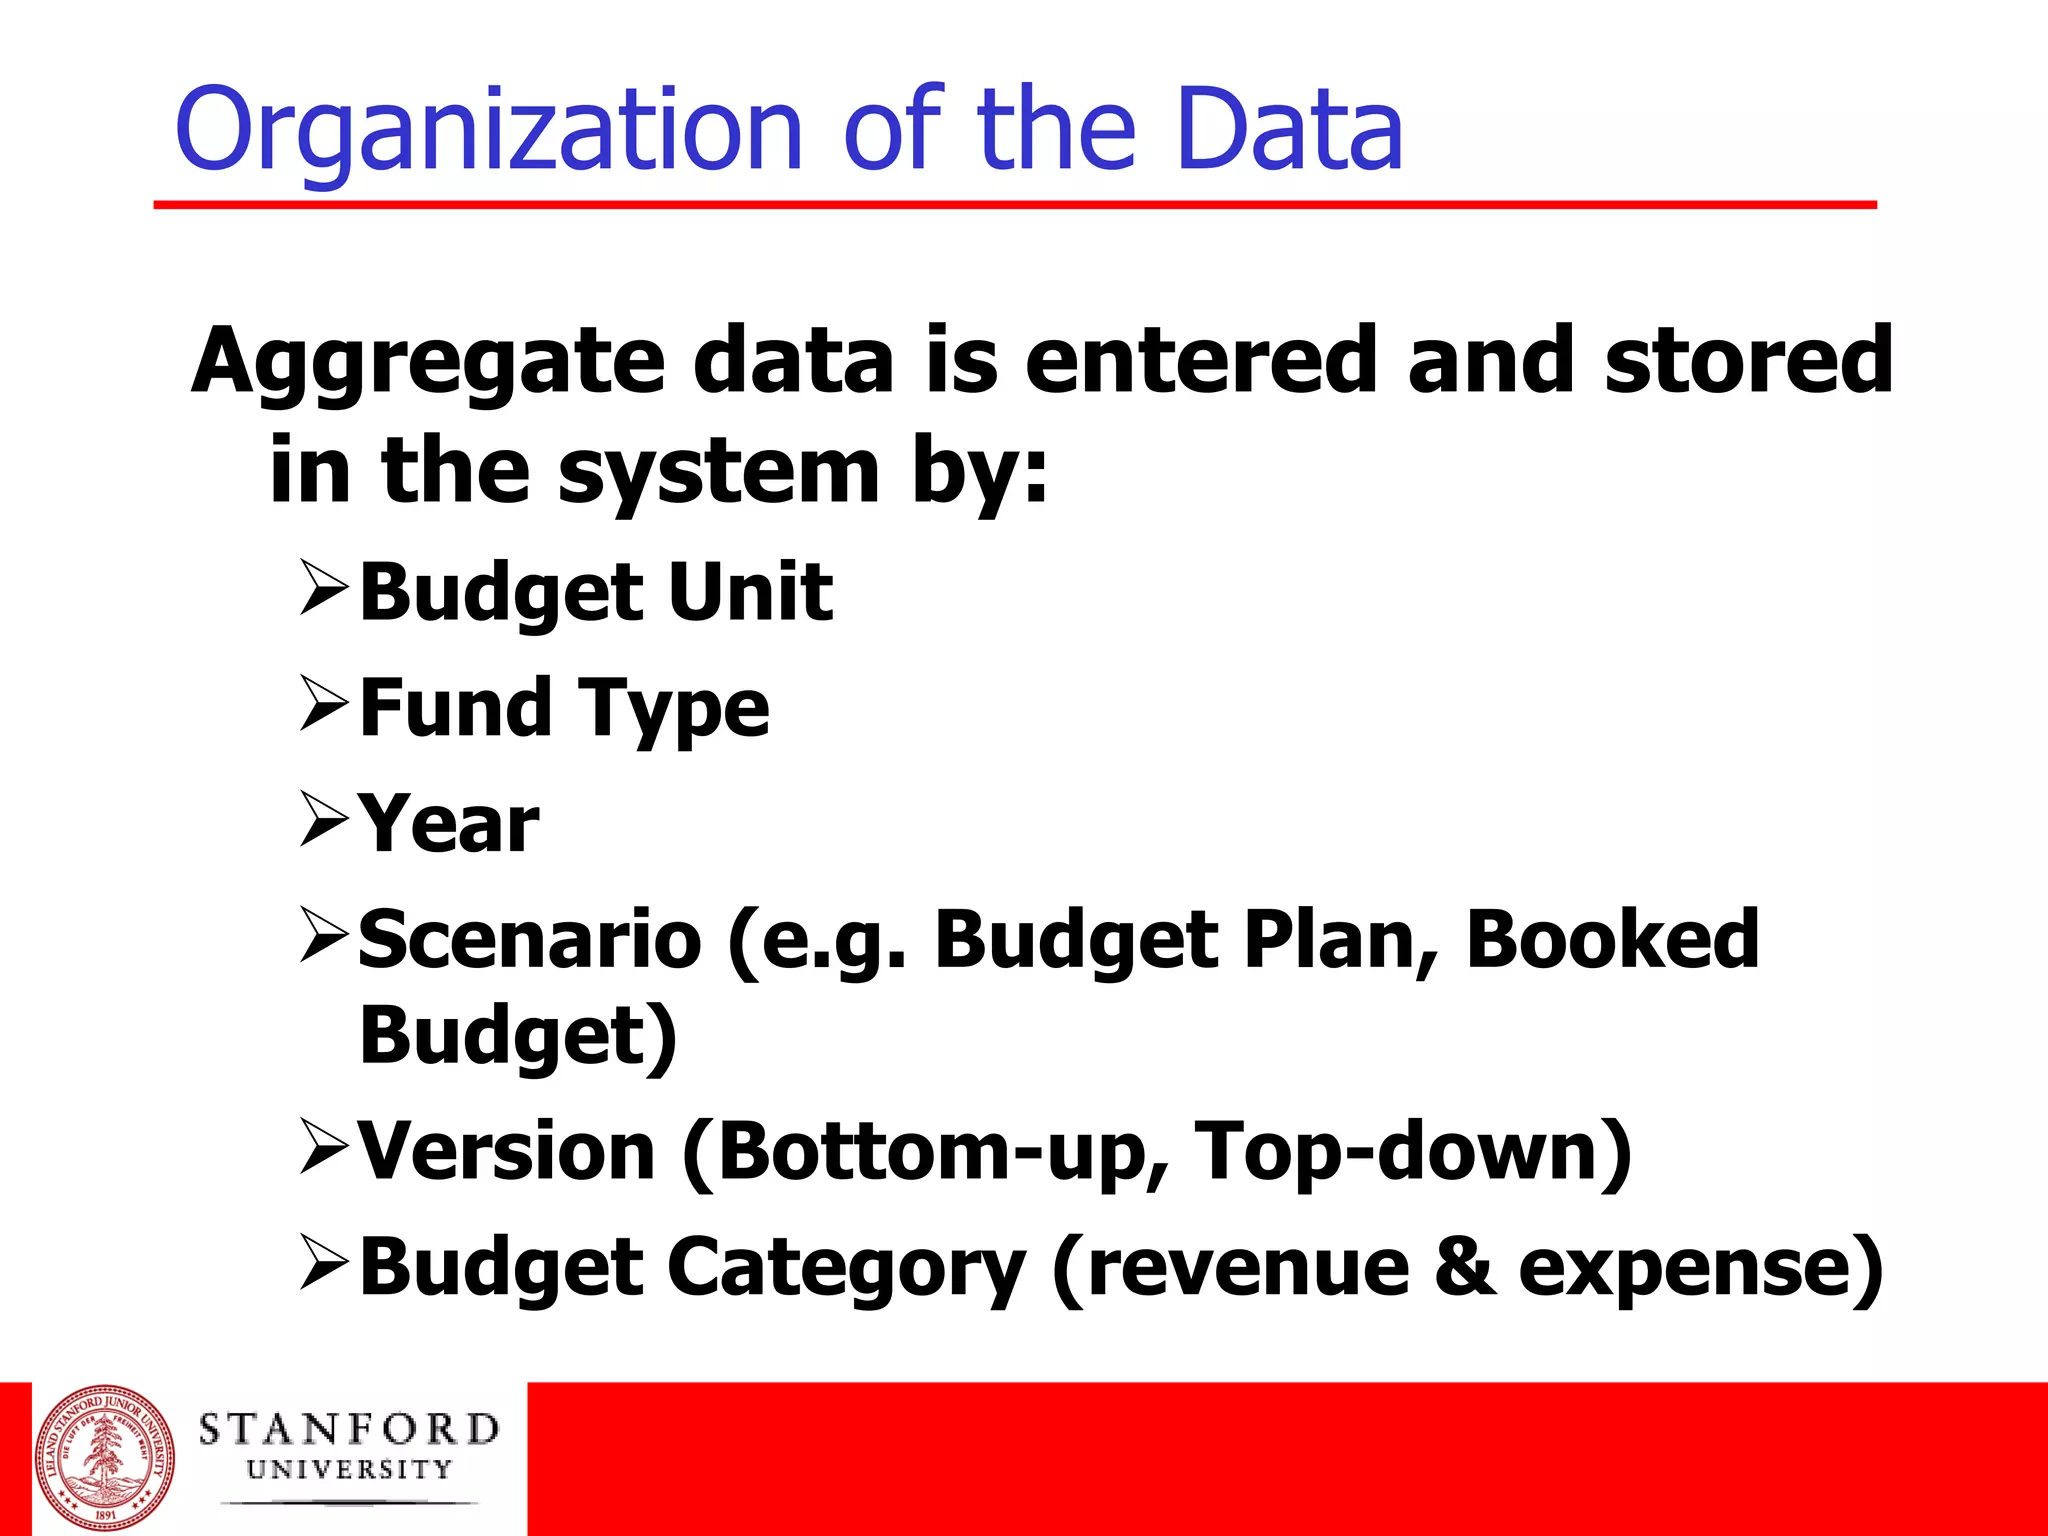
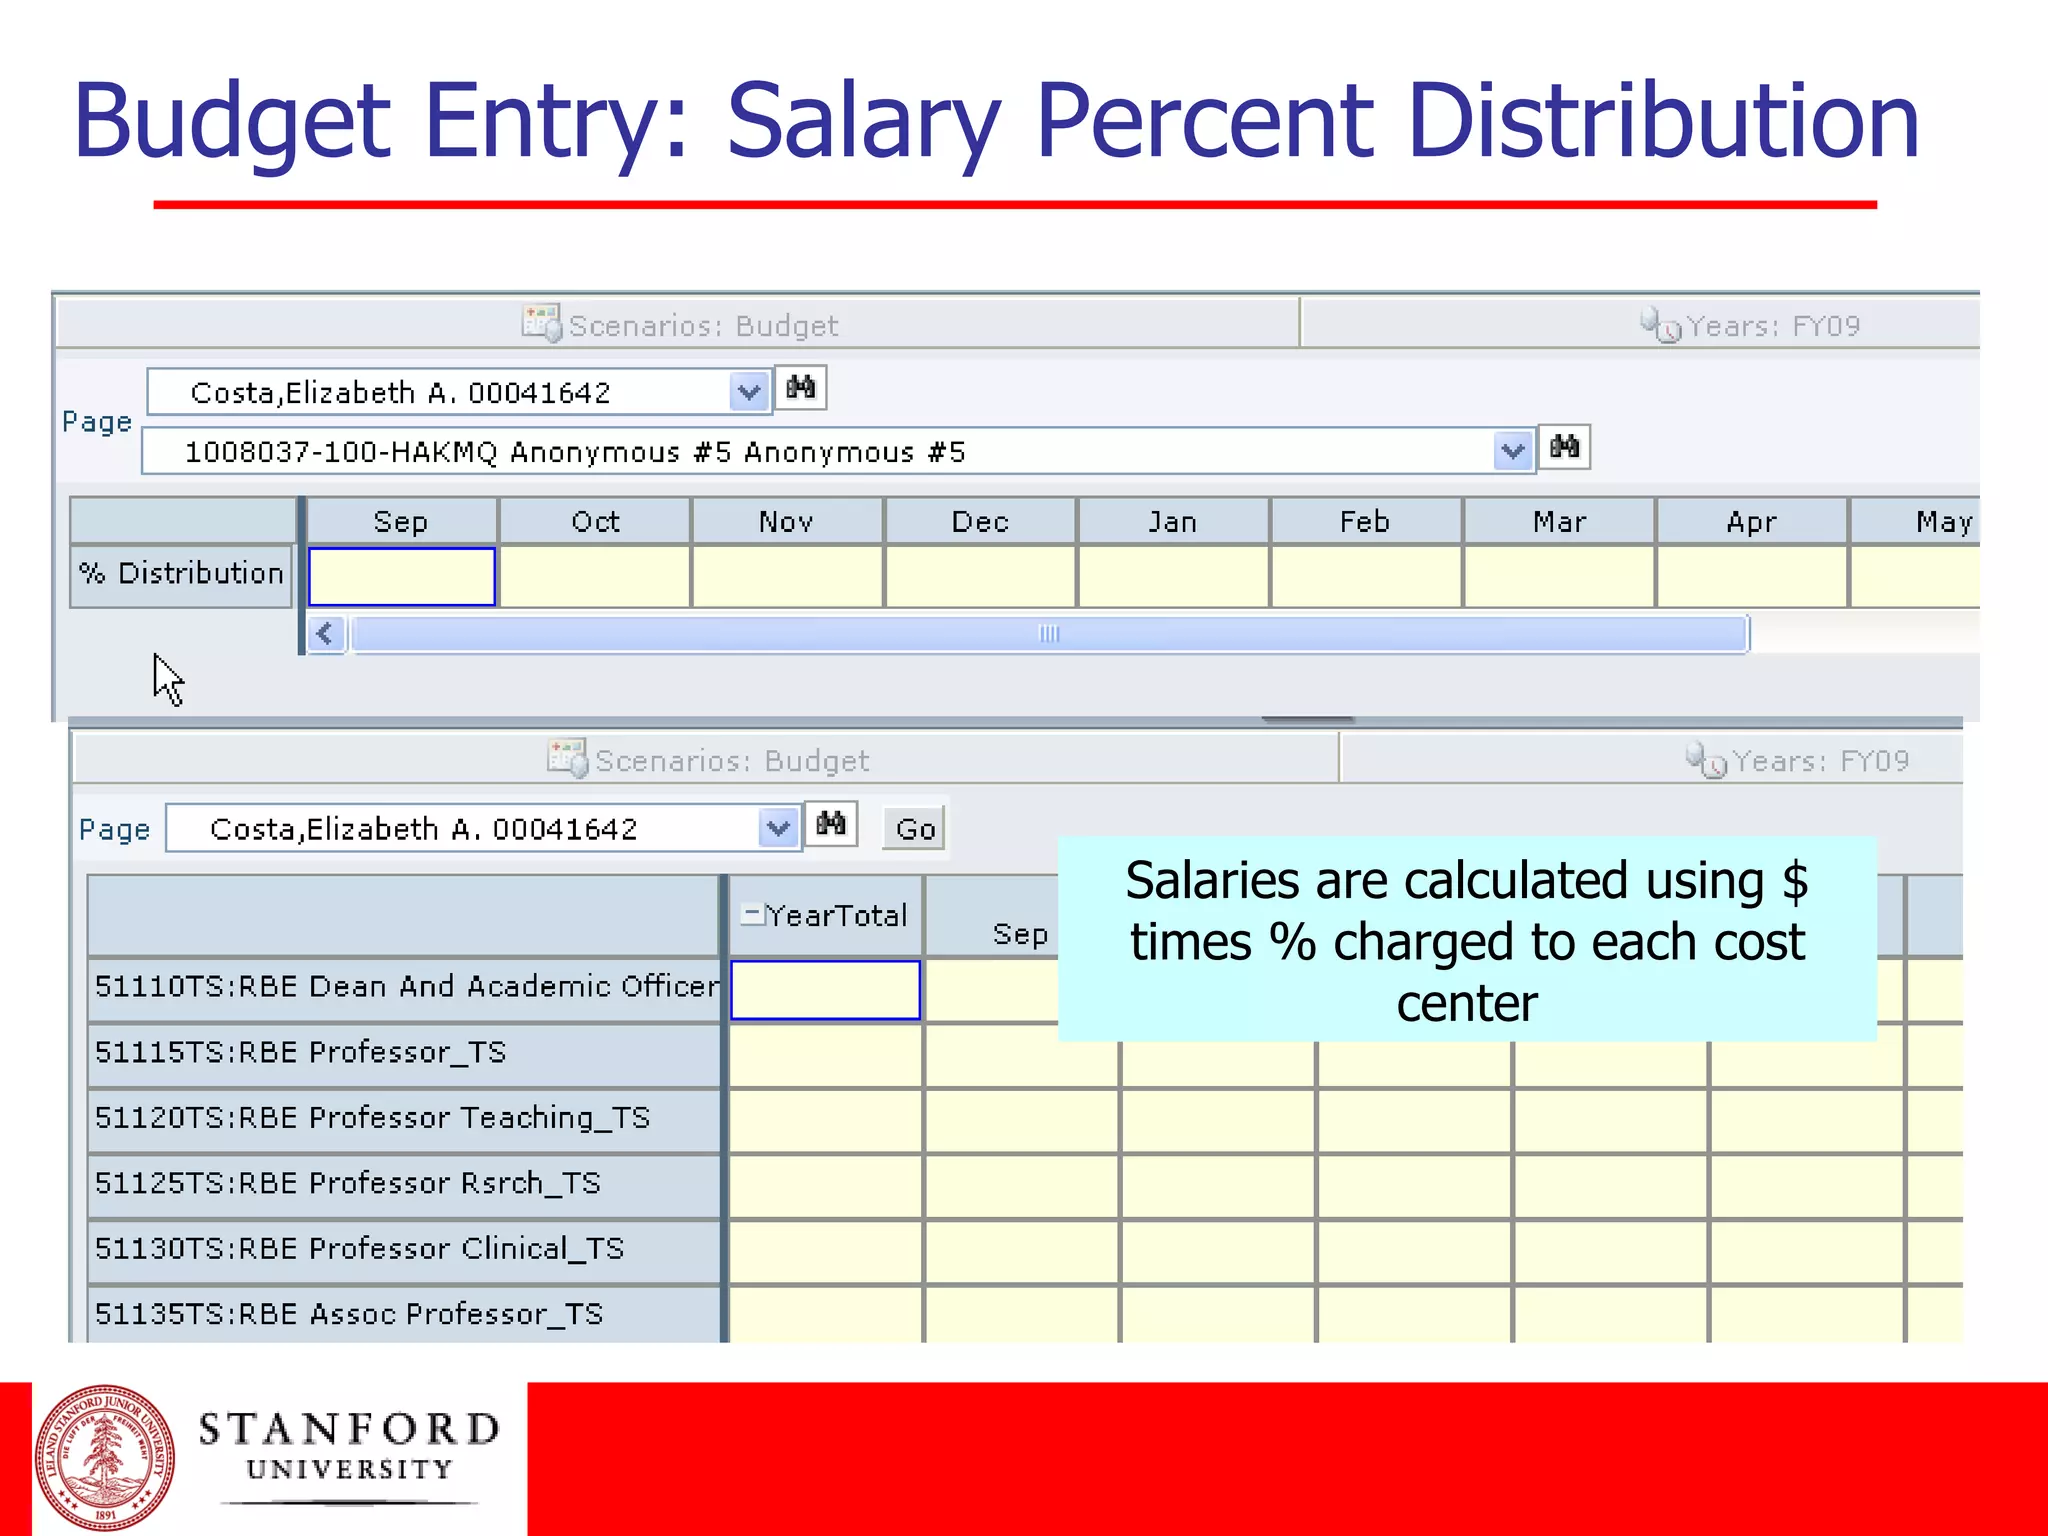
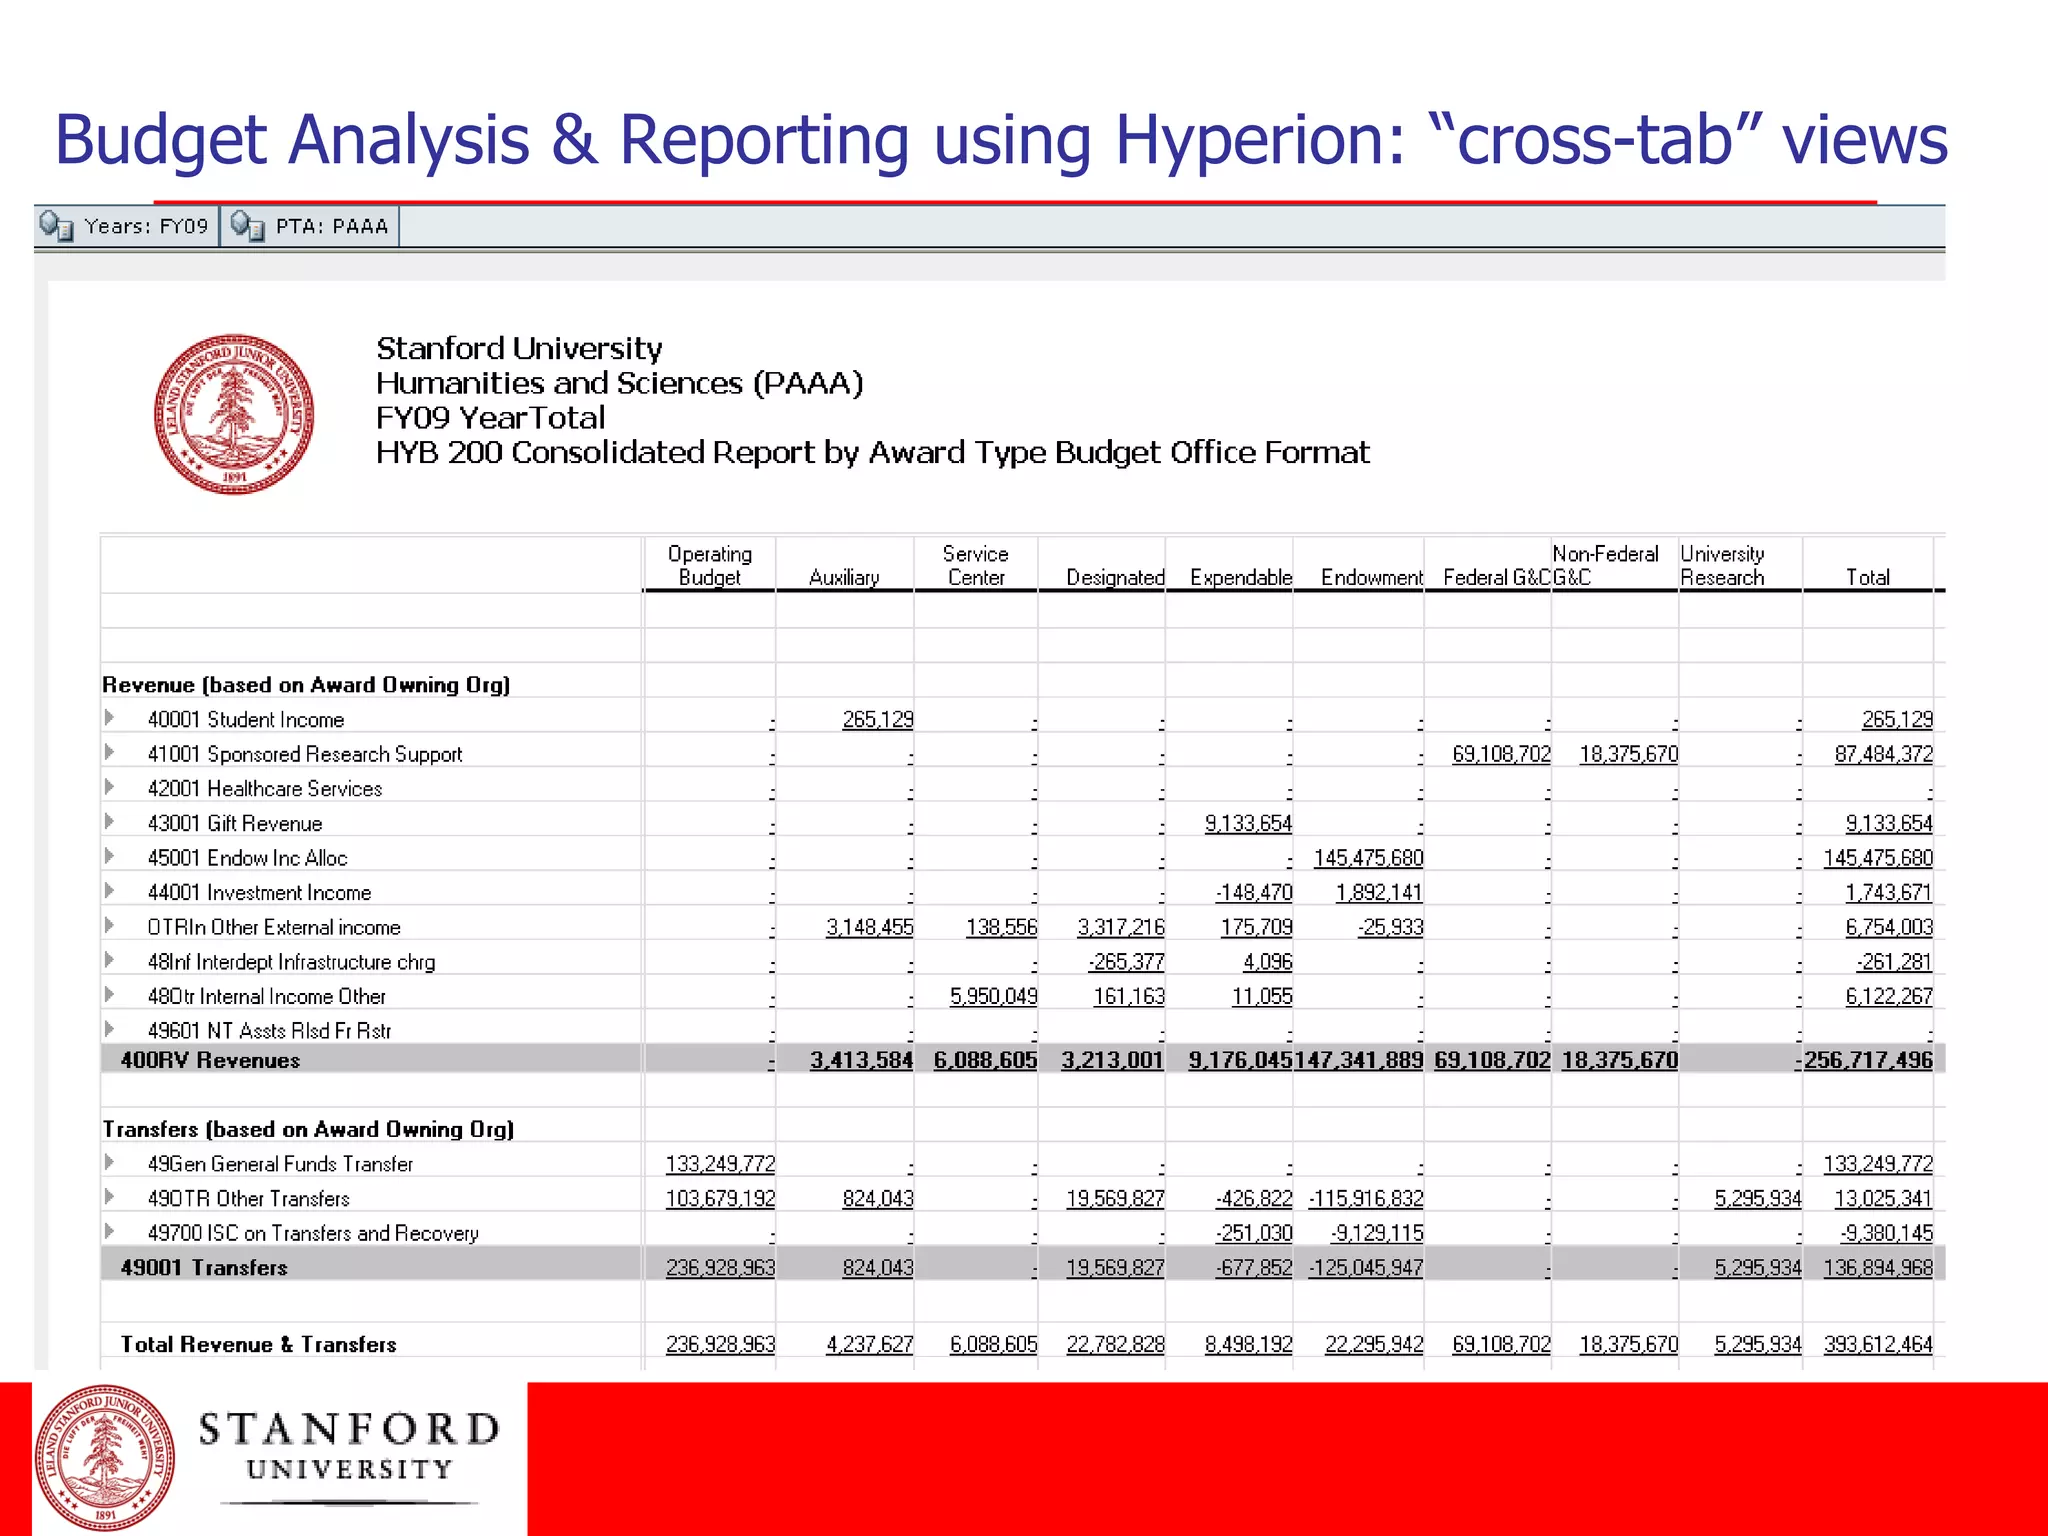
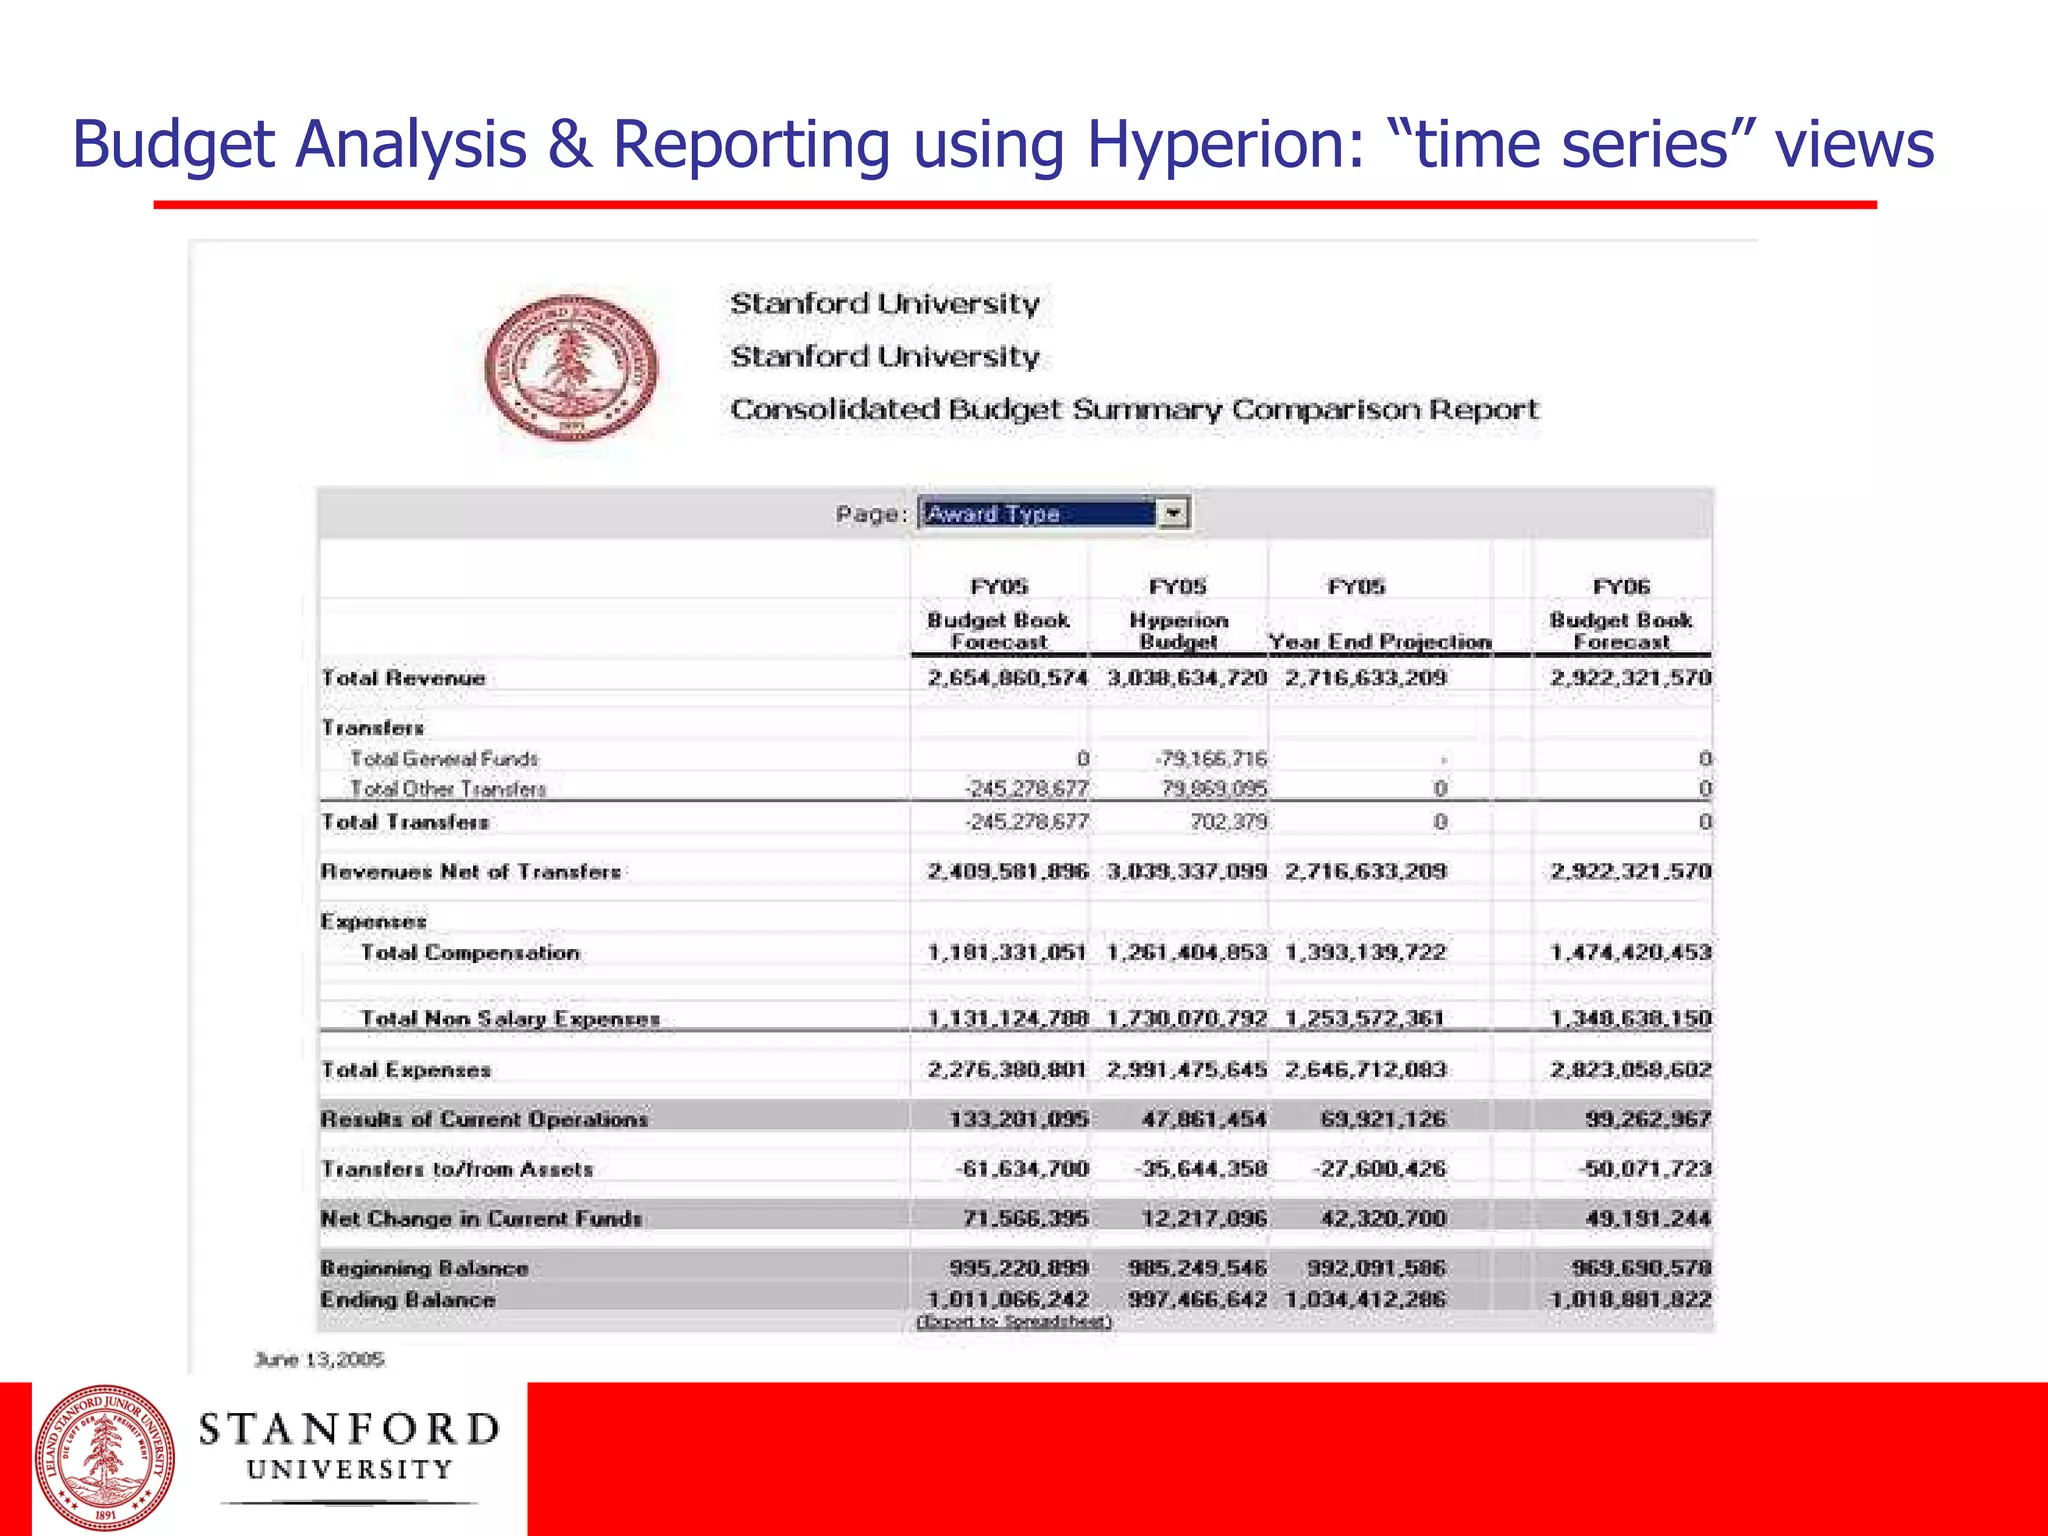
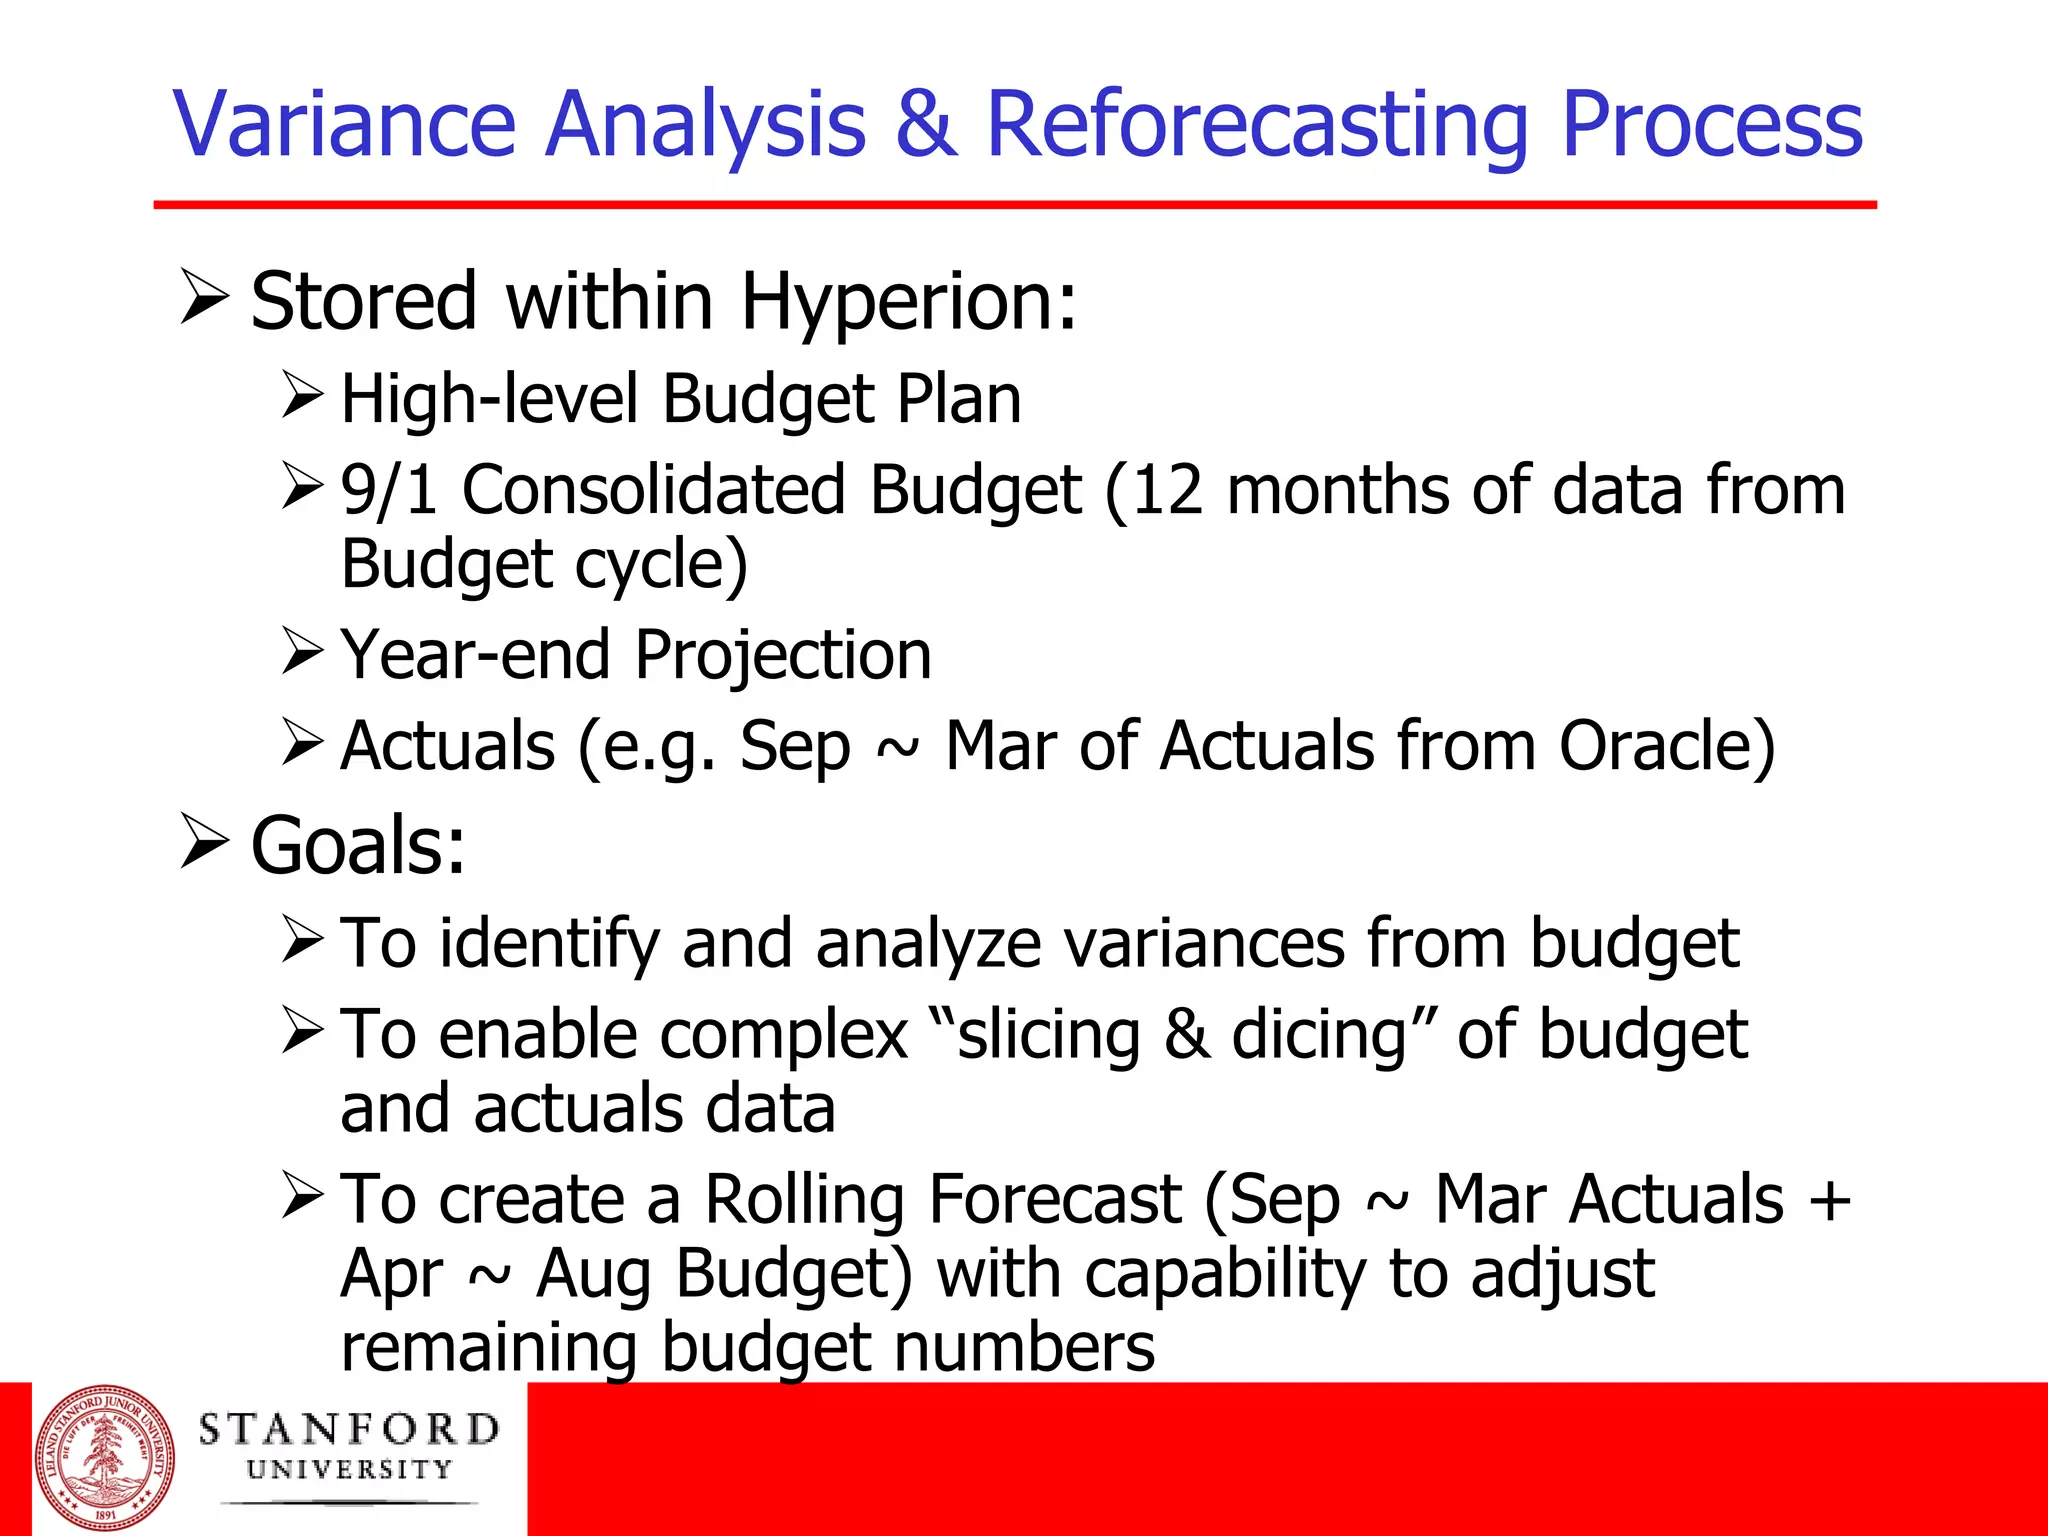
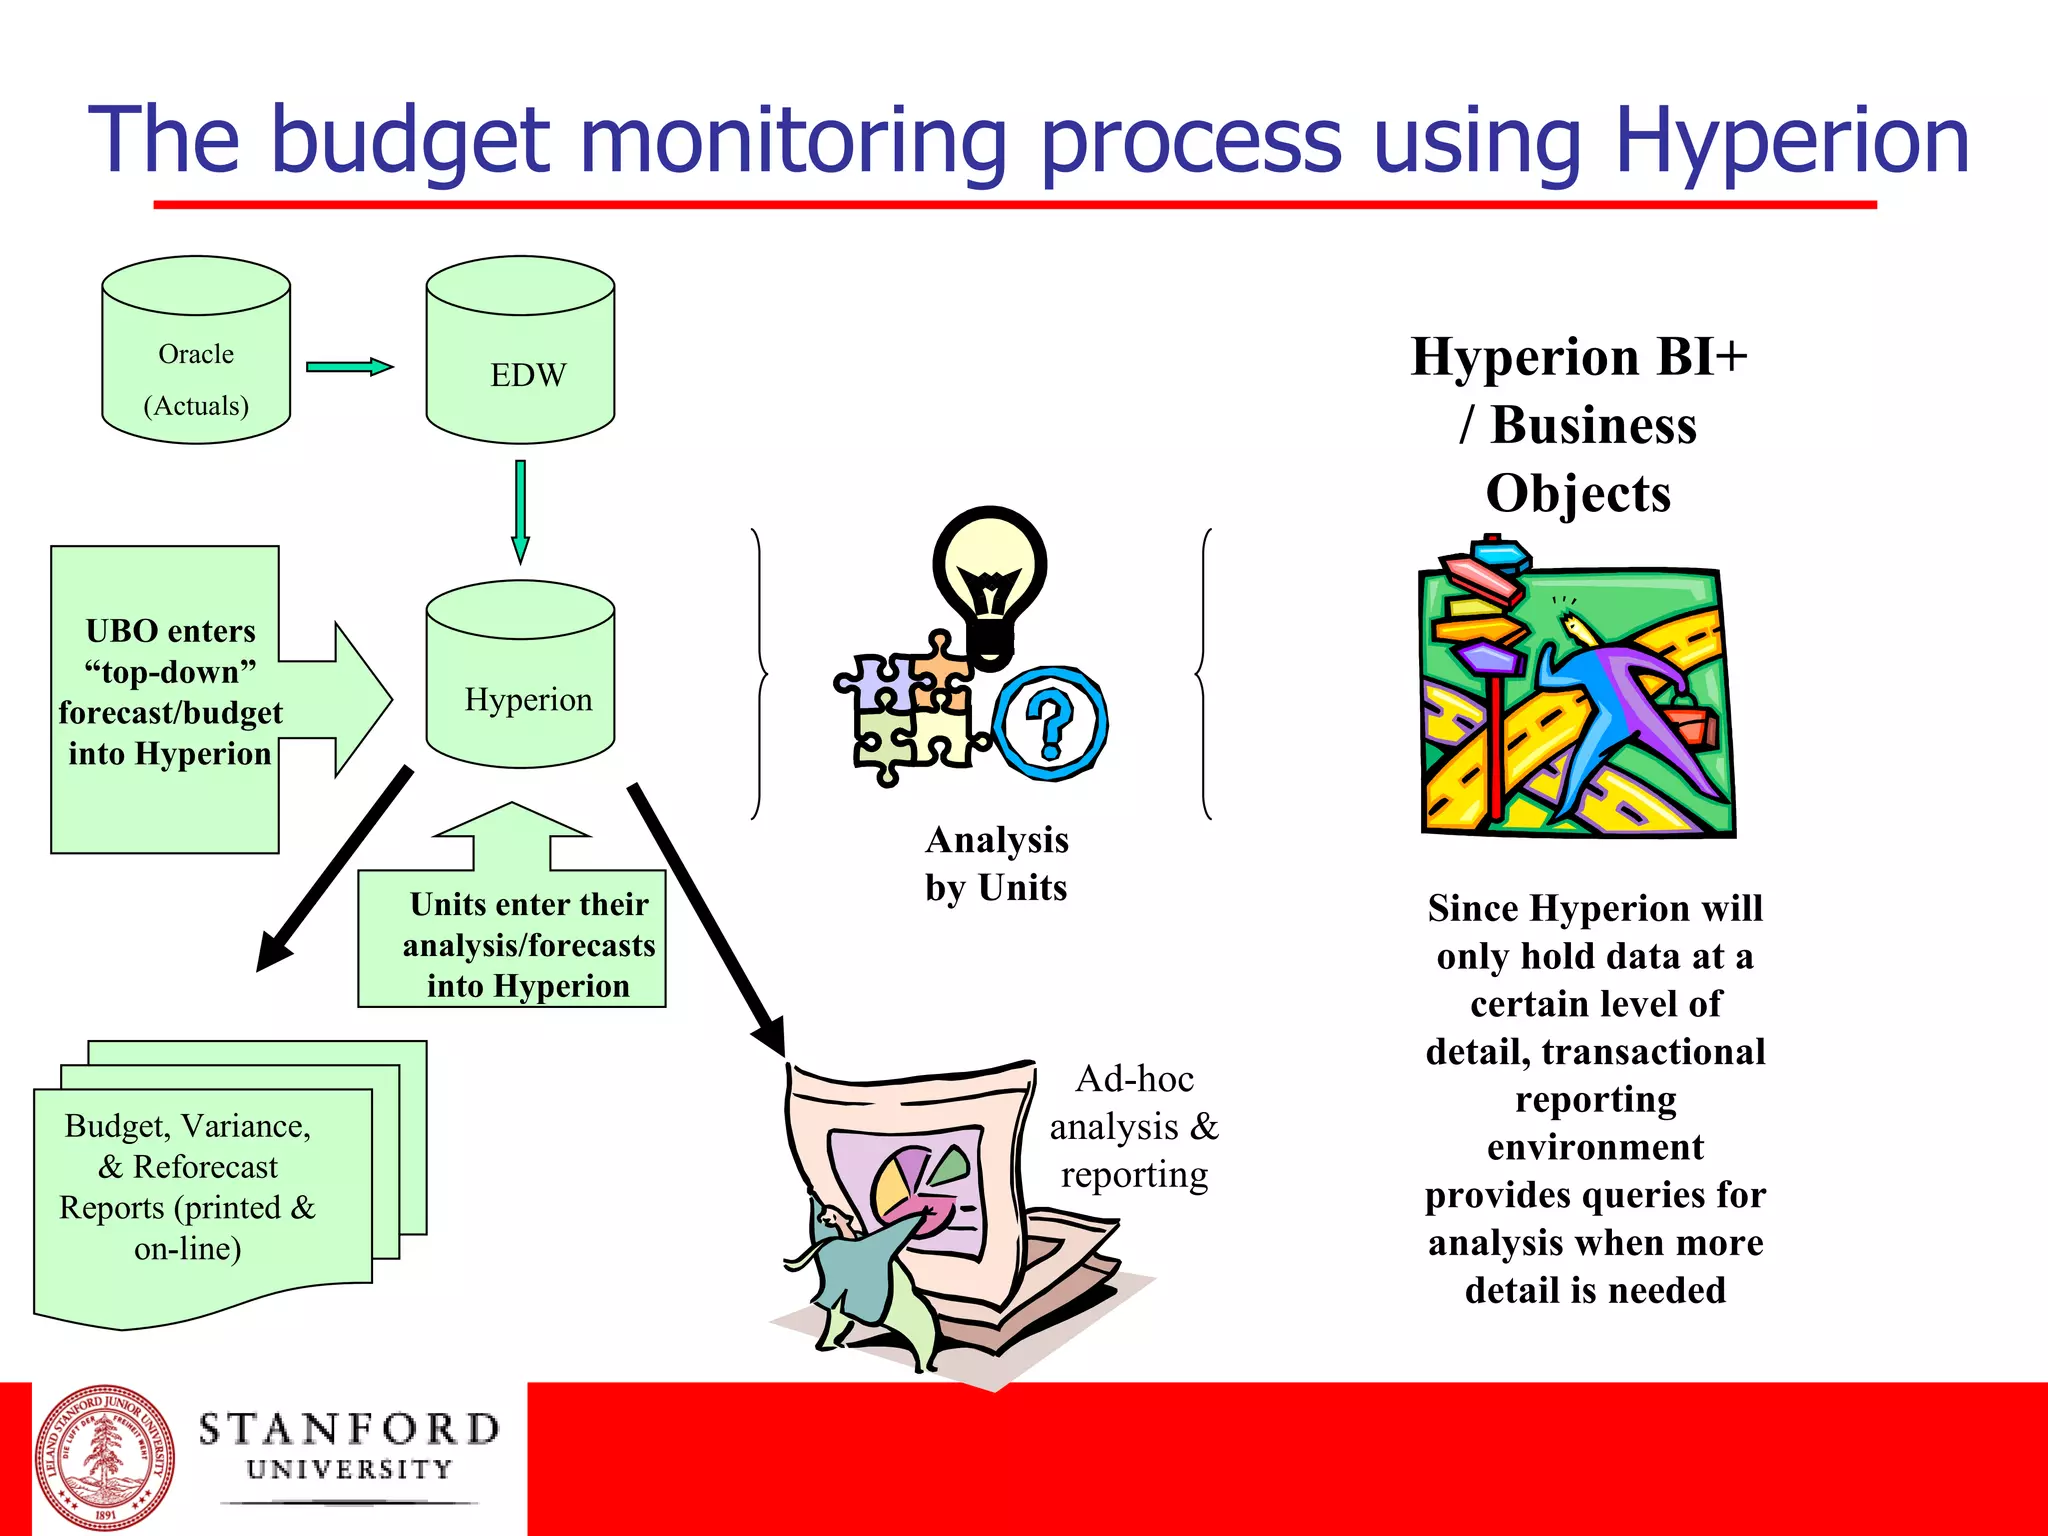
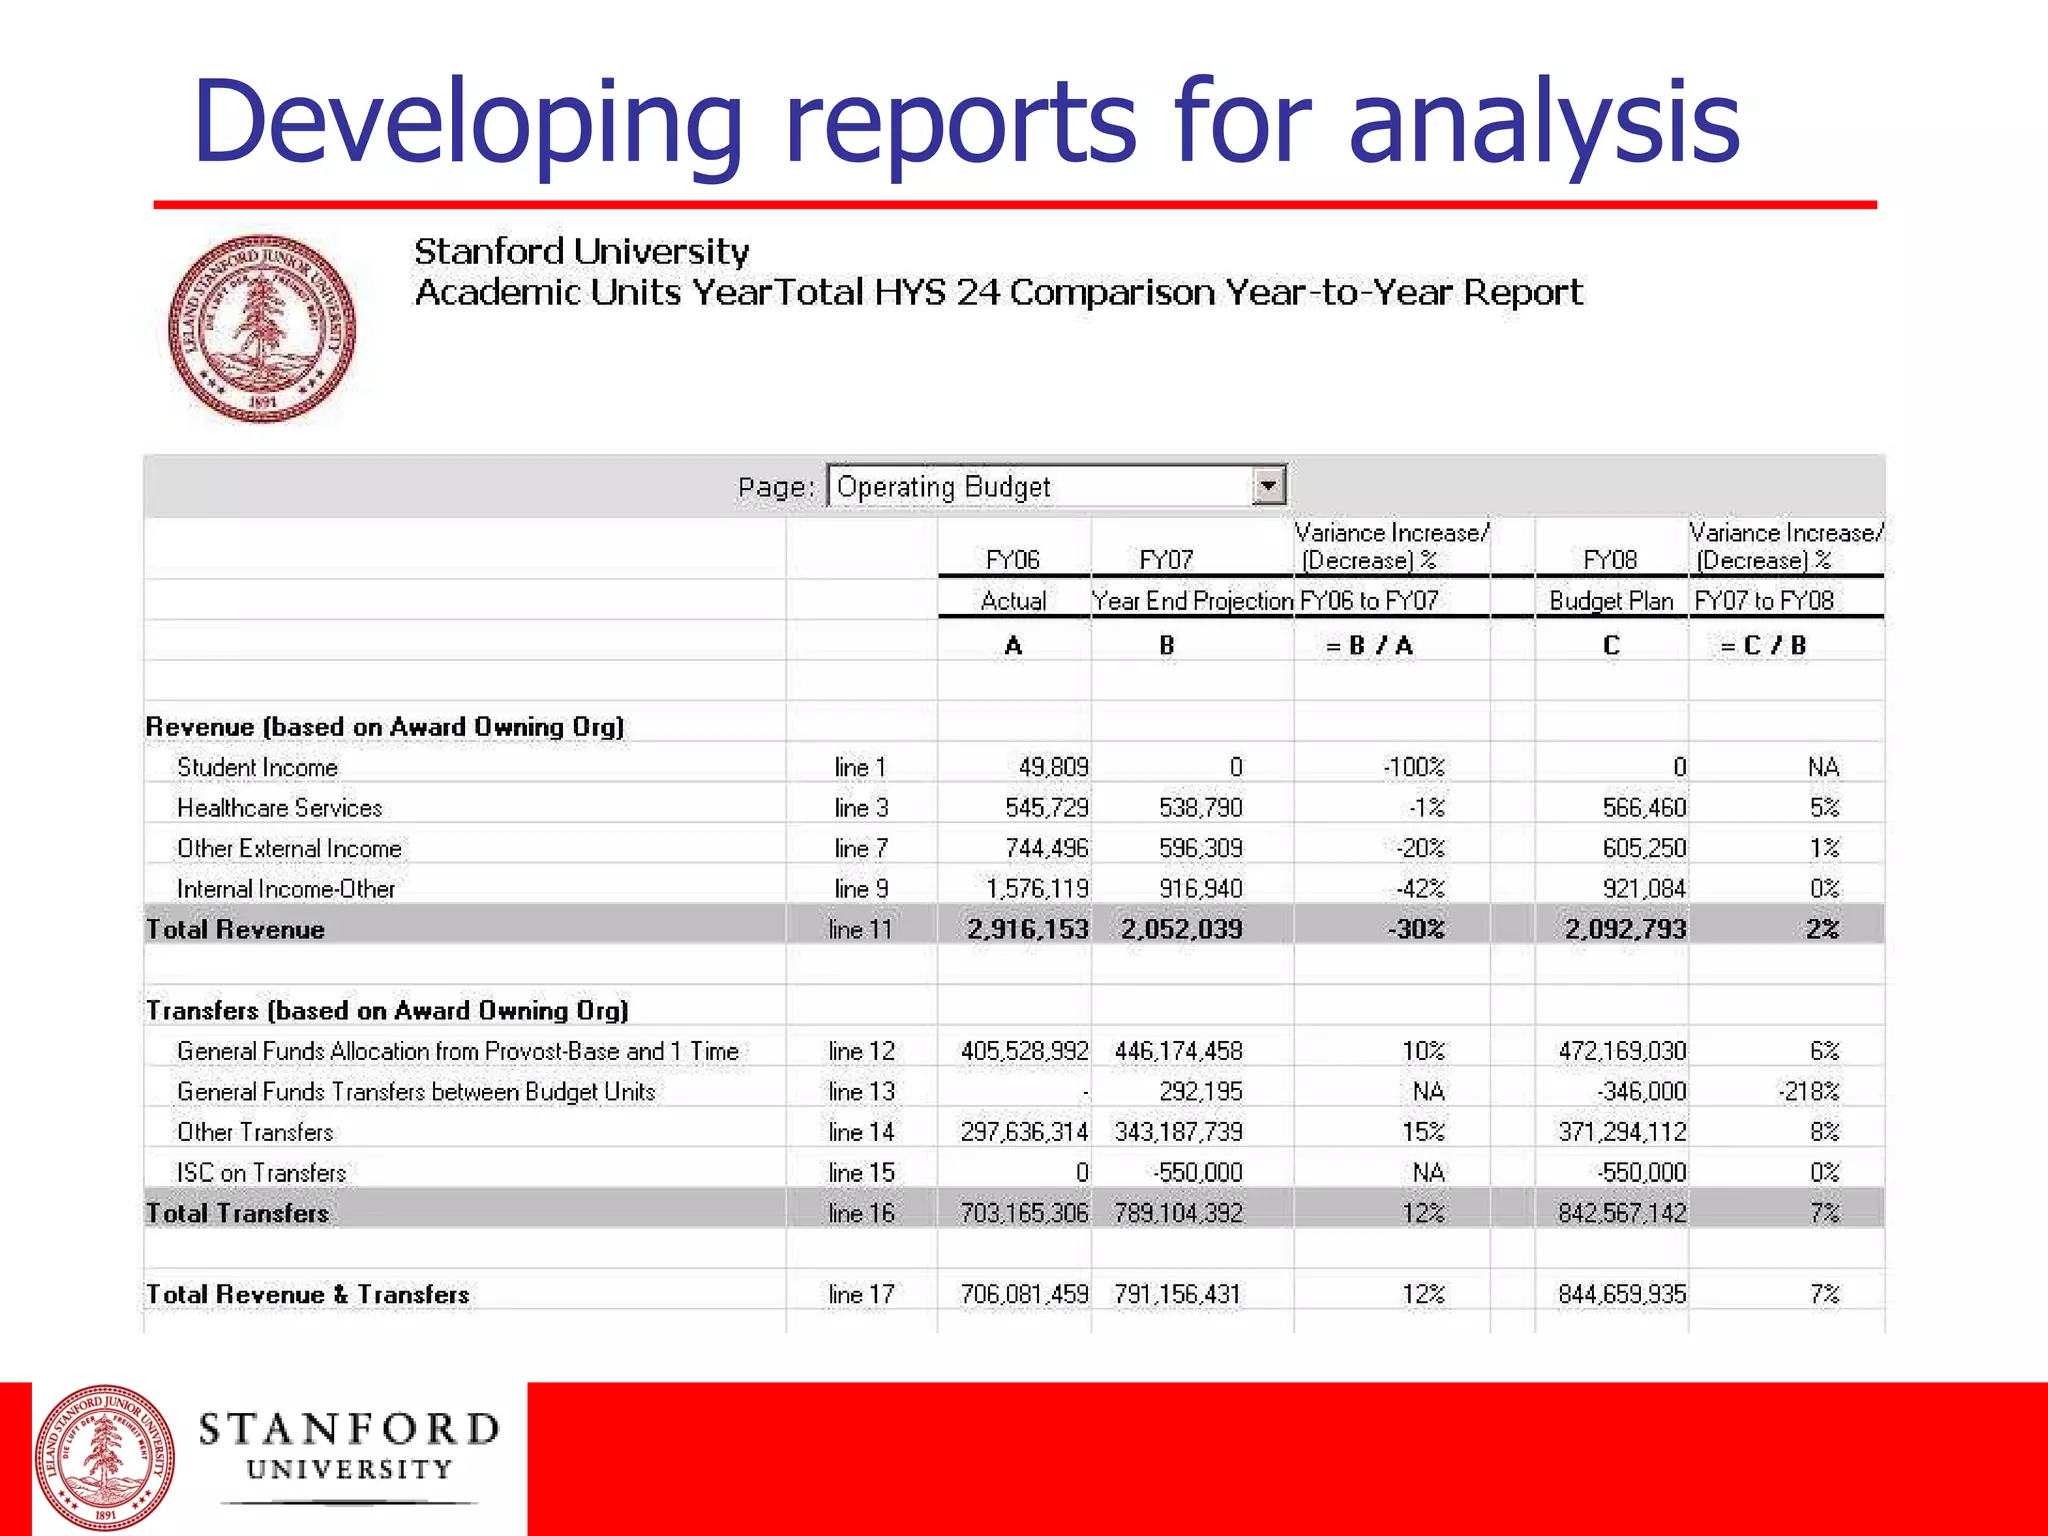
- Stanford uses Hyperion Planning for budget formulation, monitoring, reforecasting, and variance analysis across its $4B budget.
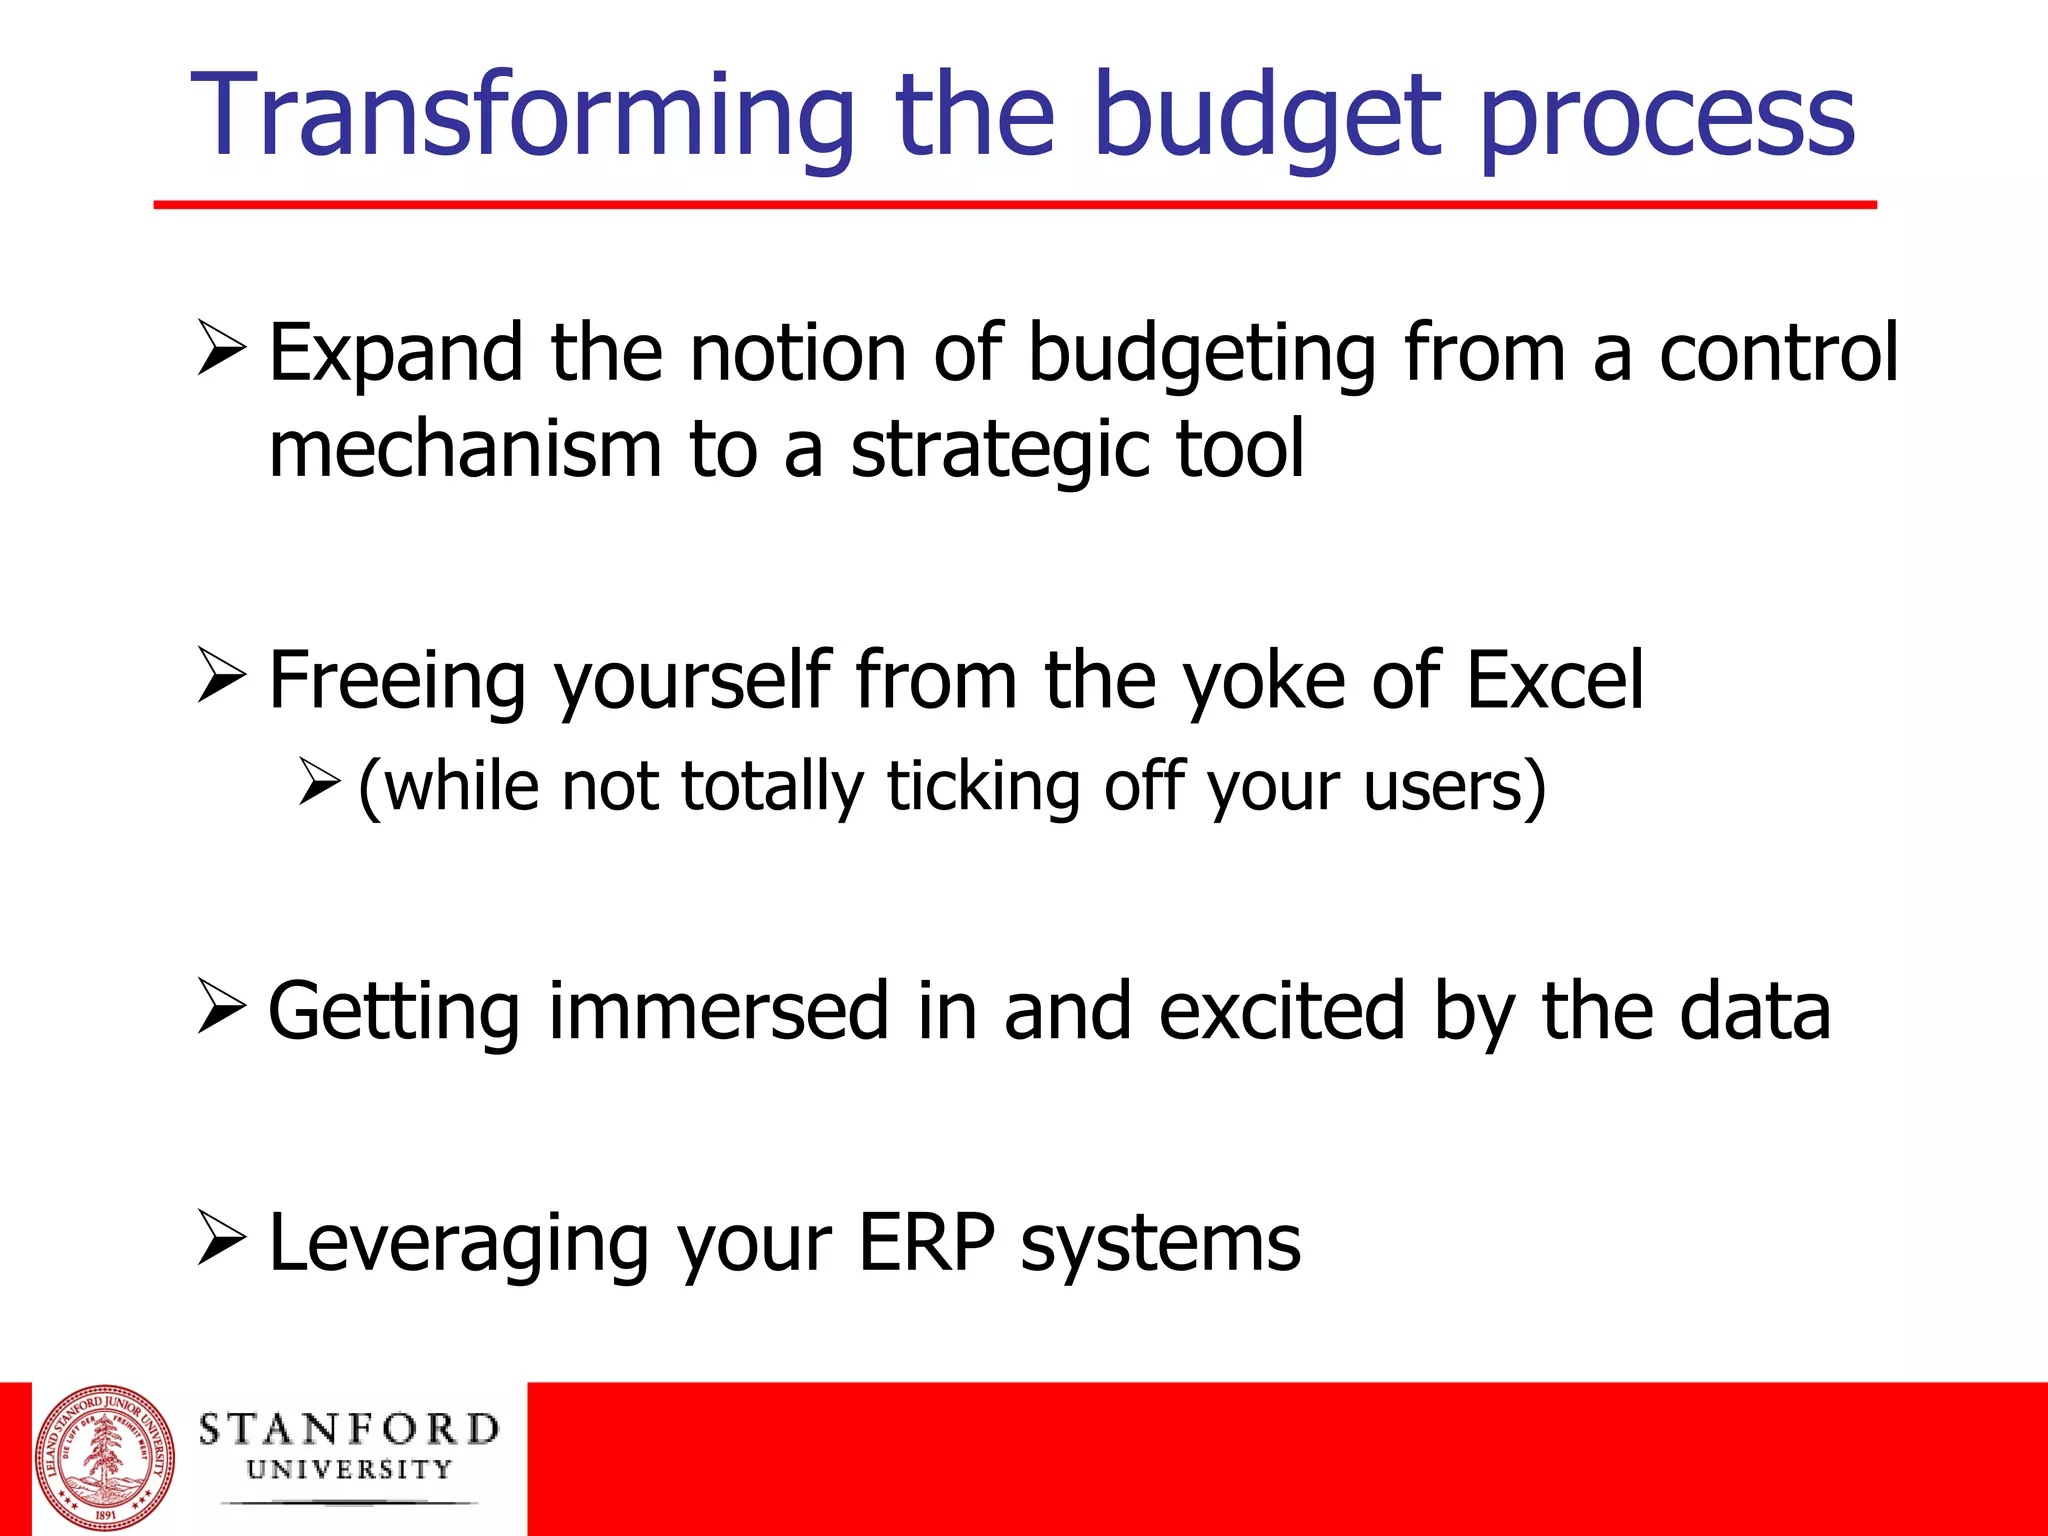
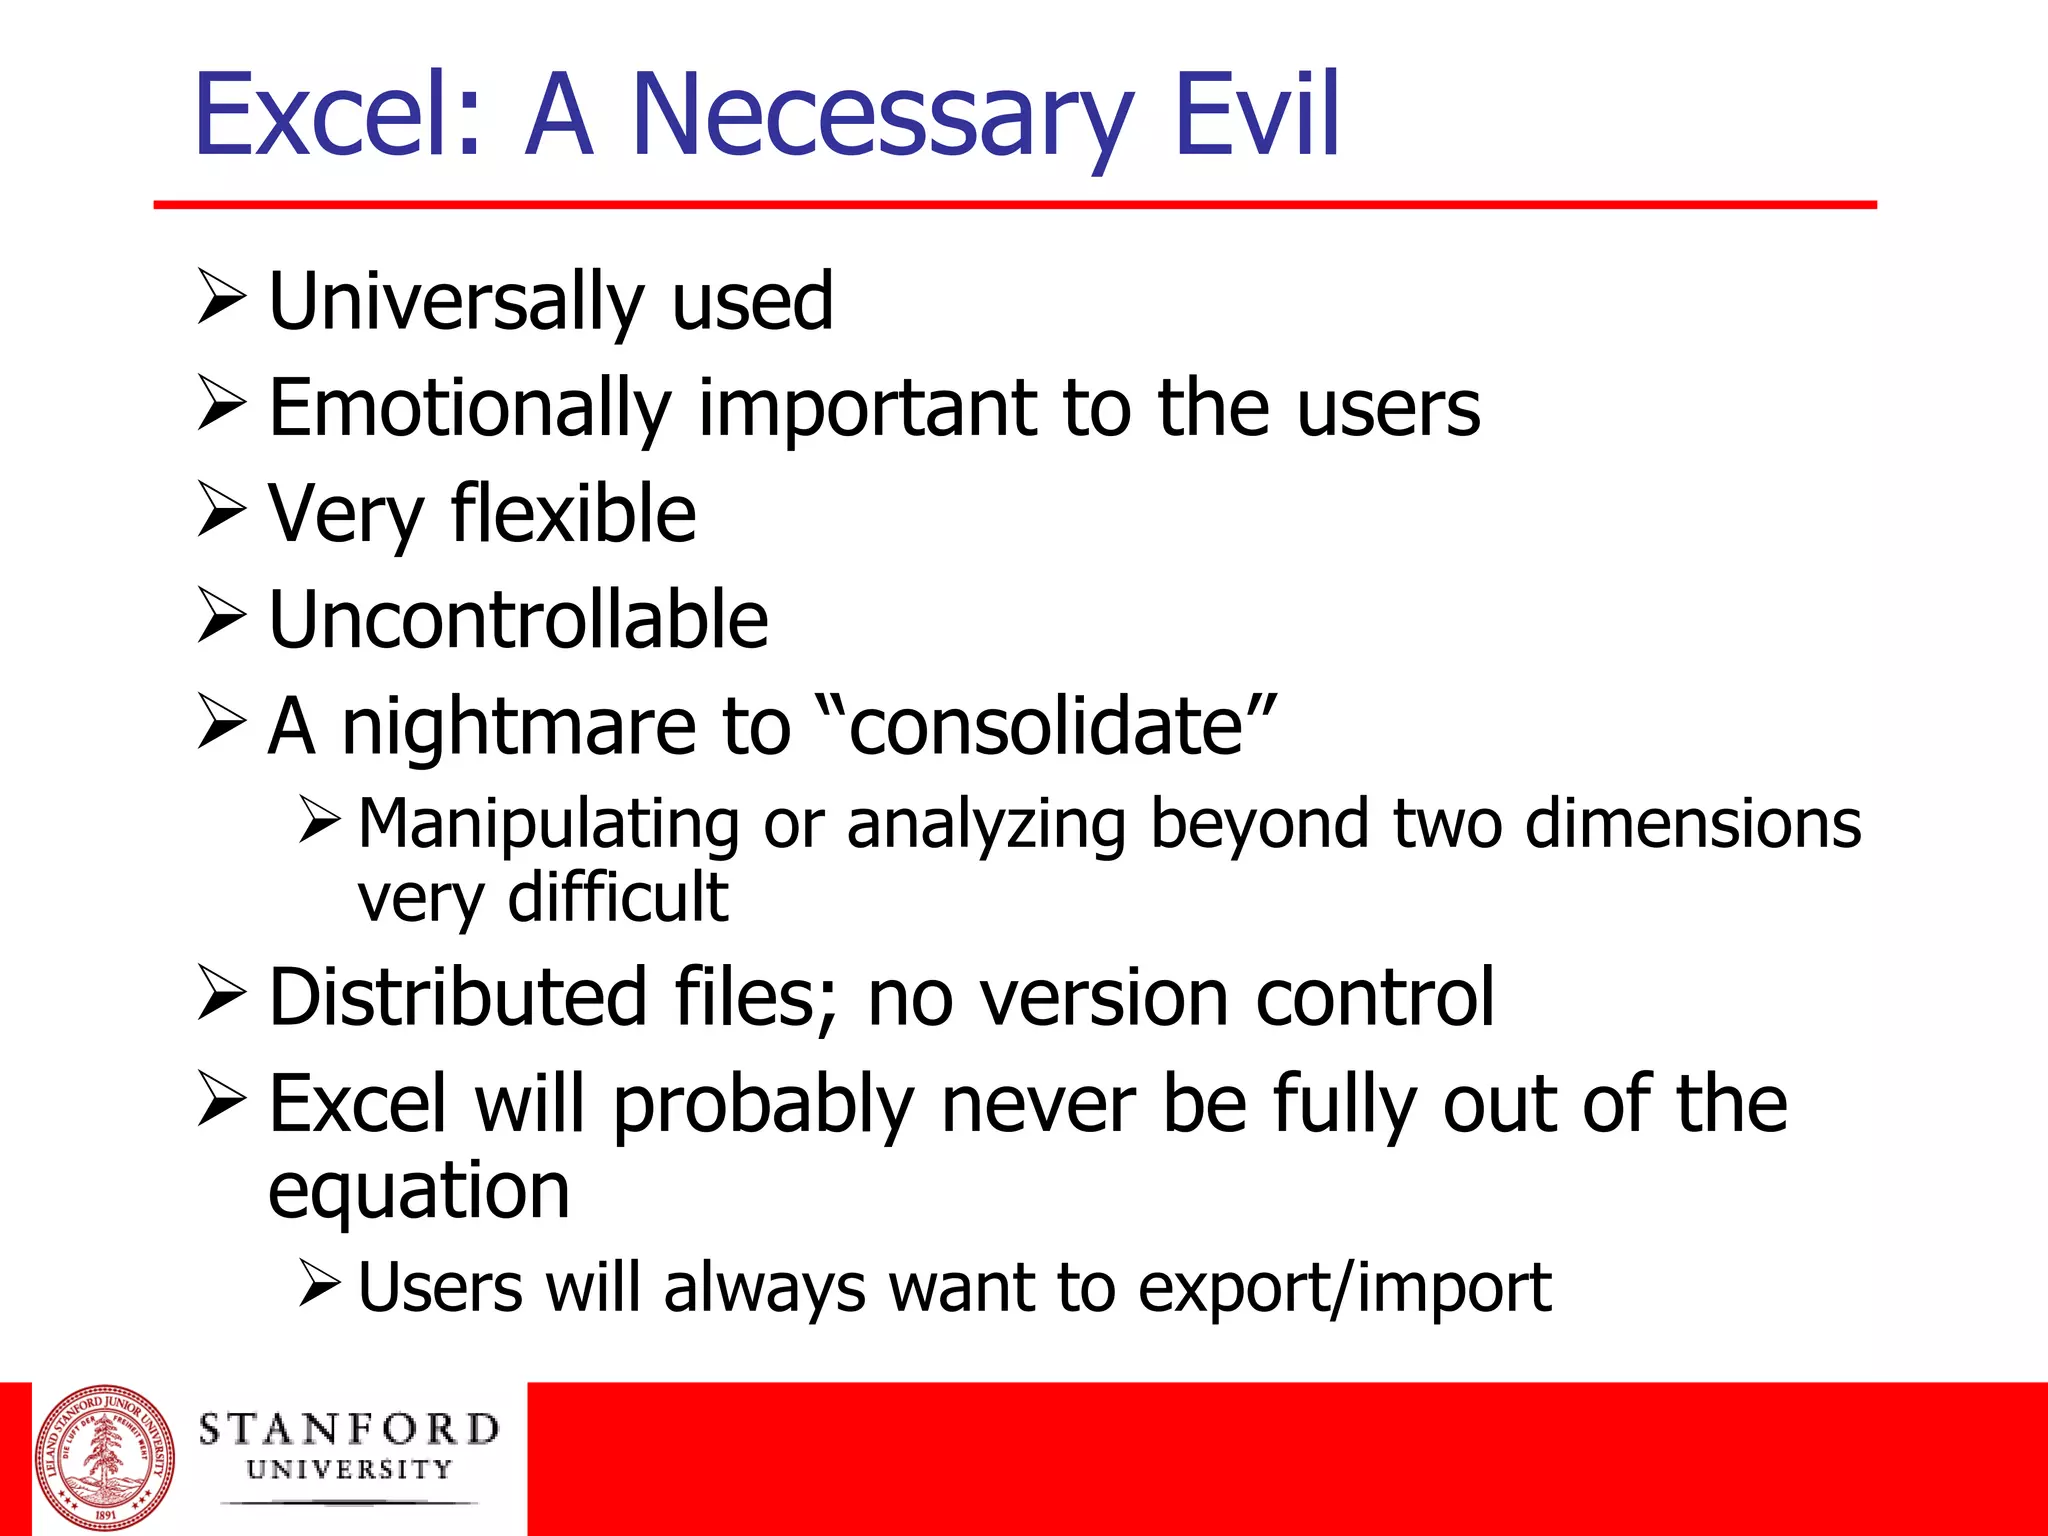
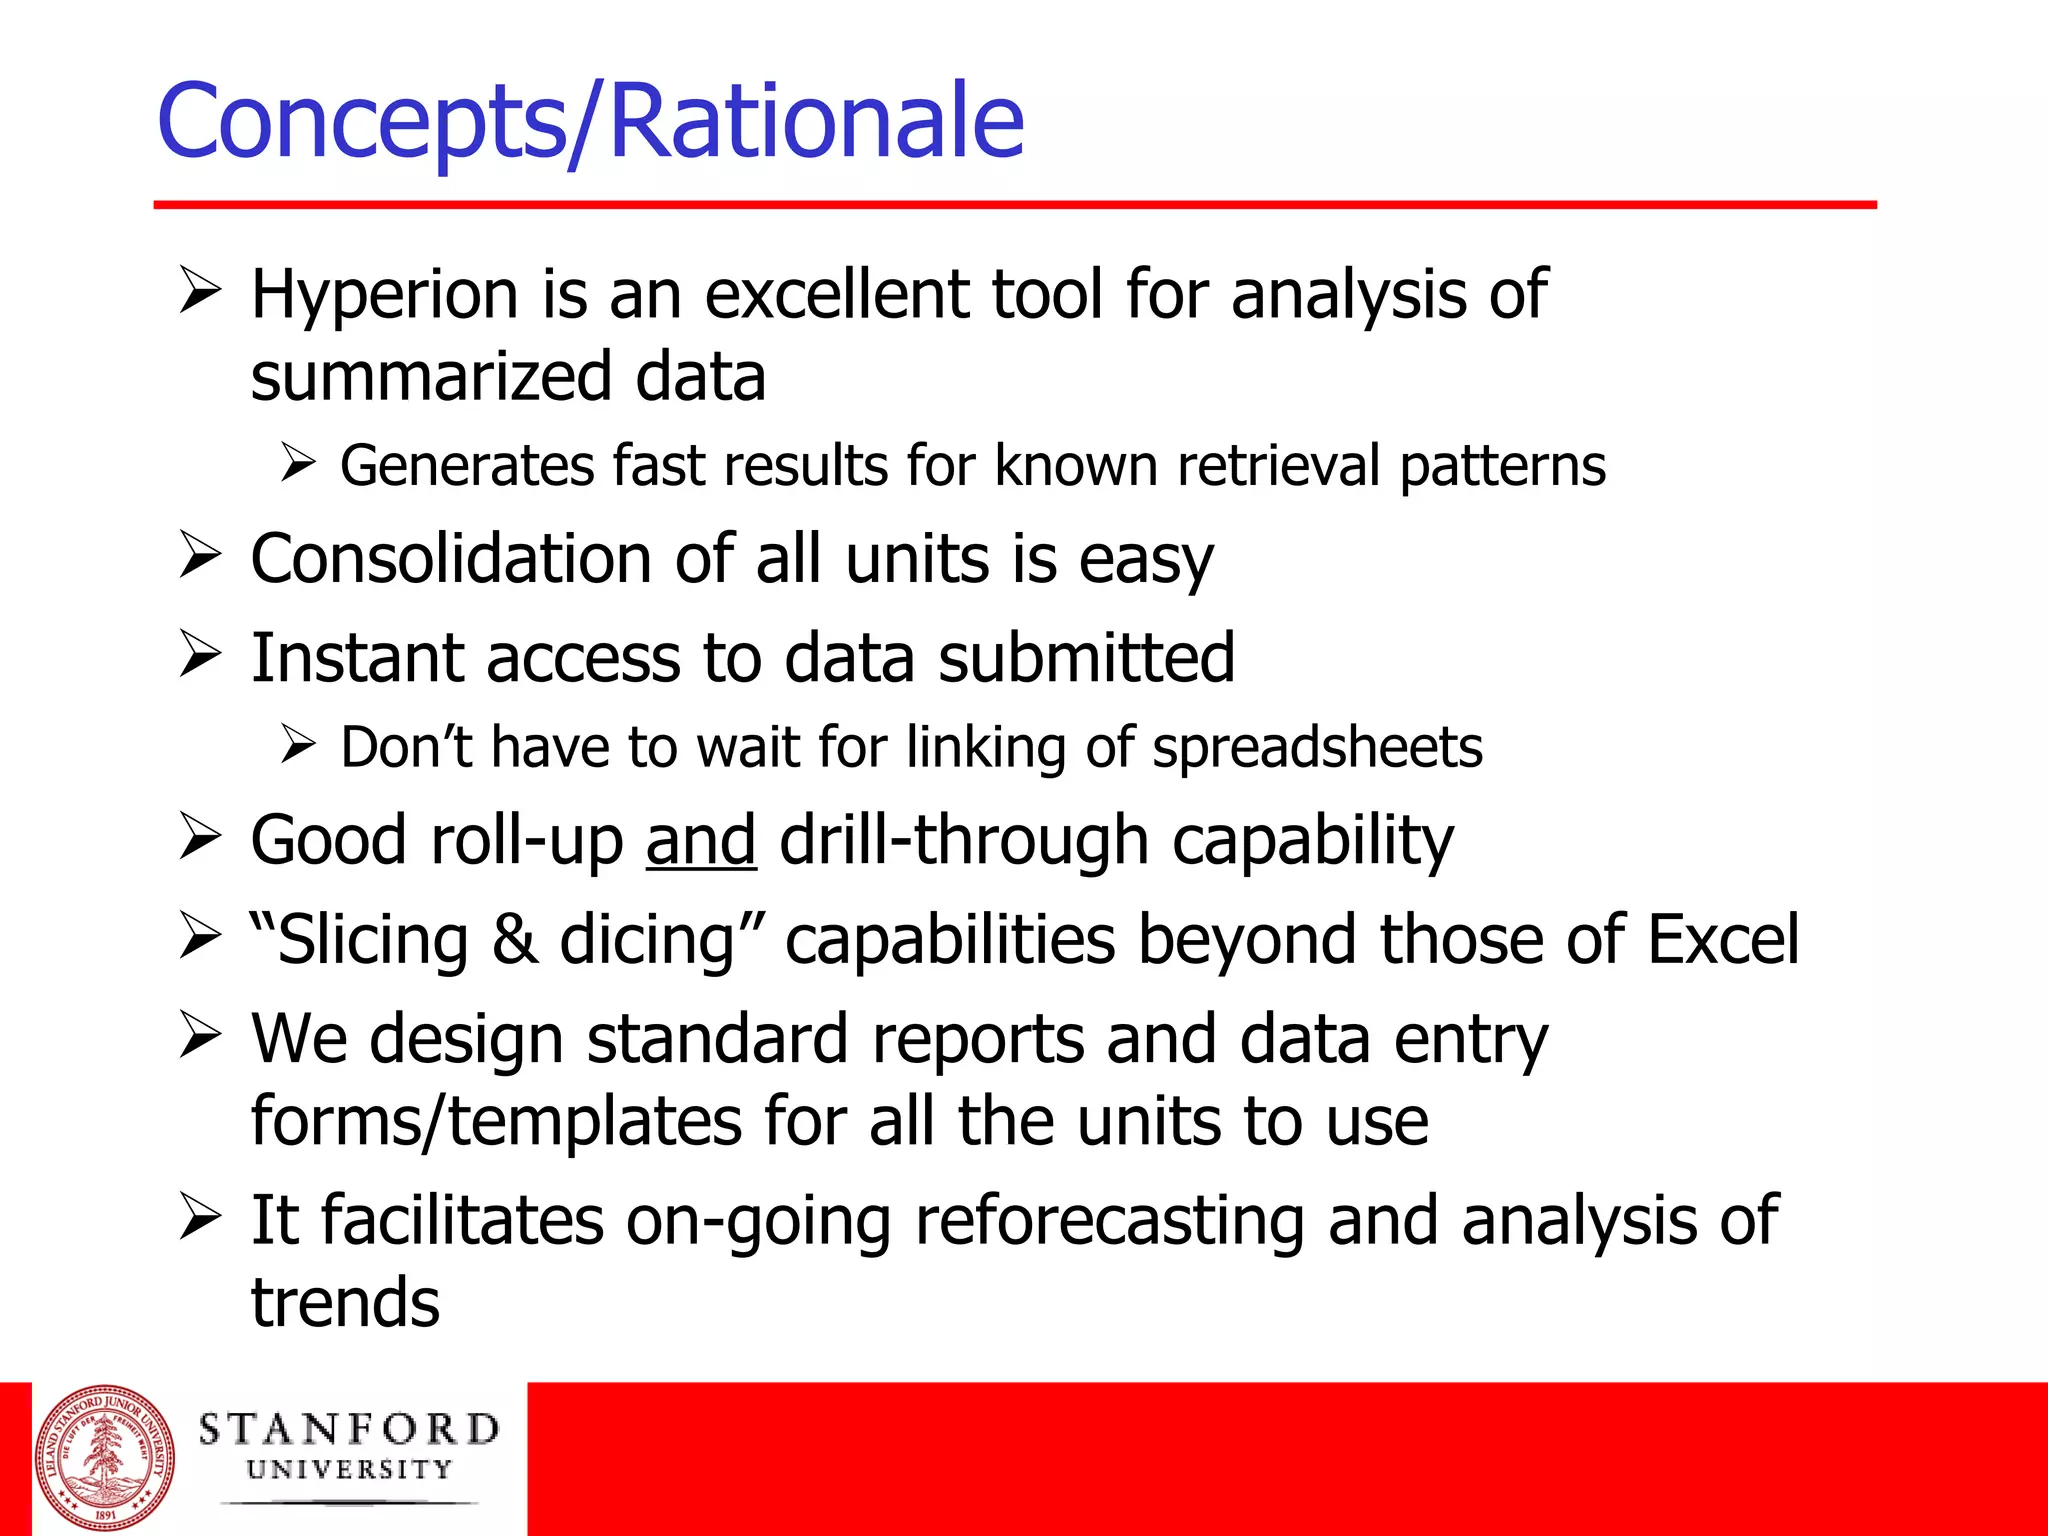
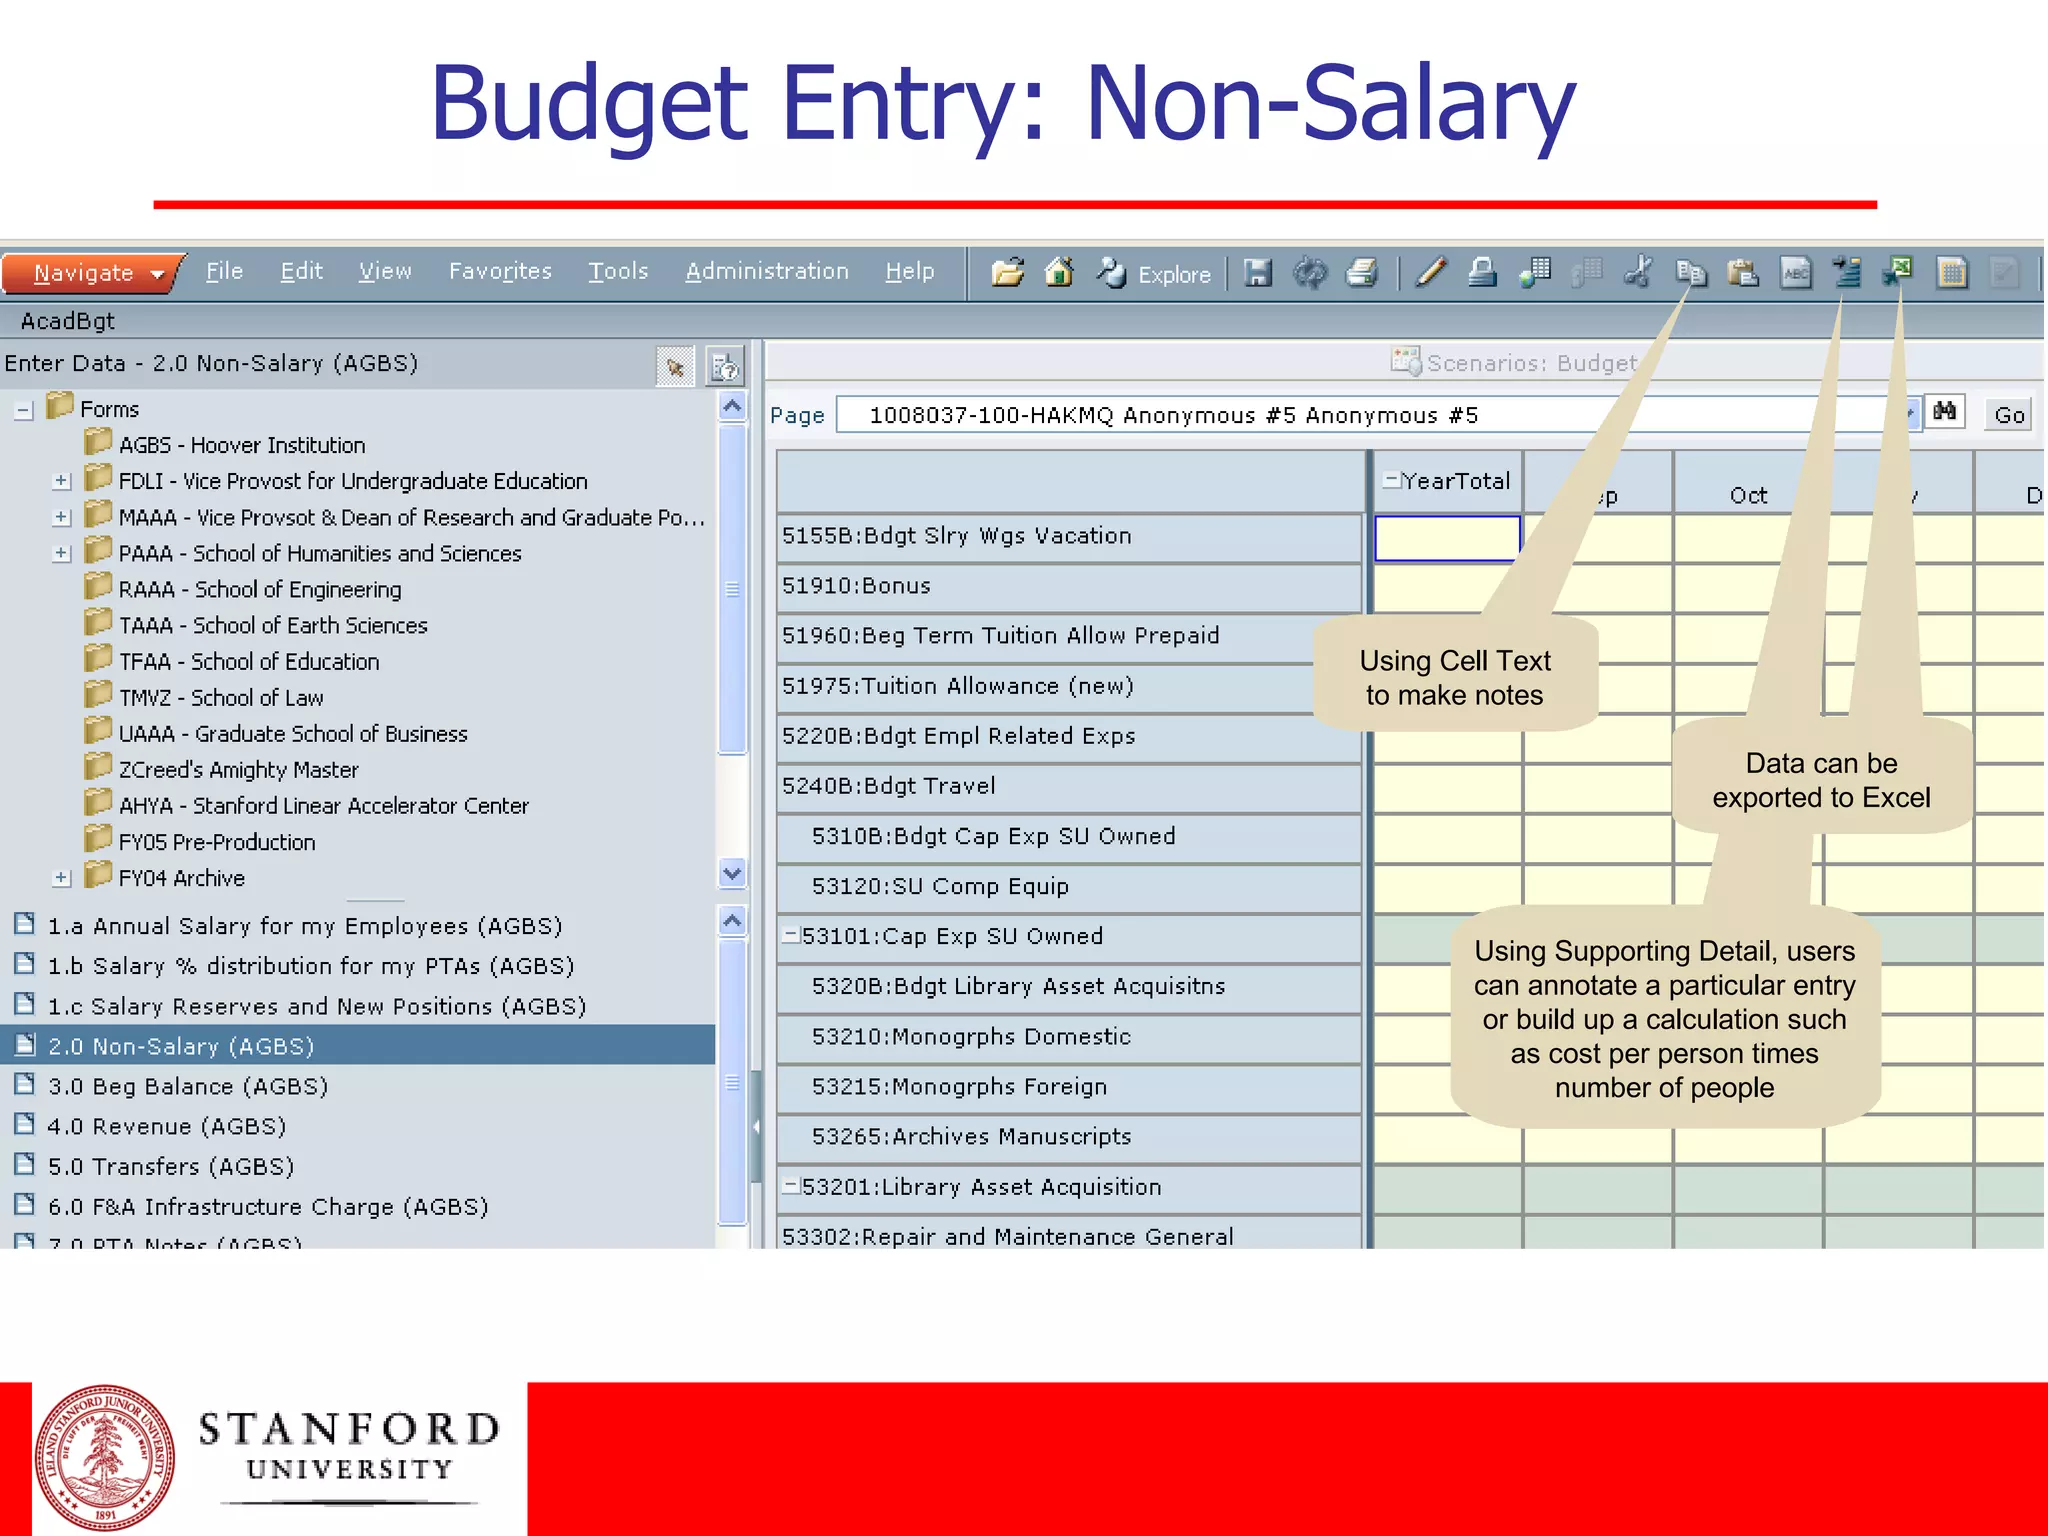
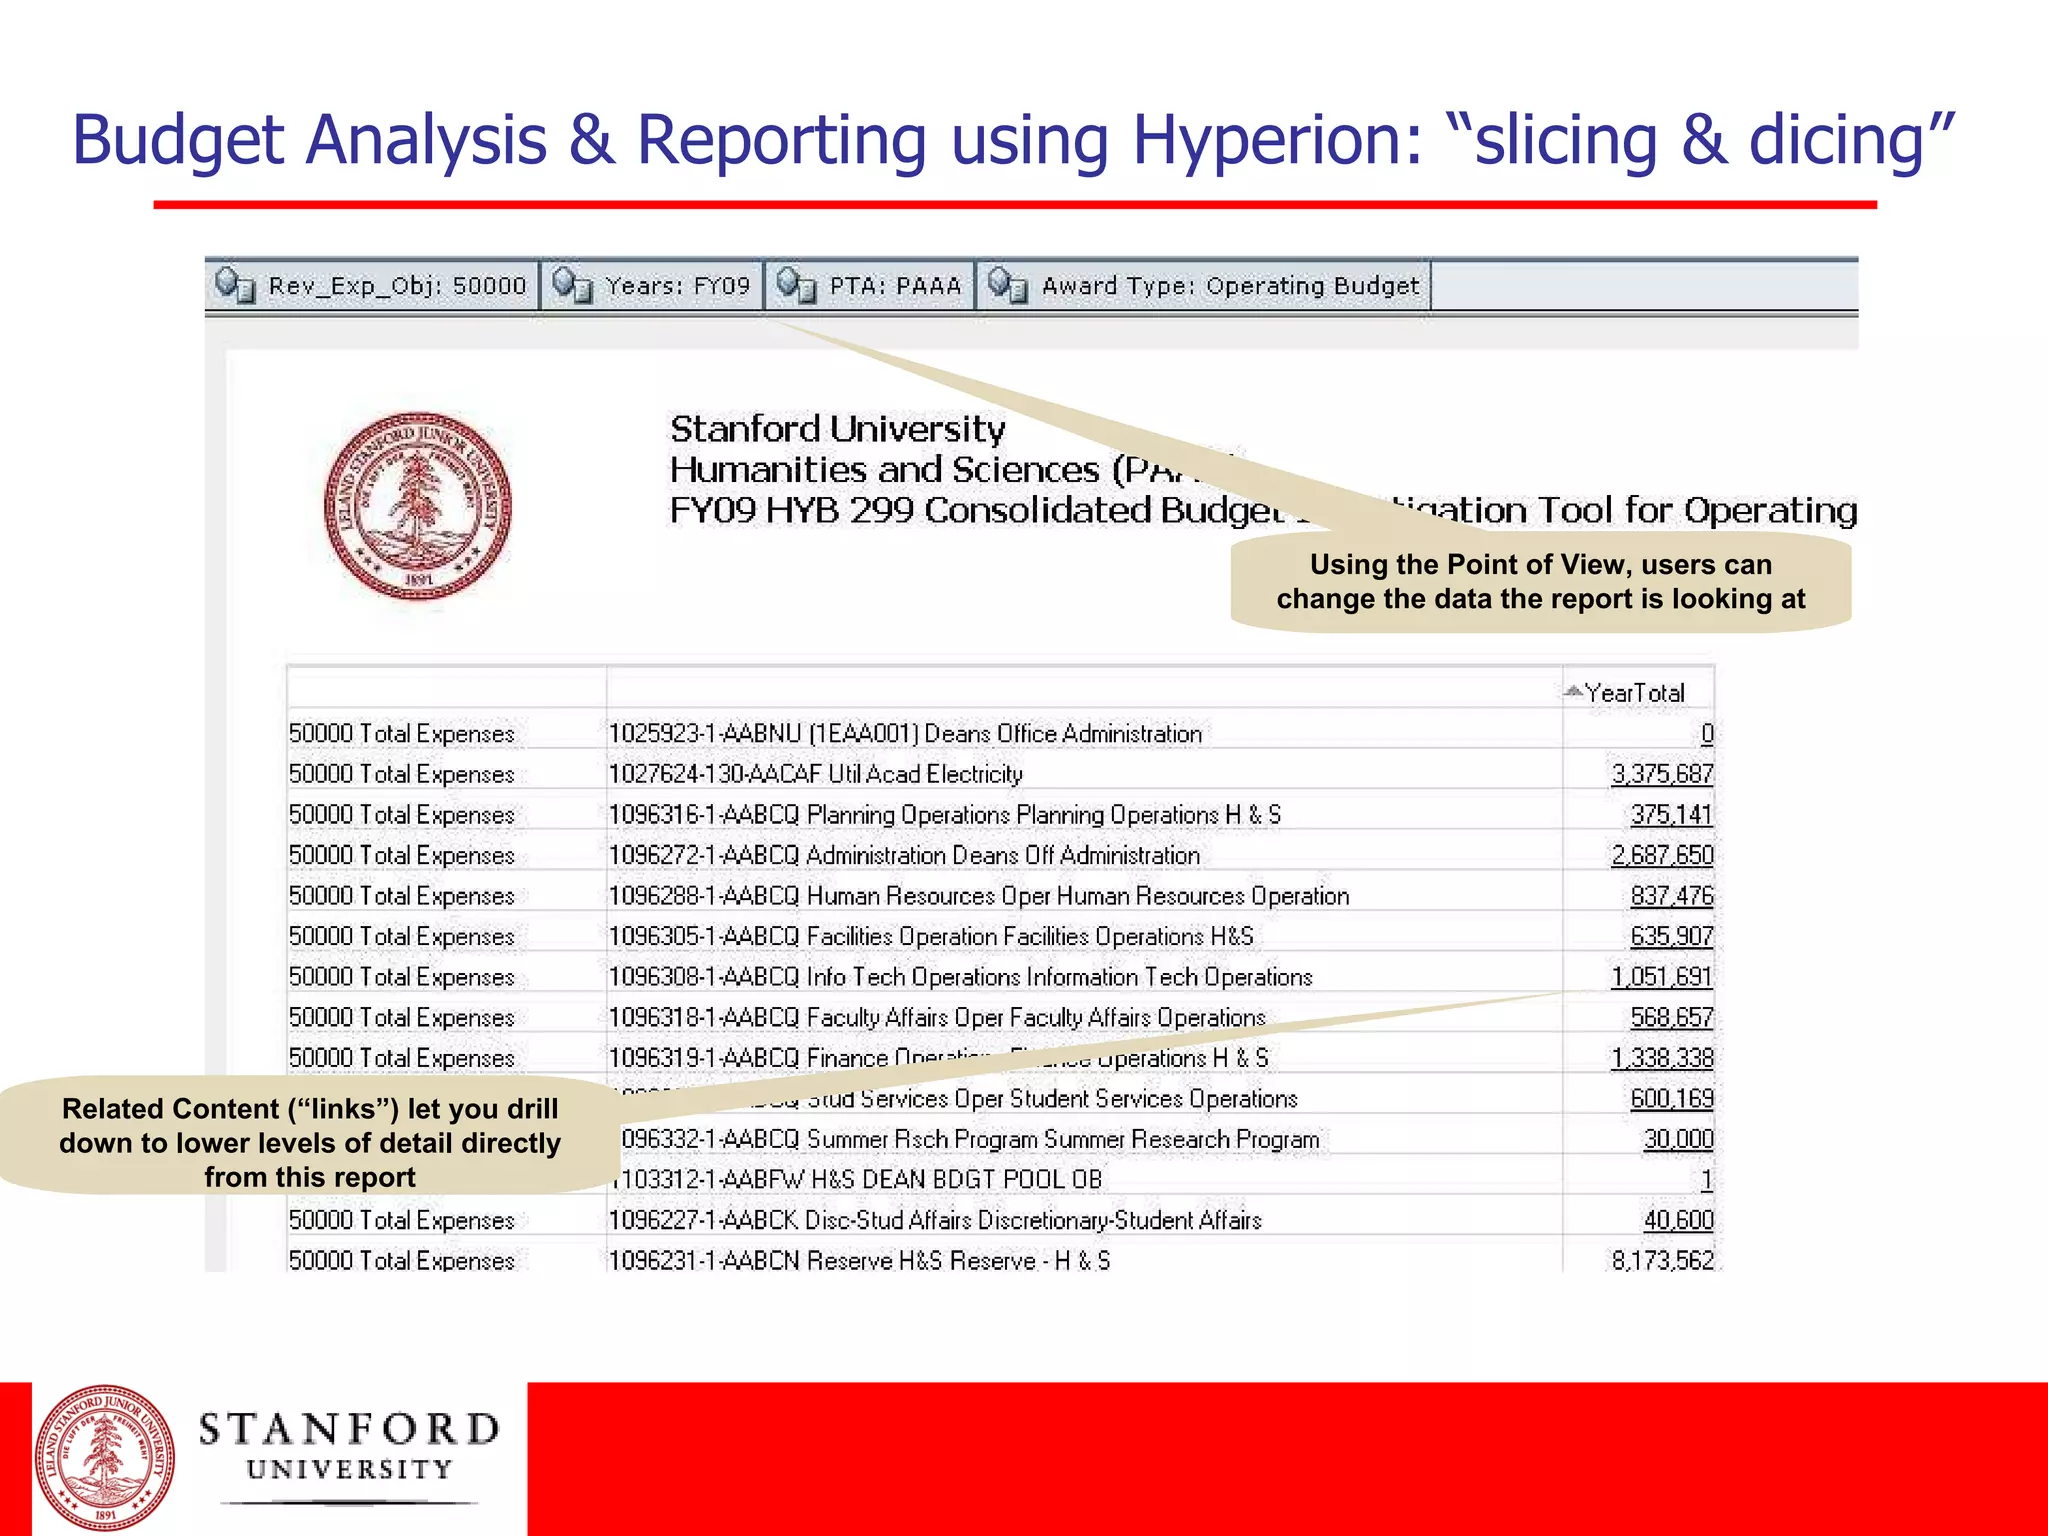
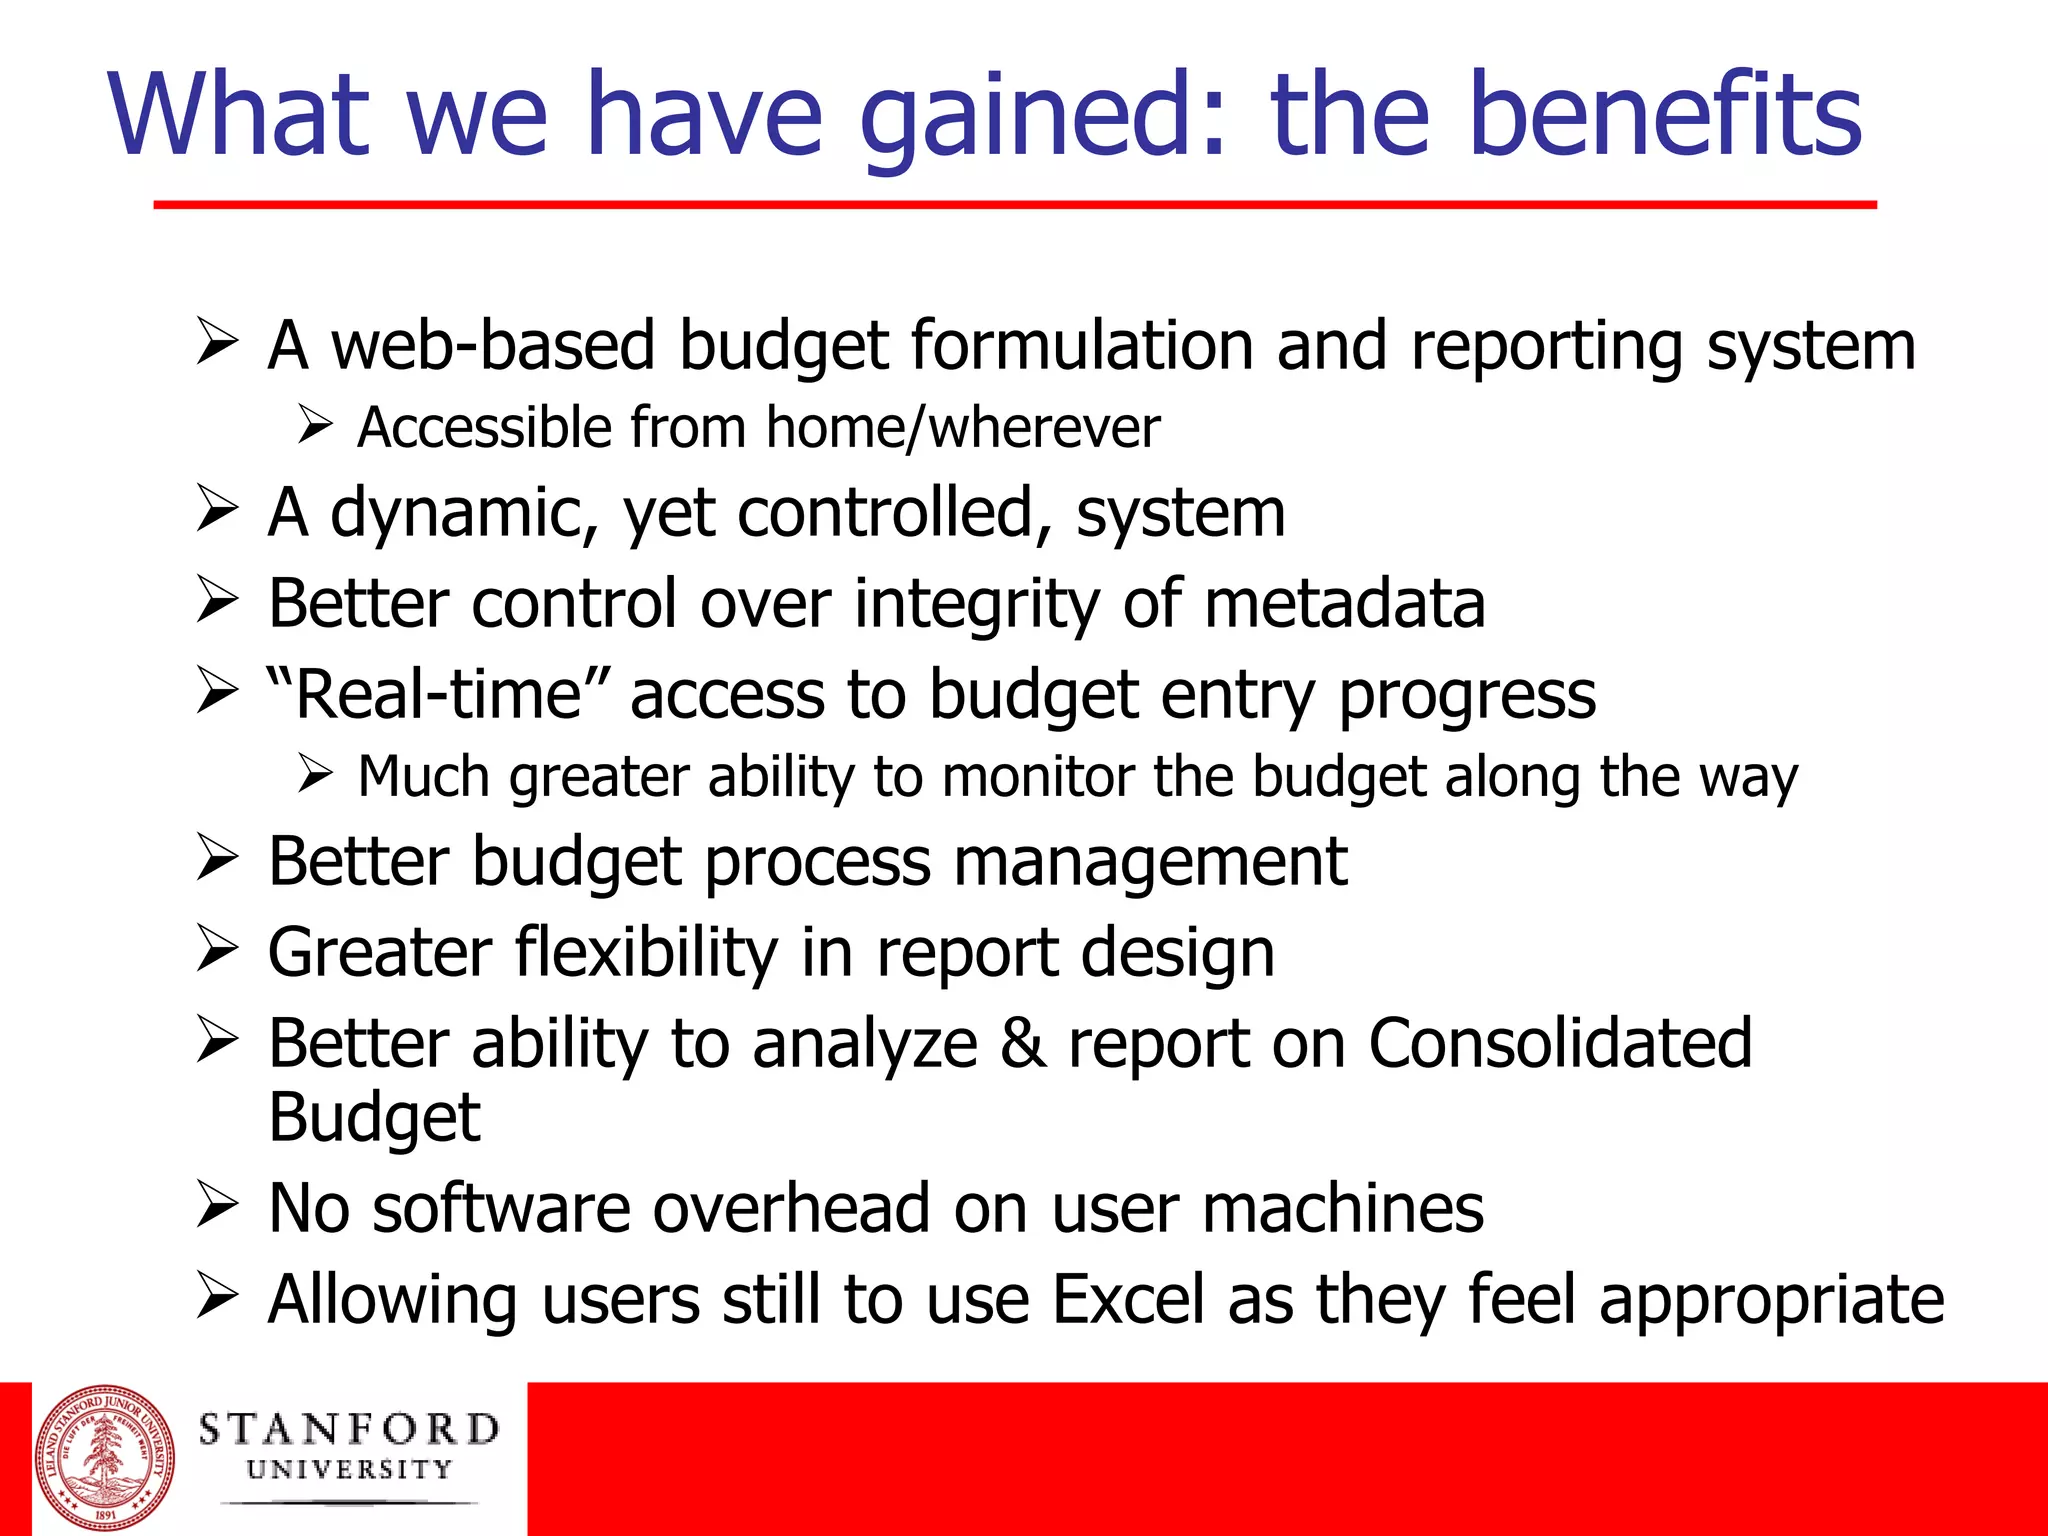
- The system provides discipline, analytical capabilities, and greater utility than Excel with less pain. It facilitates financial information flow between budget units and decision-makers.
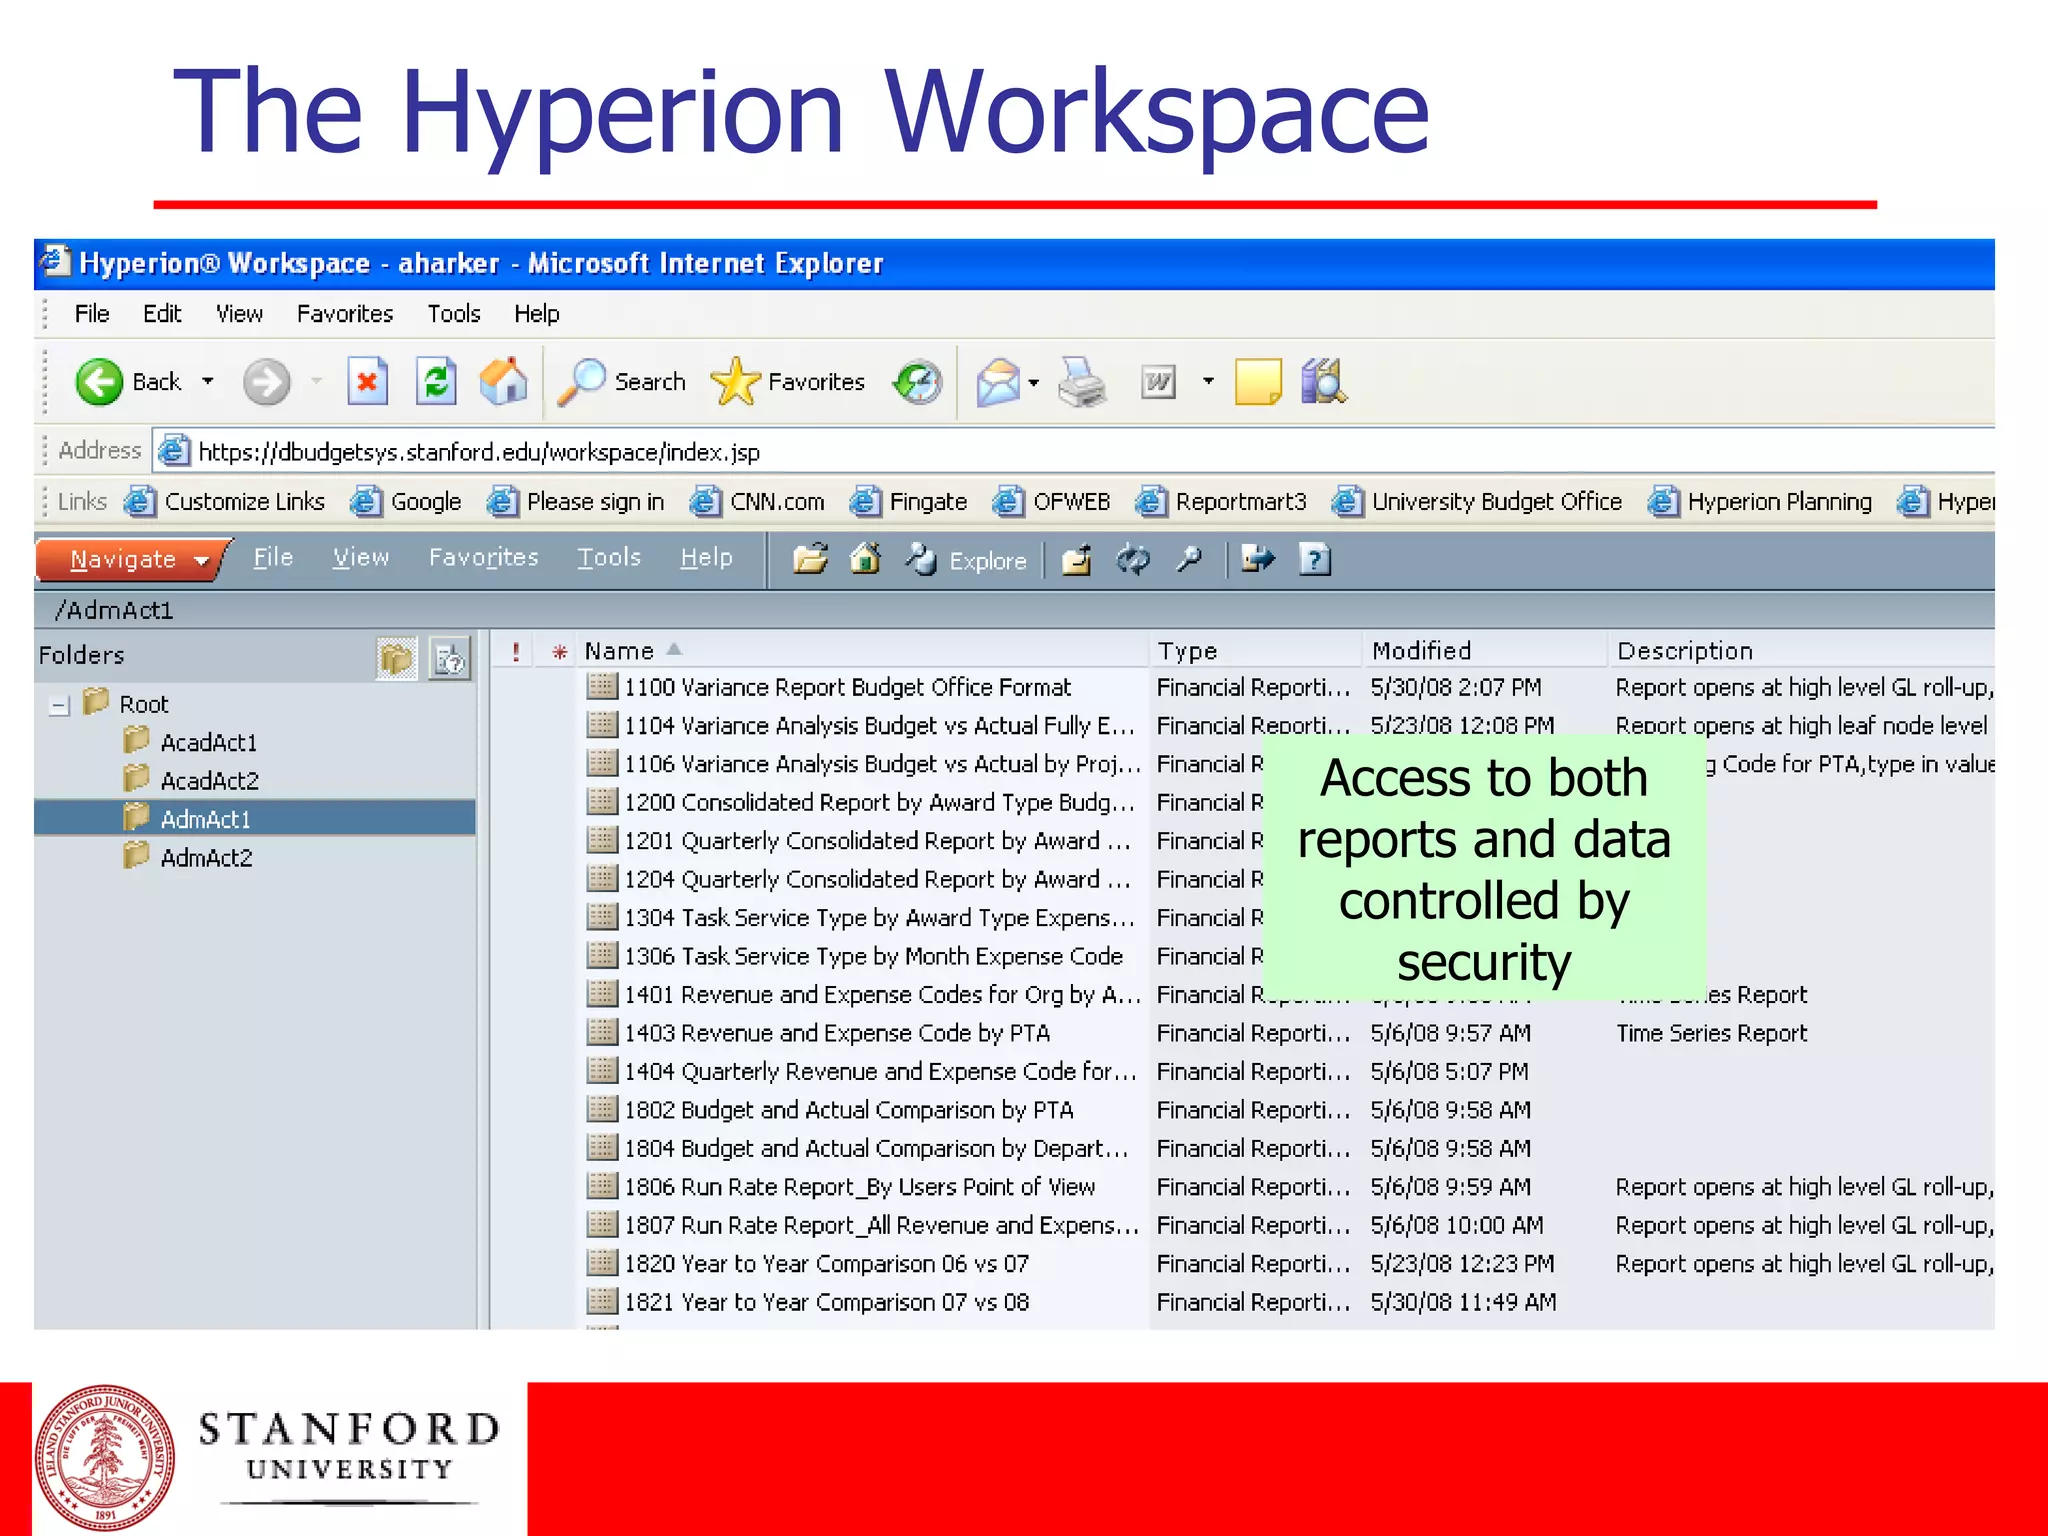
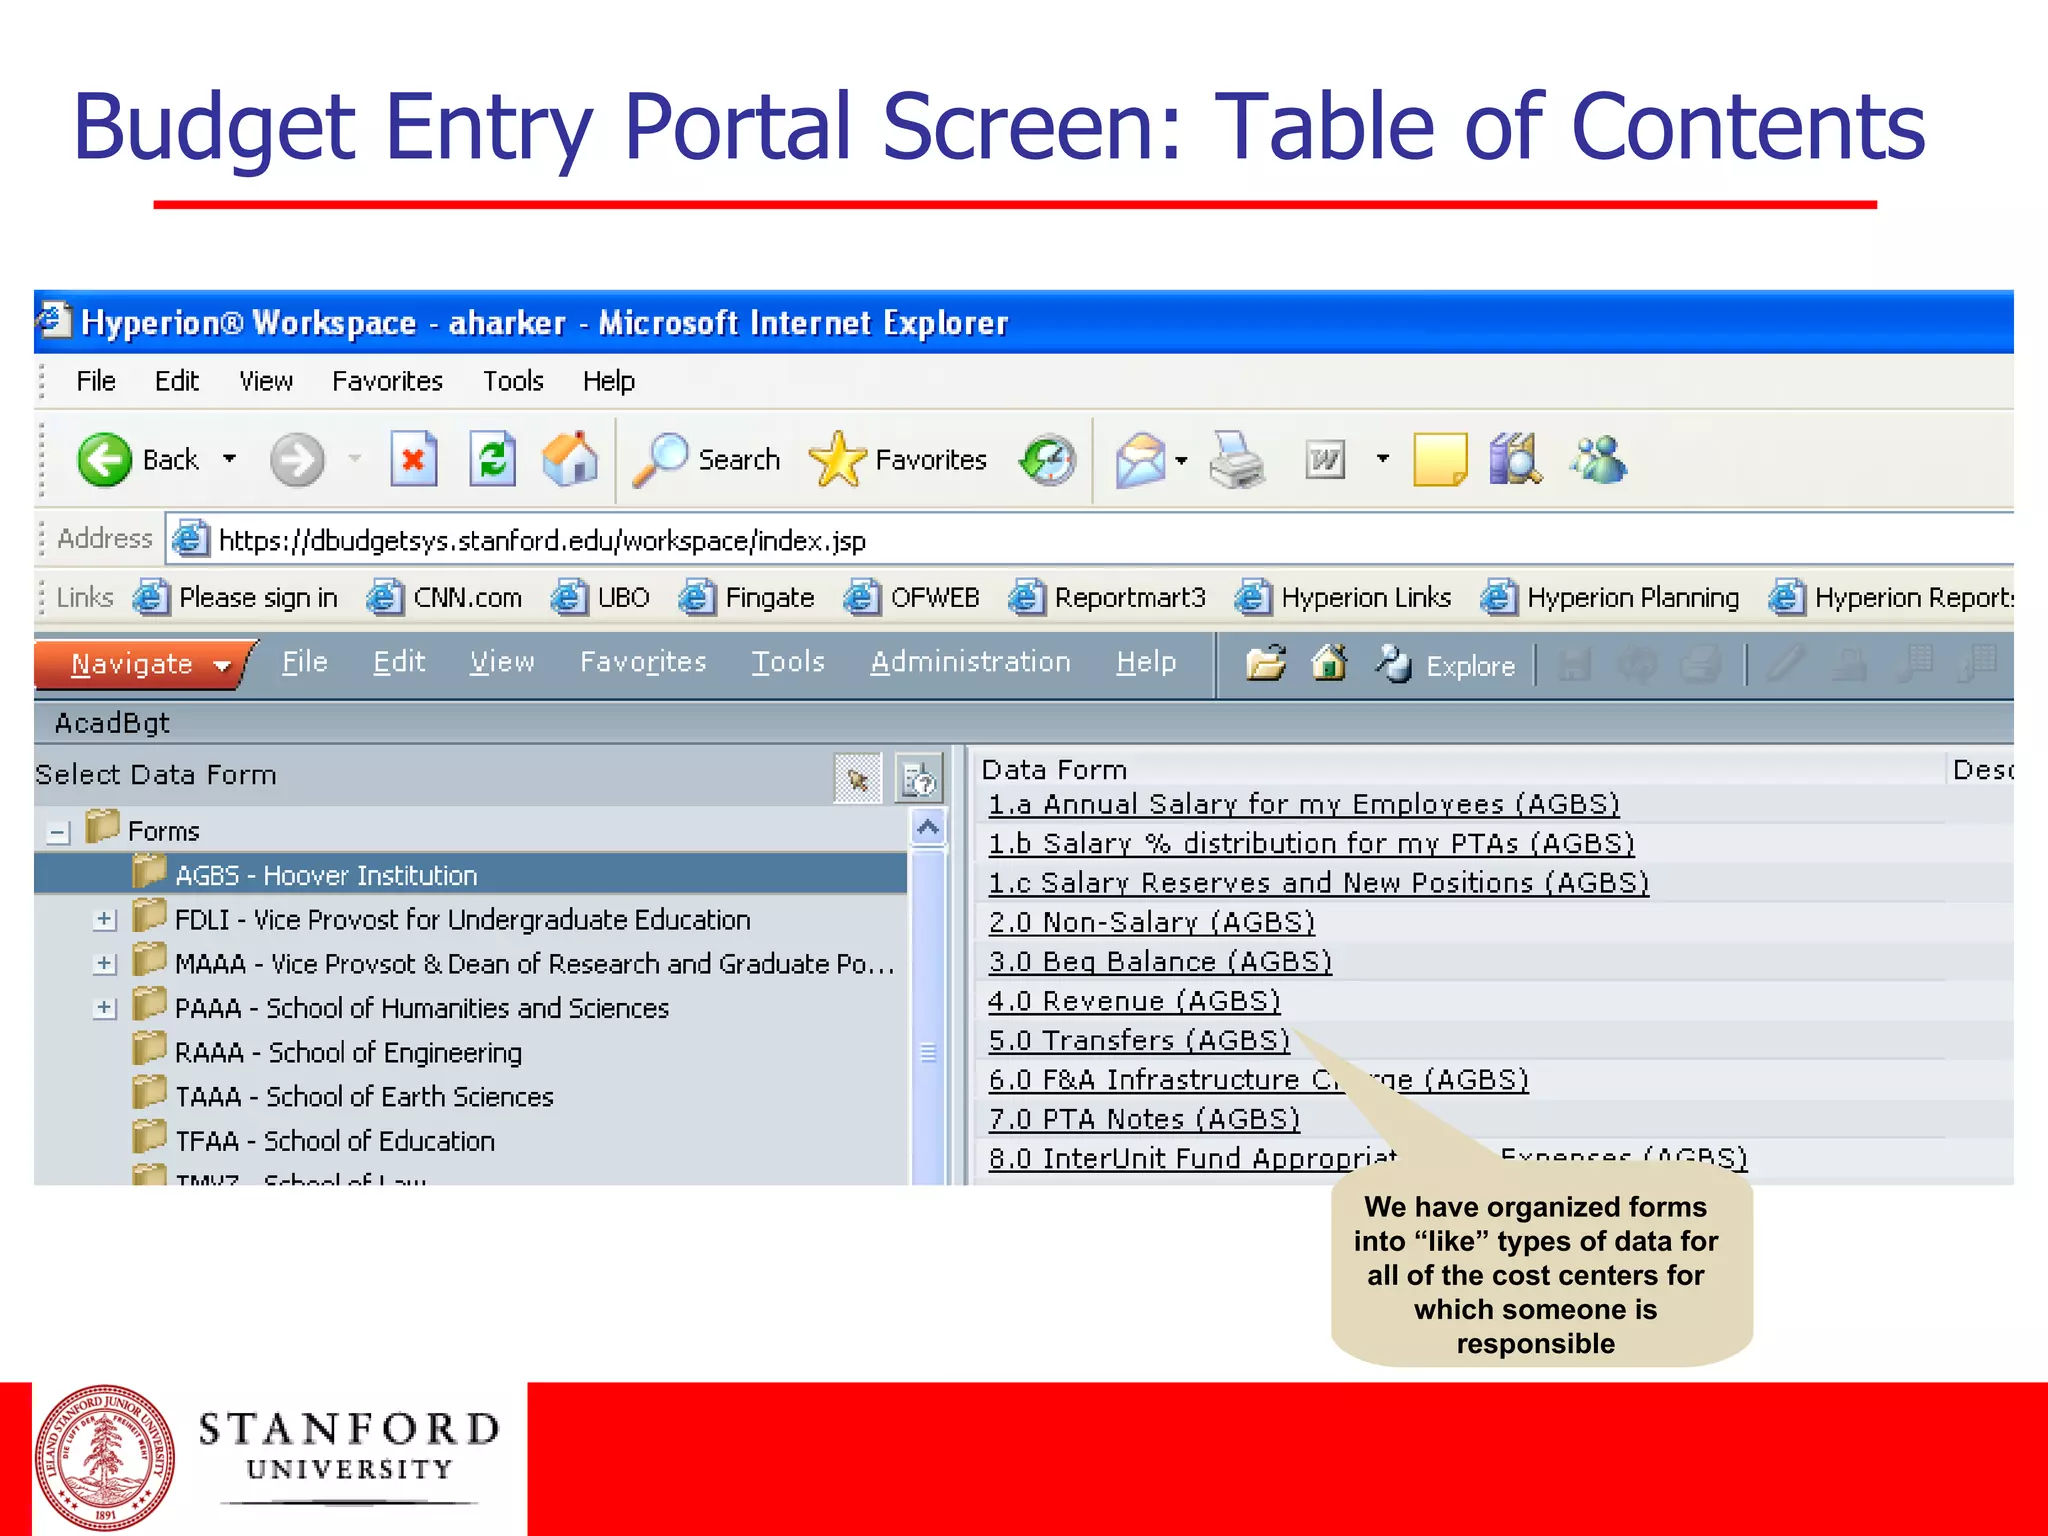
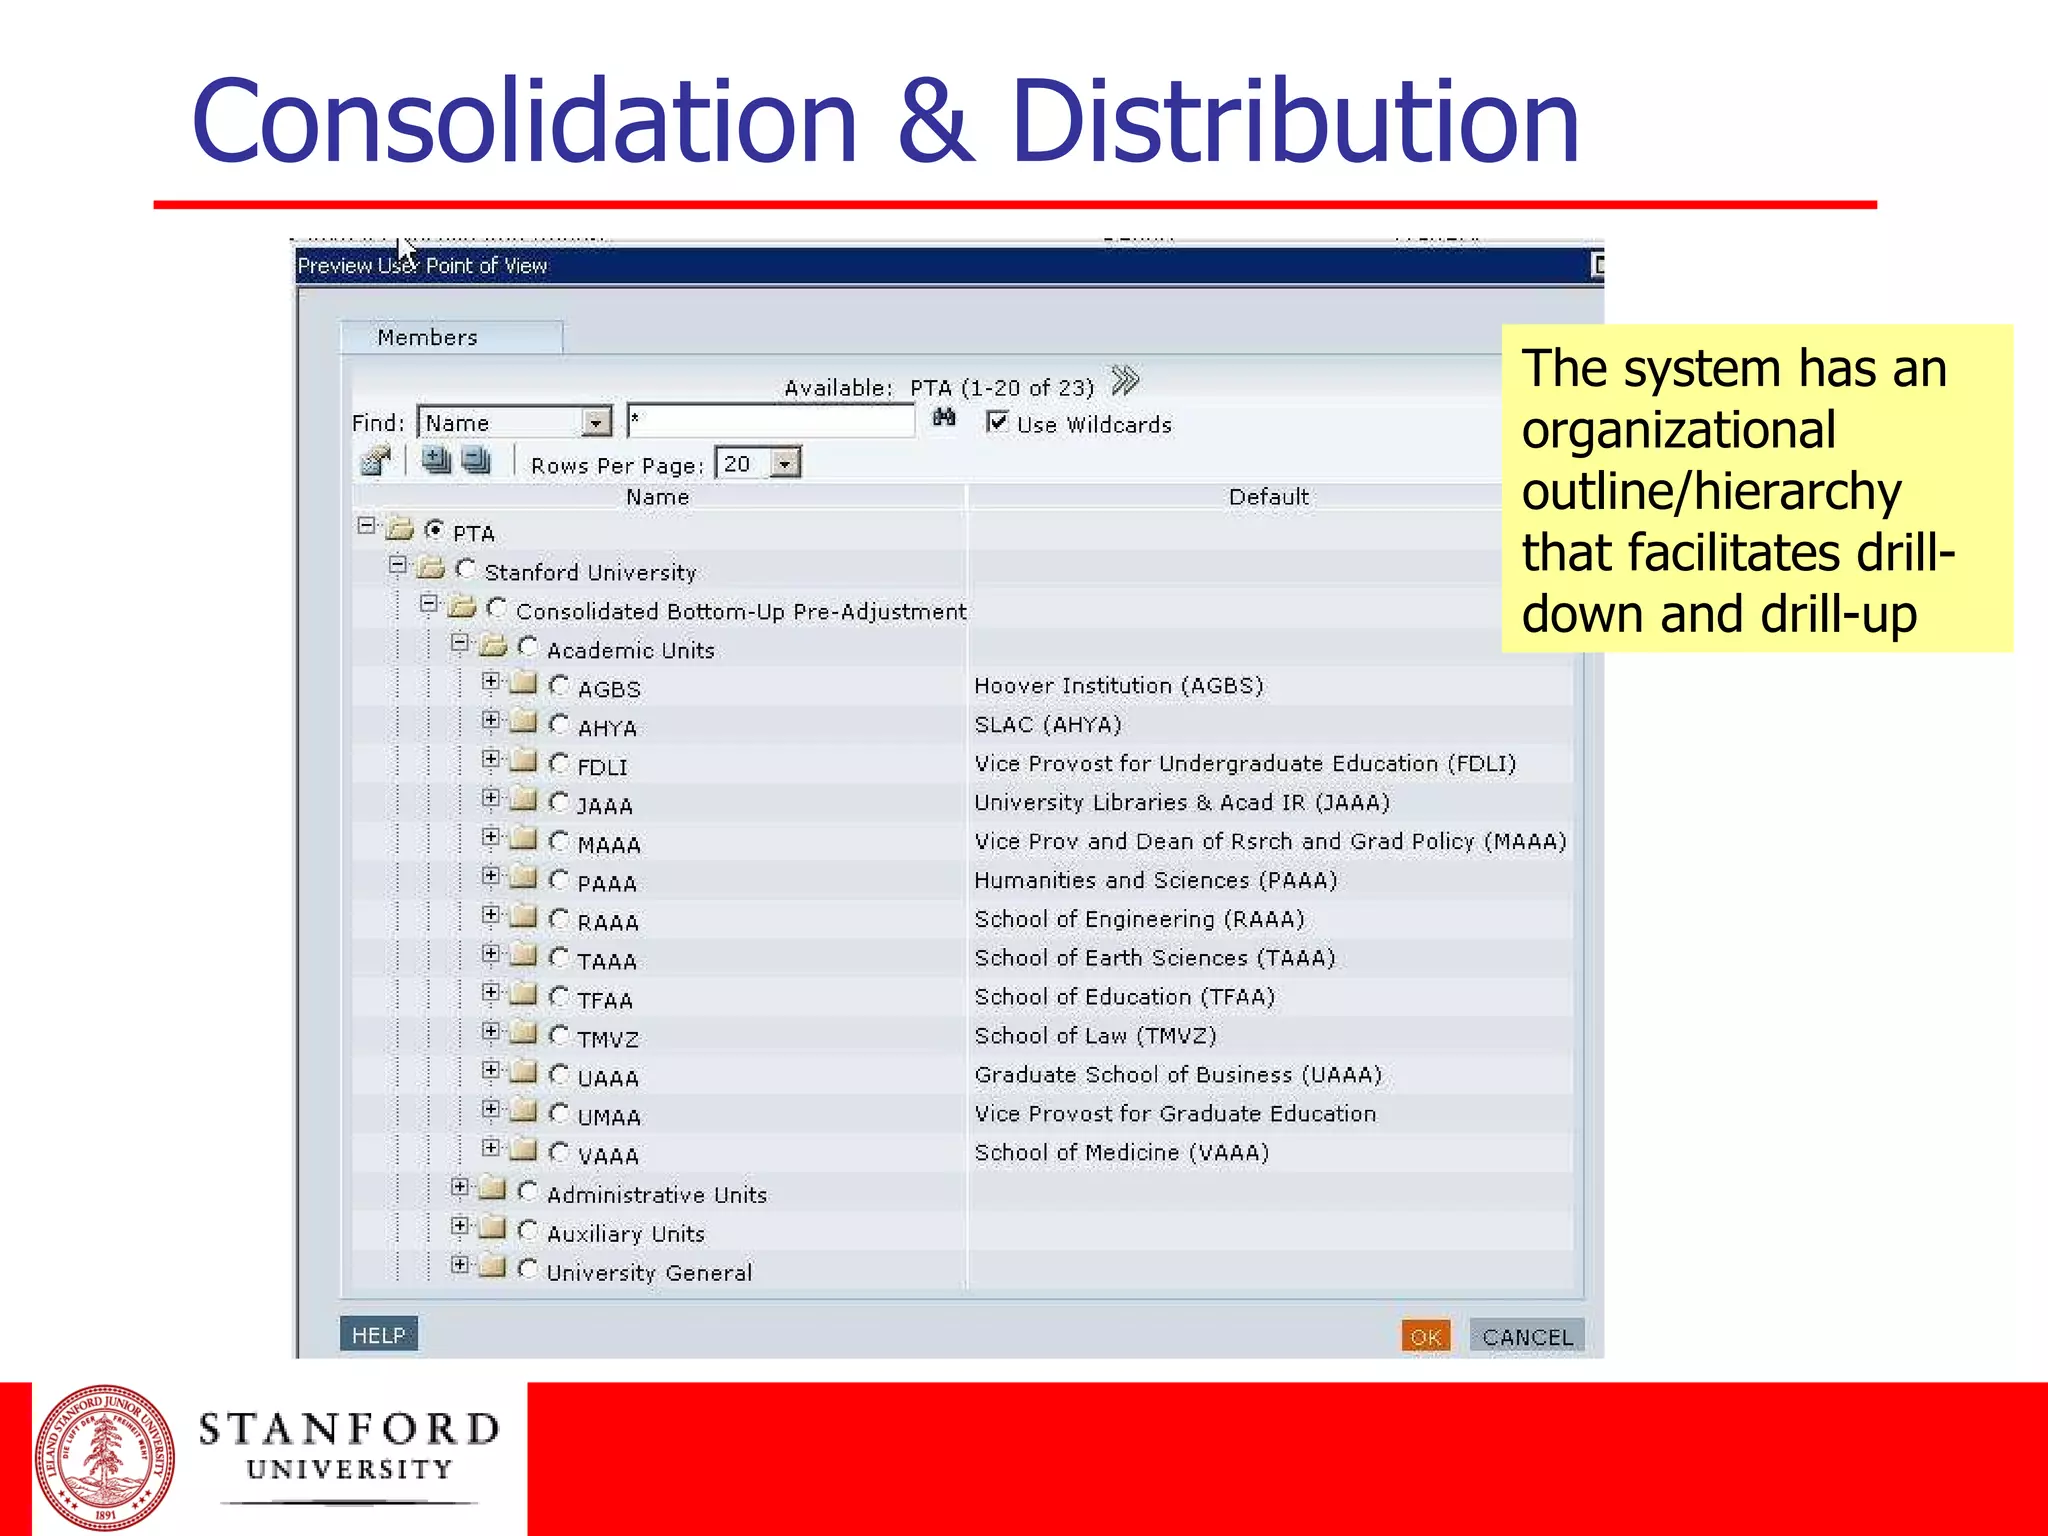
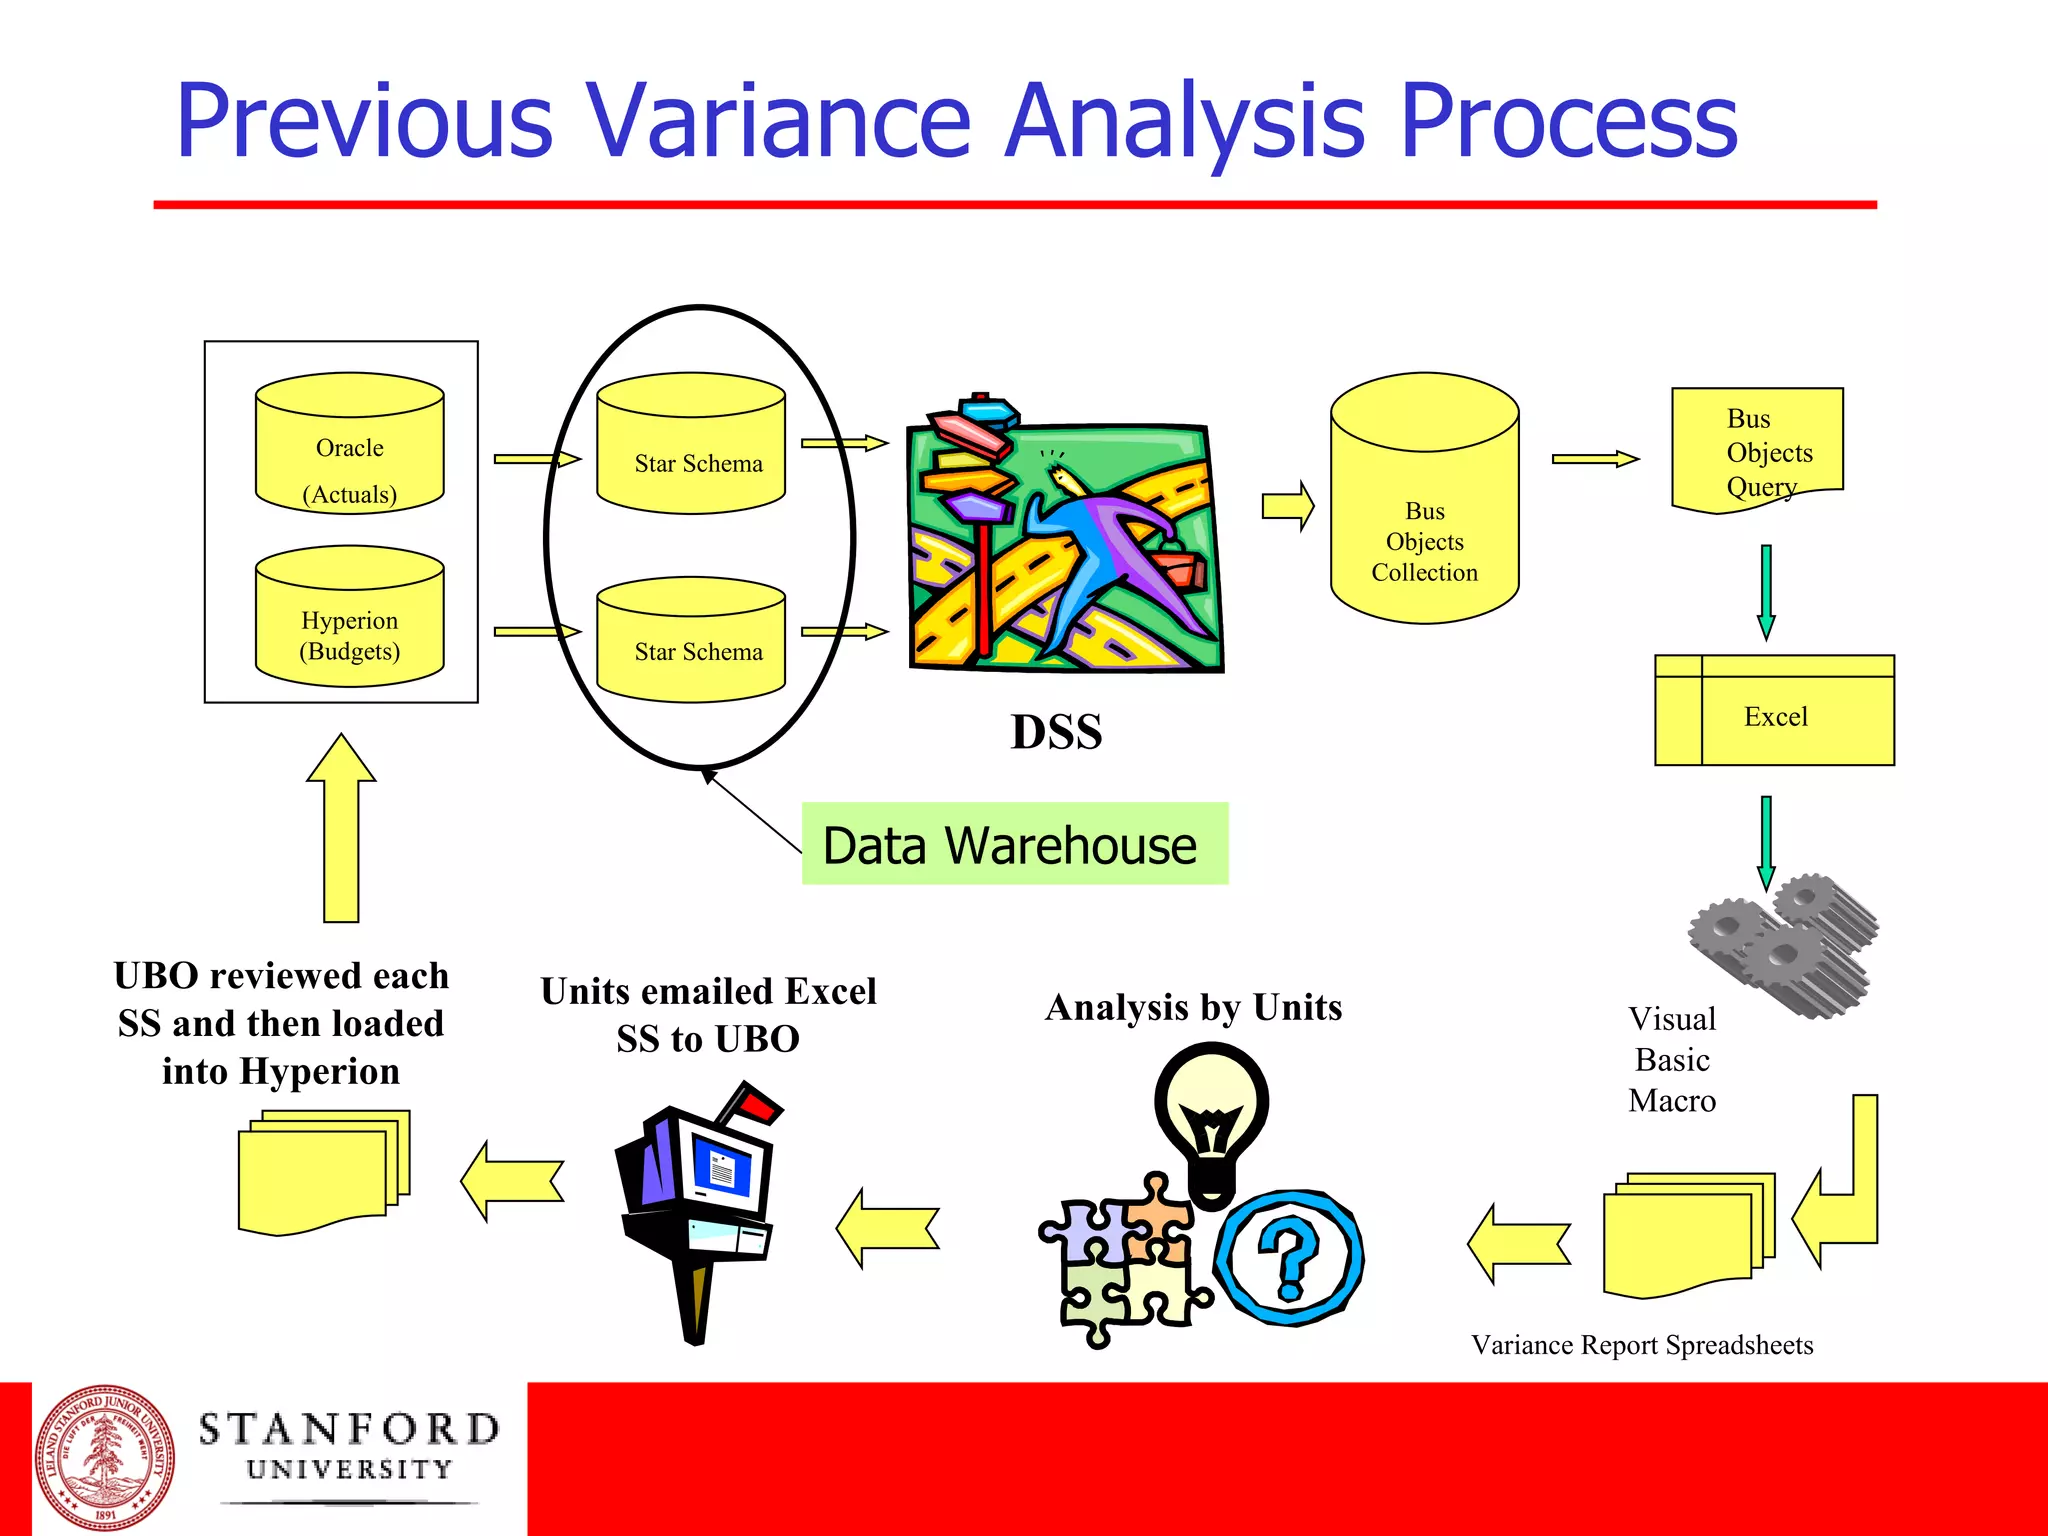
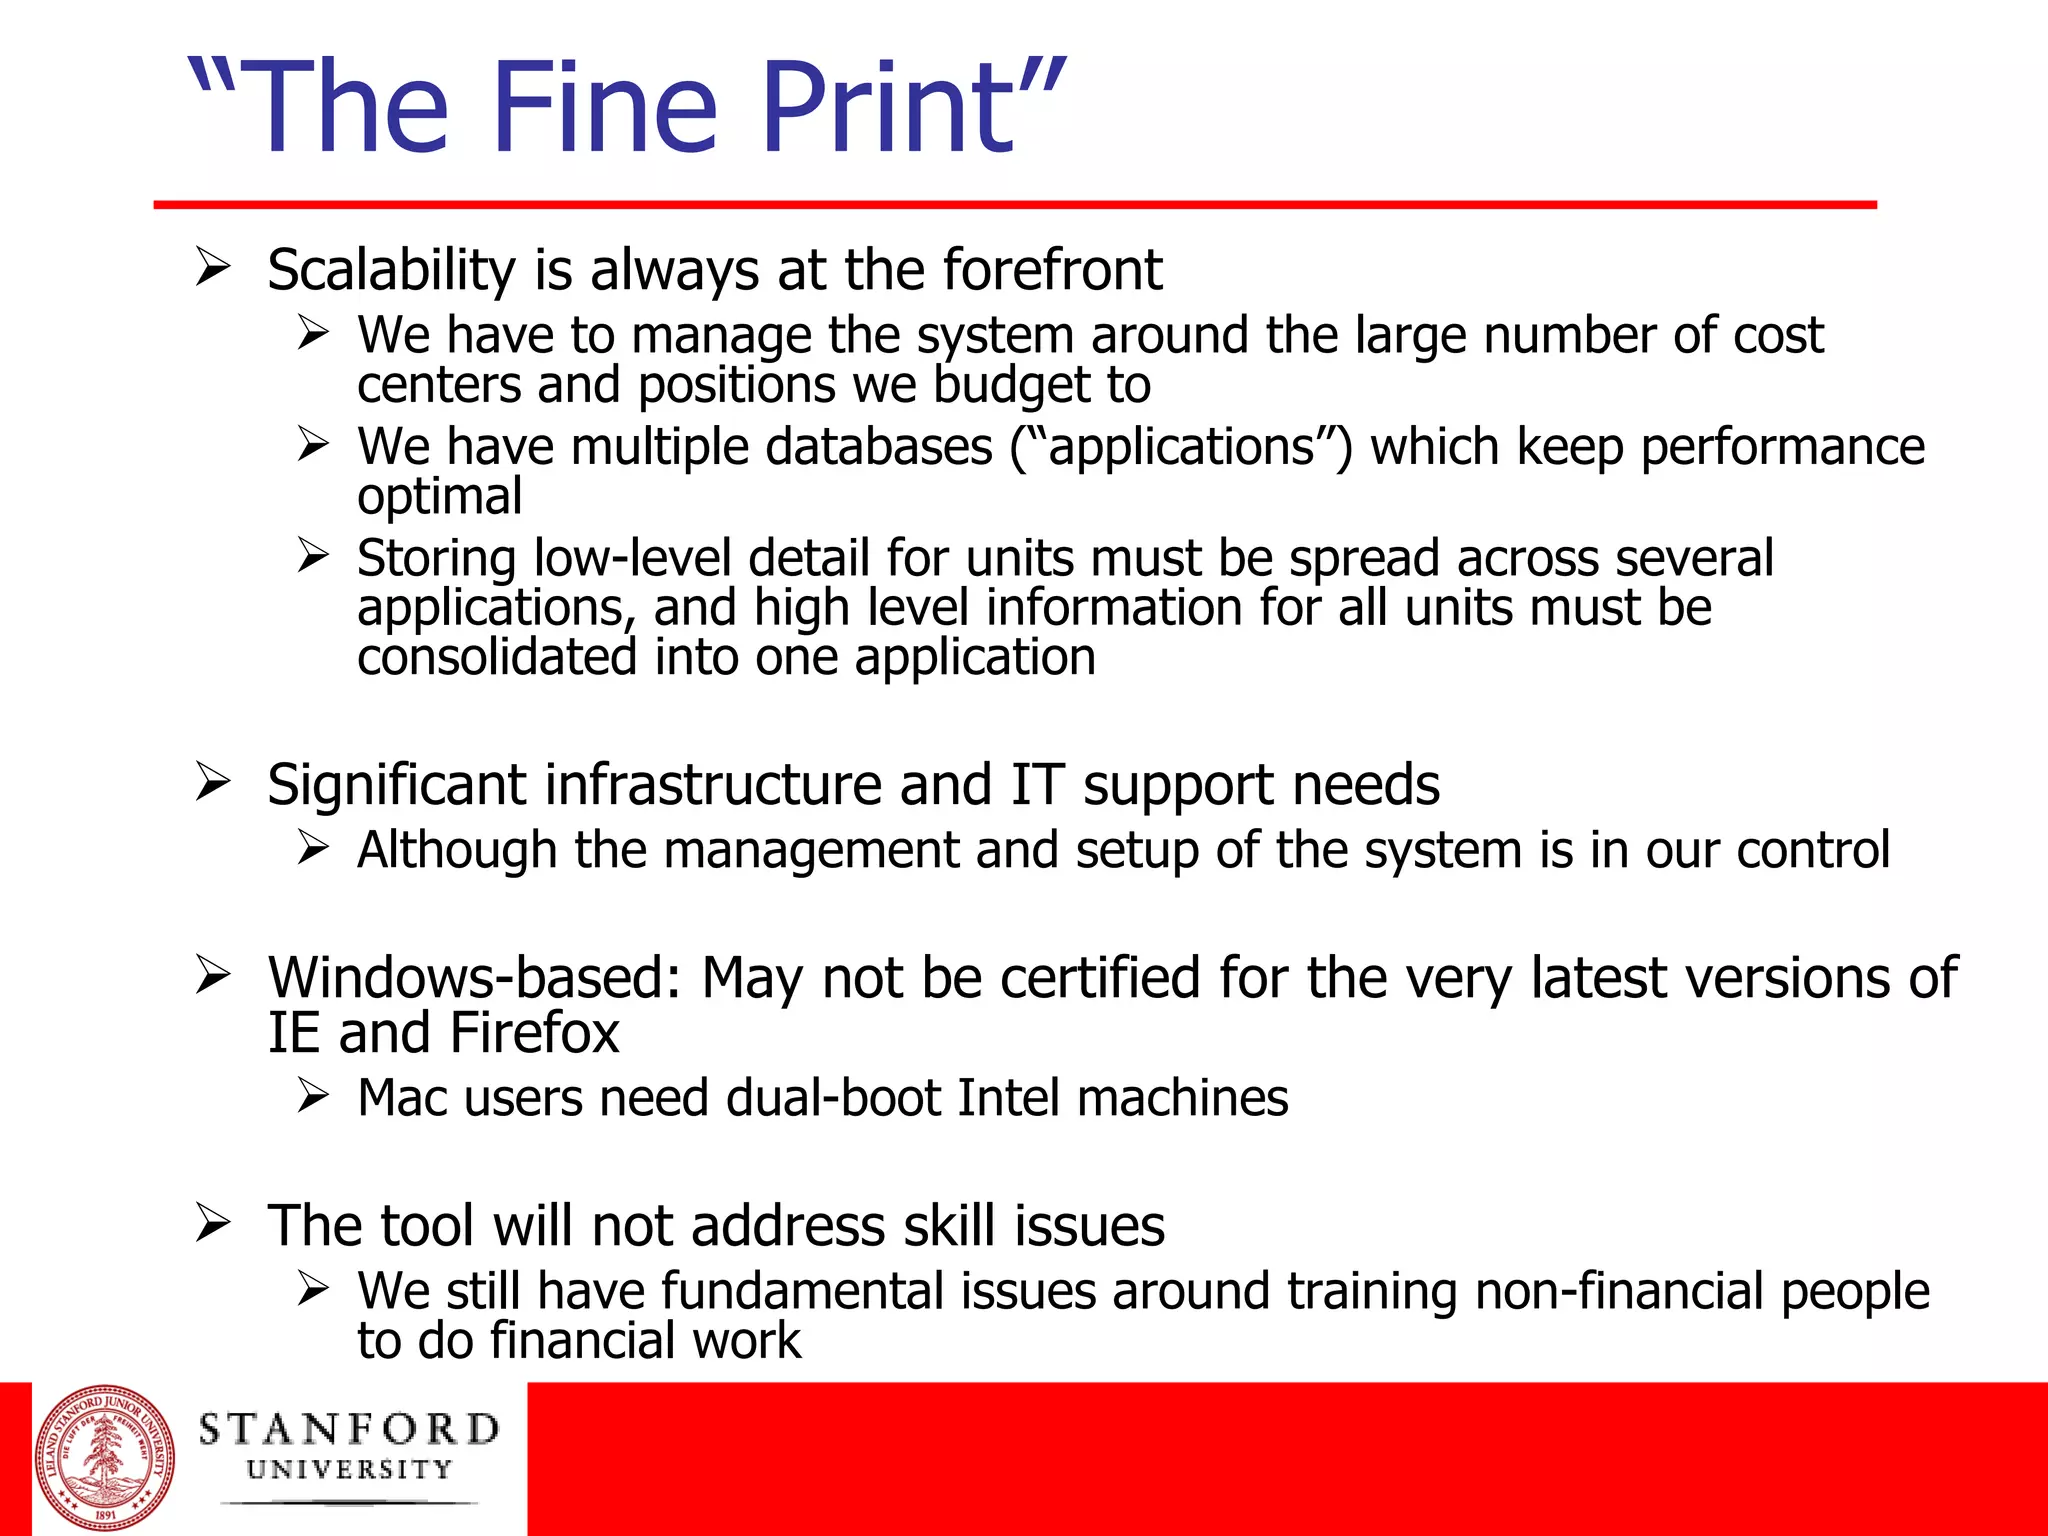
- Hyperion Planning integrates with Oracle and other systems and allows controlled, real-time access to budget data for over 350 users across many cost centers and employees.

![Contact Andrew Harker, Ed.D. Principal Ralph Harker Associates www.RalphHarkerAssociates.com Email: [email_address] +1-415-305-5844 Director of Budget Management University Budget Office Stanford University http://www.stanford.edu/dept/pres-provost/budget/hyperion/index.html E-mail: [email_address] +1-650-725-0666](https://image.slidesharecdn.com/asmibudgetmonitoringpresentation2010-12717811959962-phpapp02/75/Asmi-Budget-Monitoring-Presentation-2010-43-2048.jpg)