Download to read offline
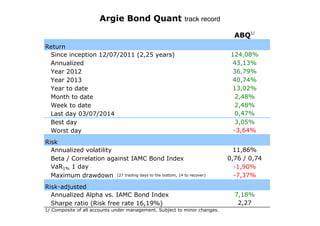
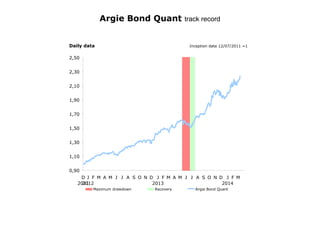
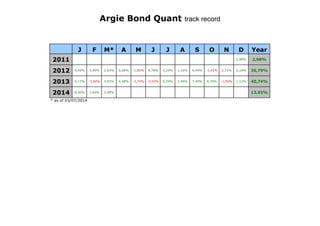

The document provides performance statistics for an investment portfolio since its inception on December 7, 2011, detailing annualized returns, maximum drawdown, and risk metrics such as volatility and Sharpe ratio. It compares the portfolio's performance against an index, highlighting a maximum drawdown of 27 trading days and recent returns through March 2014. Additionally, individual monthly performances are outlined for each year from 2011 to 2014.


