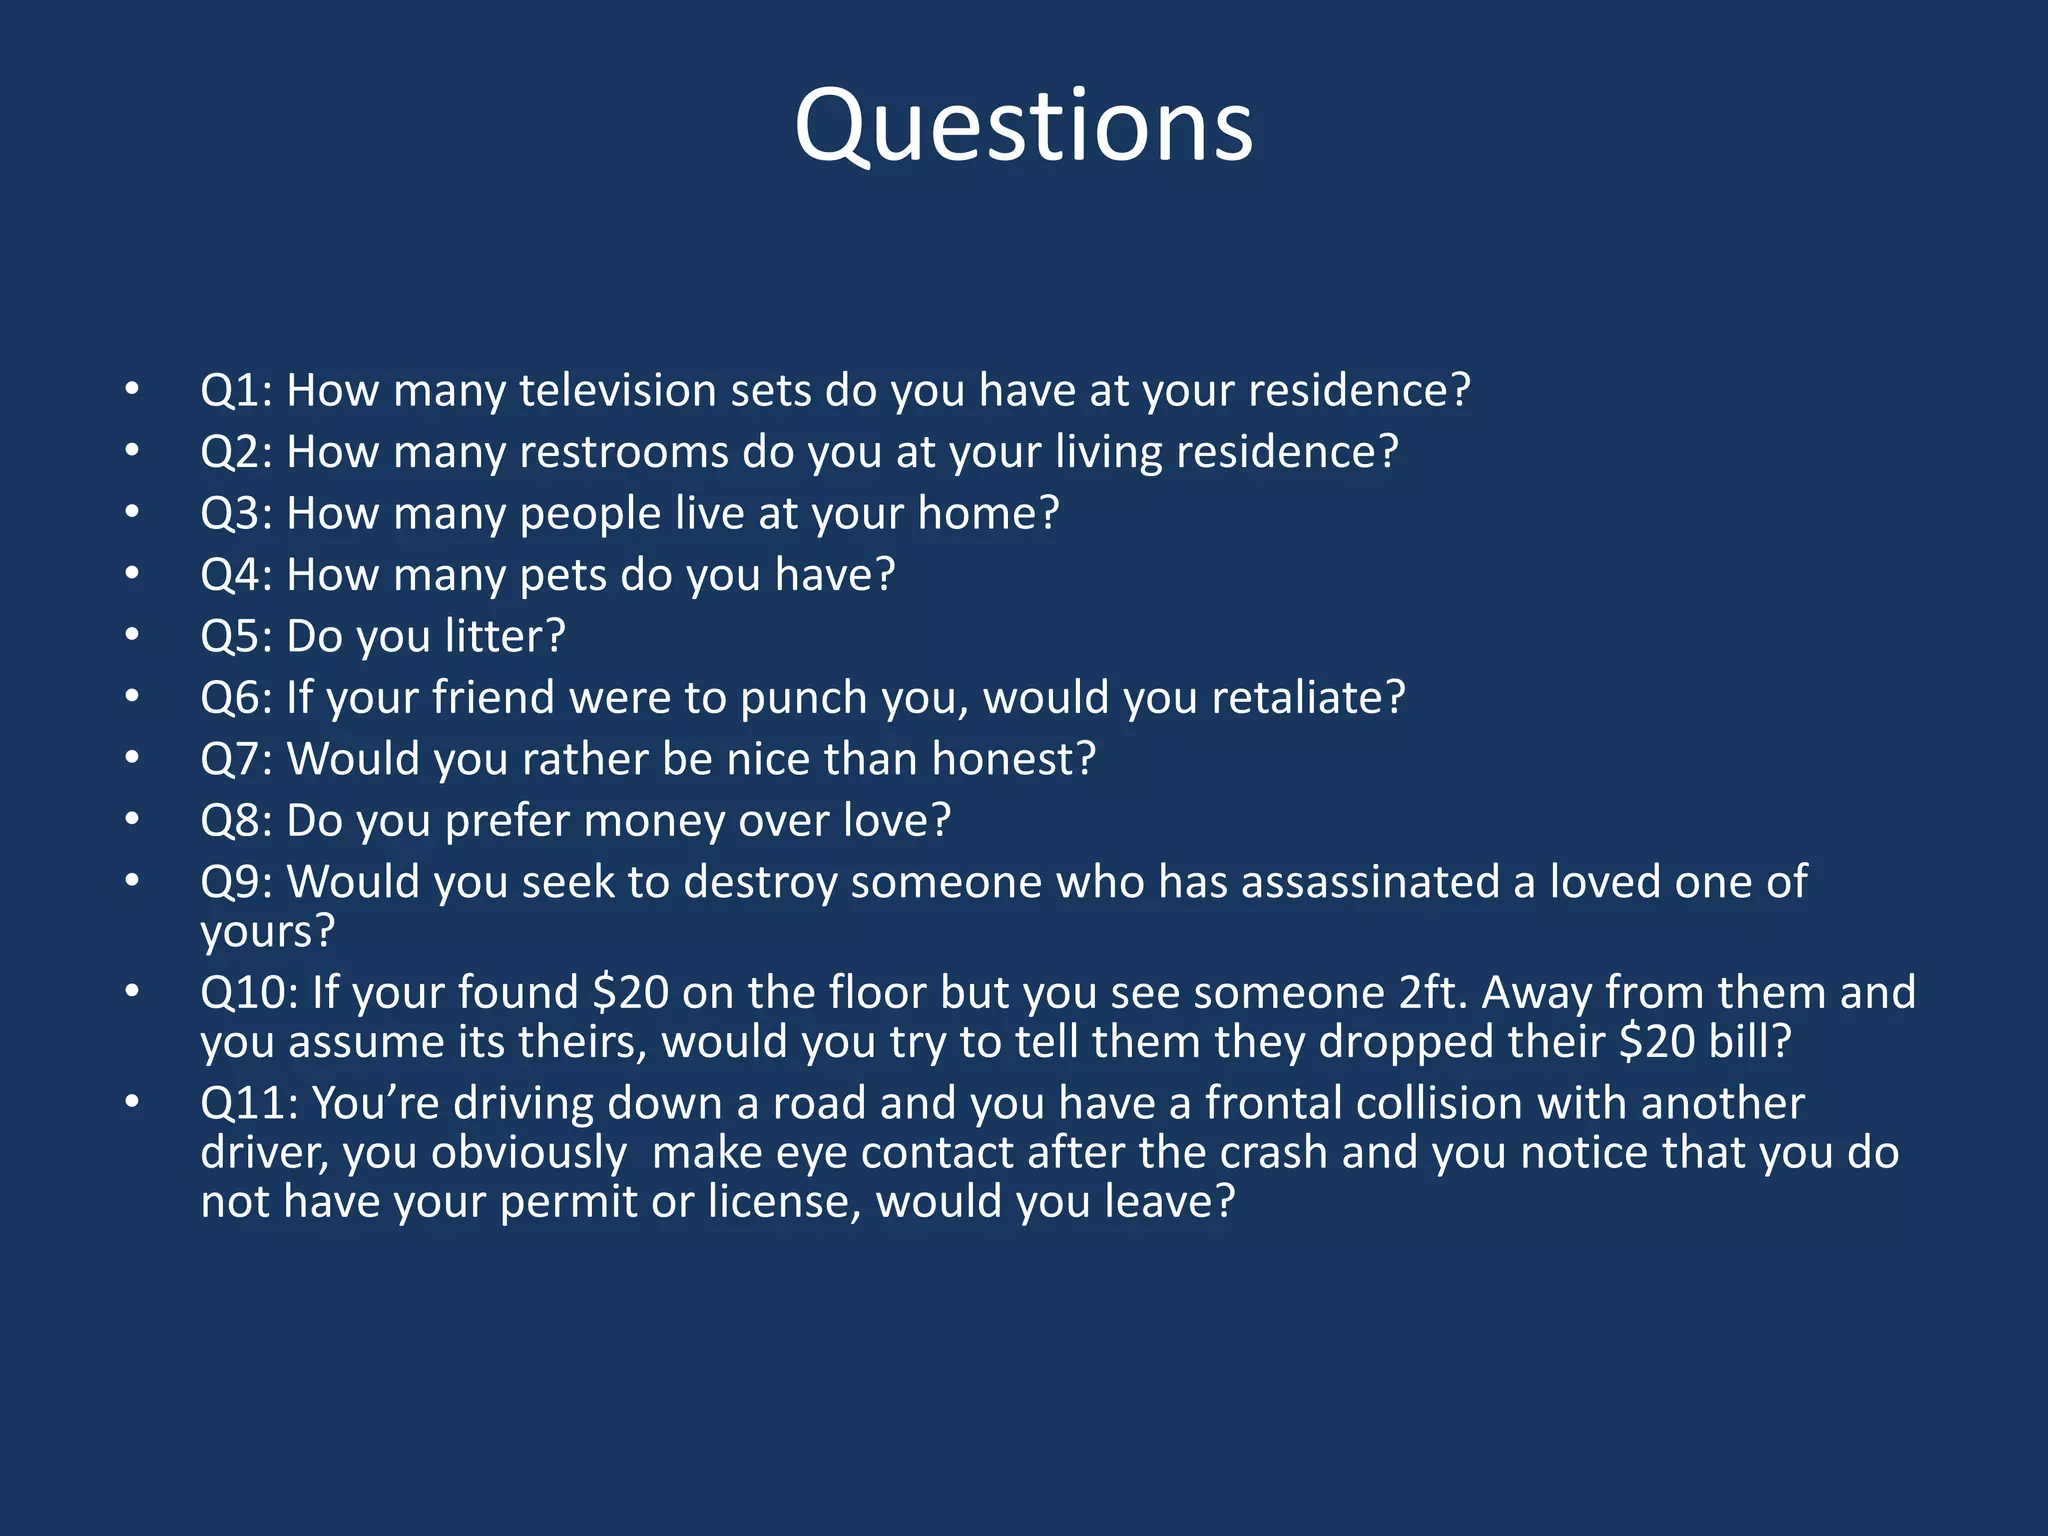
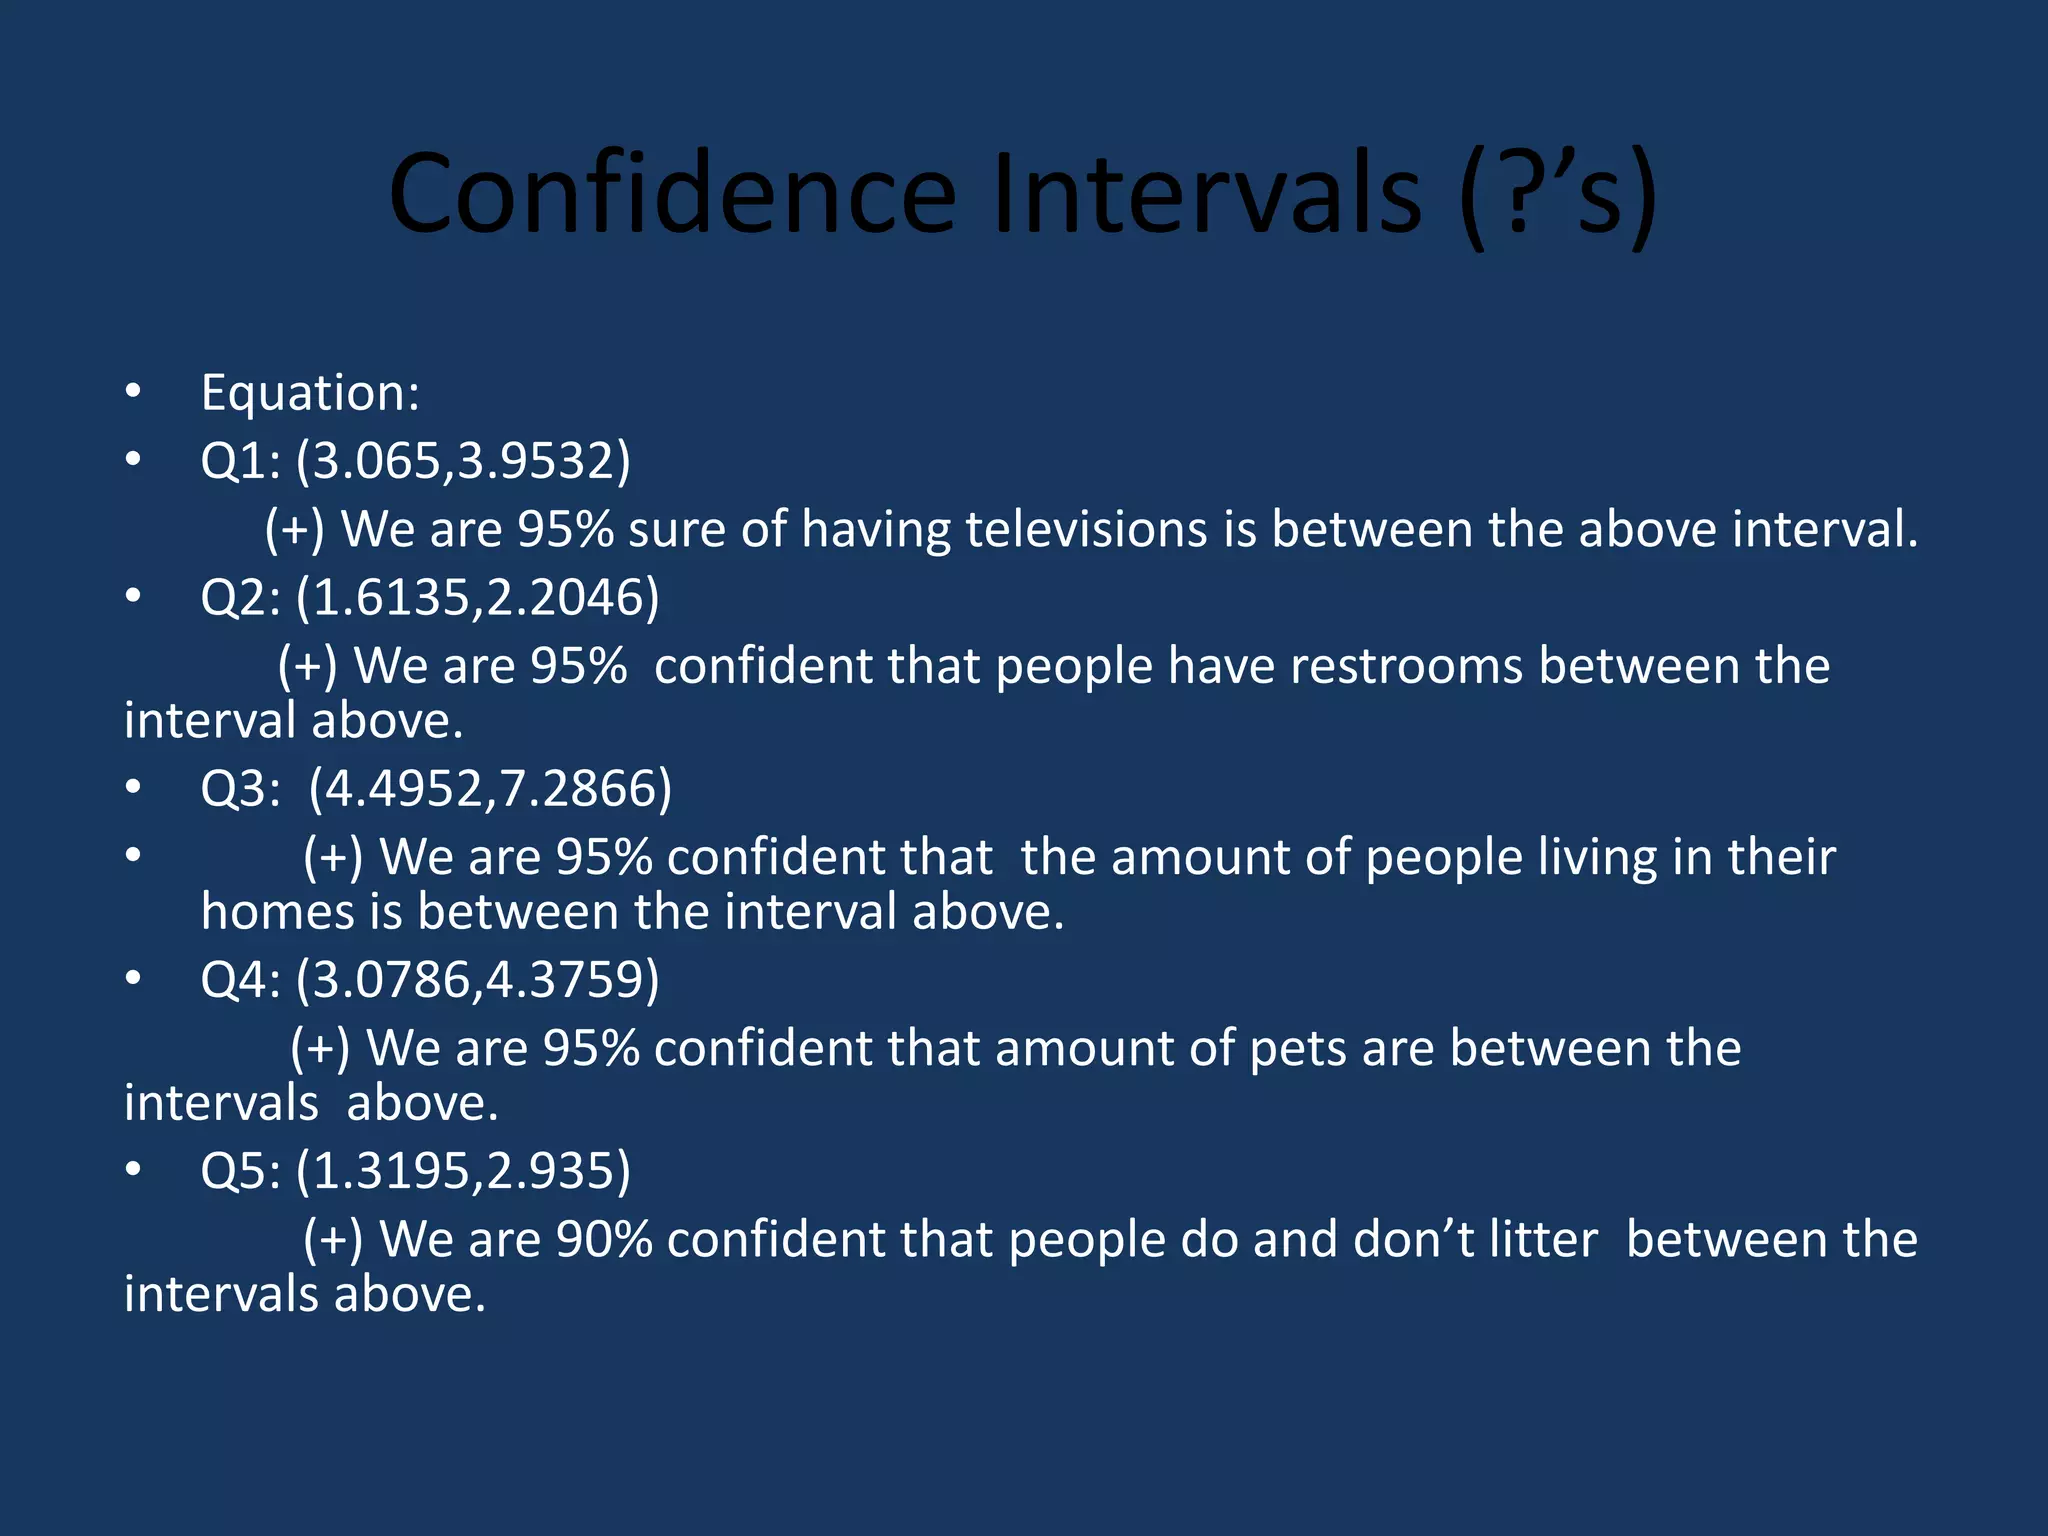
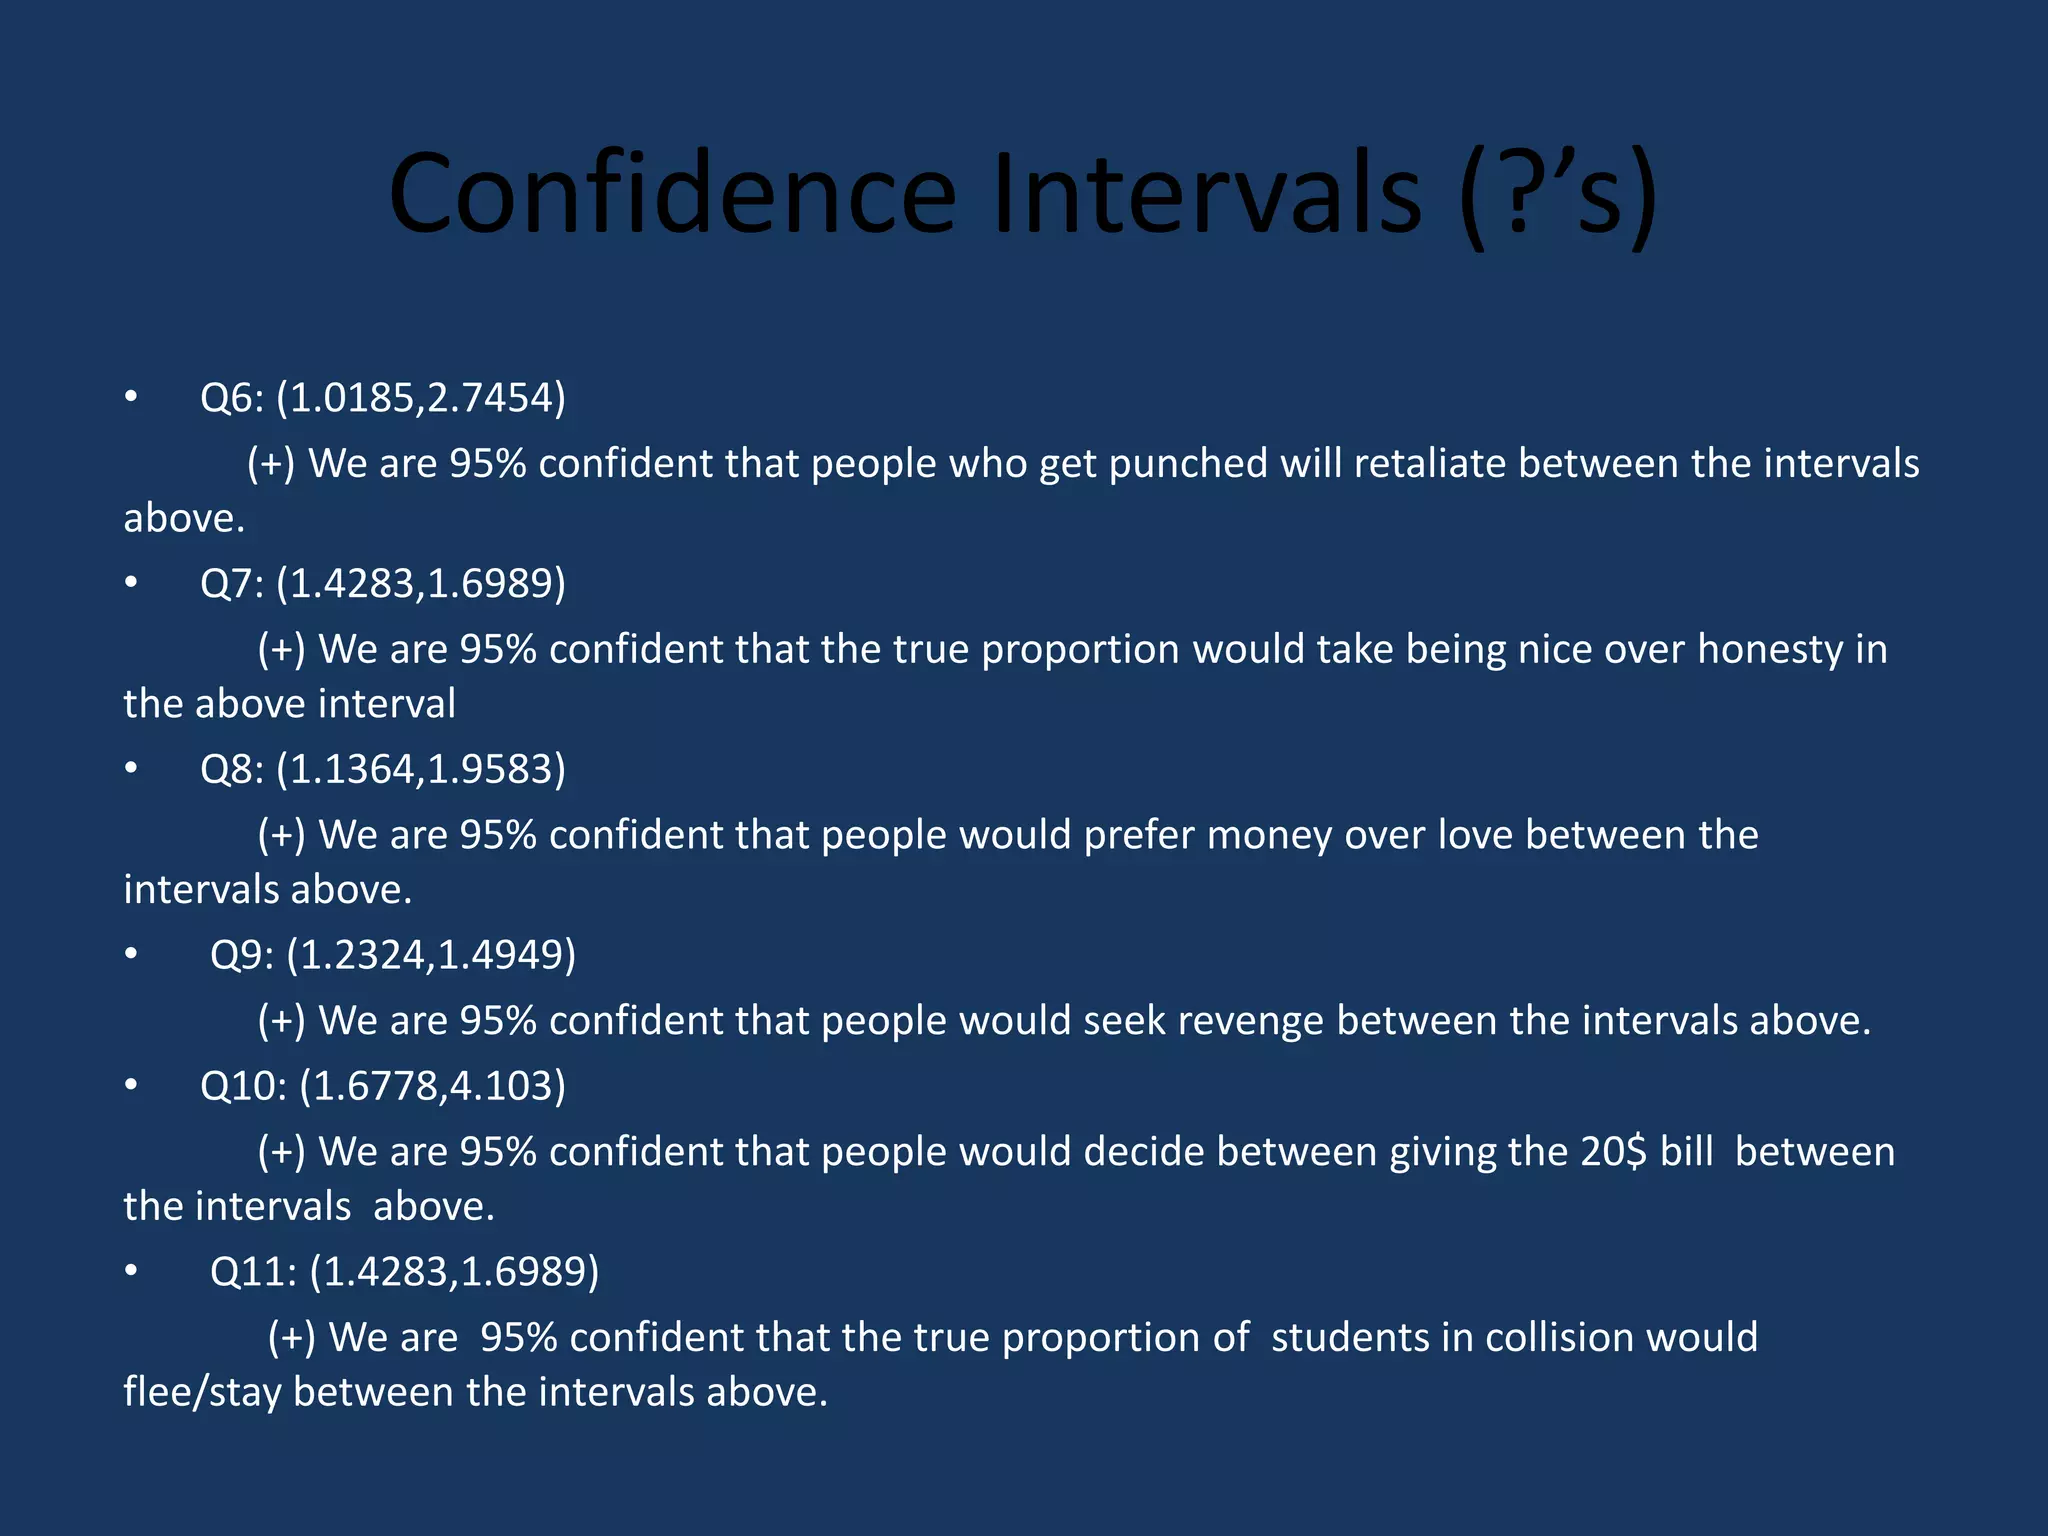
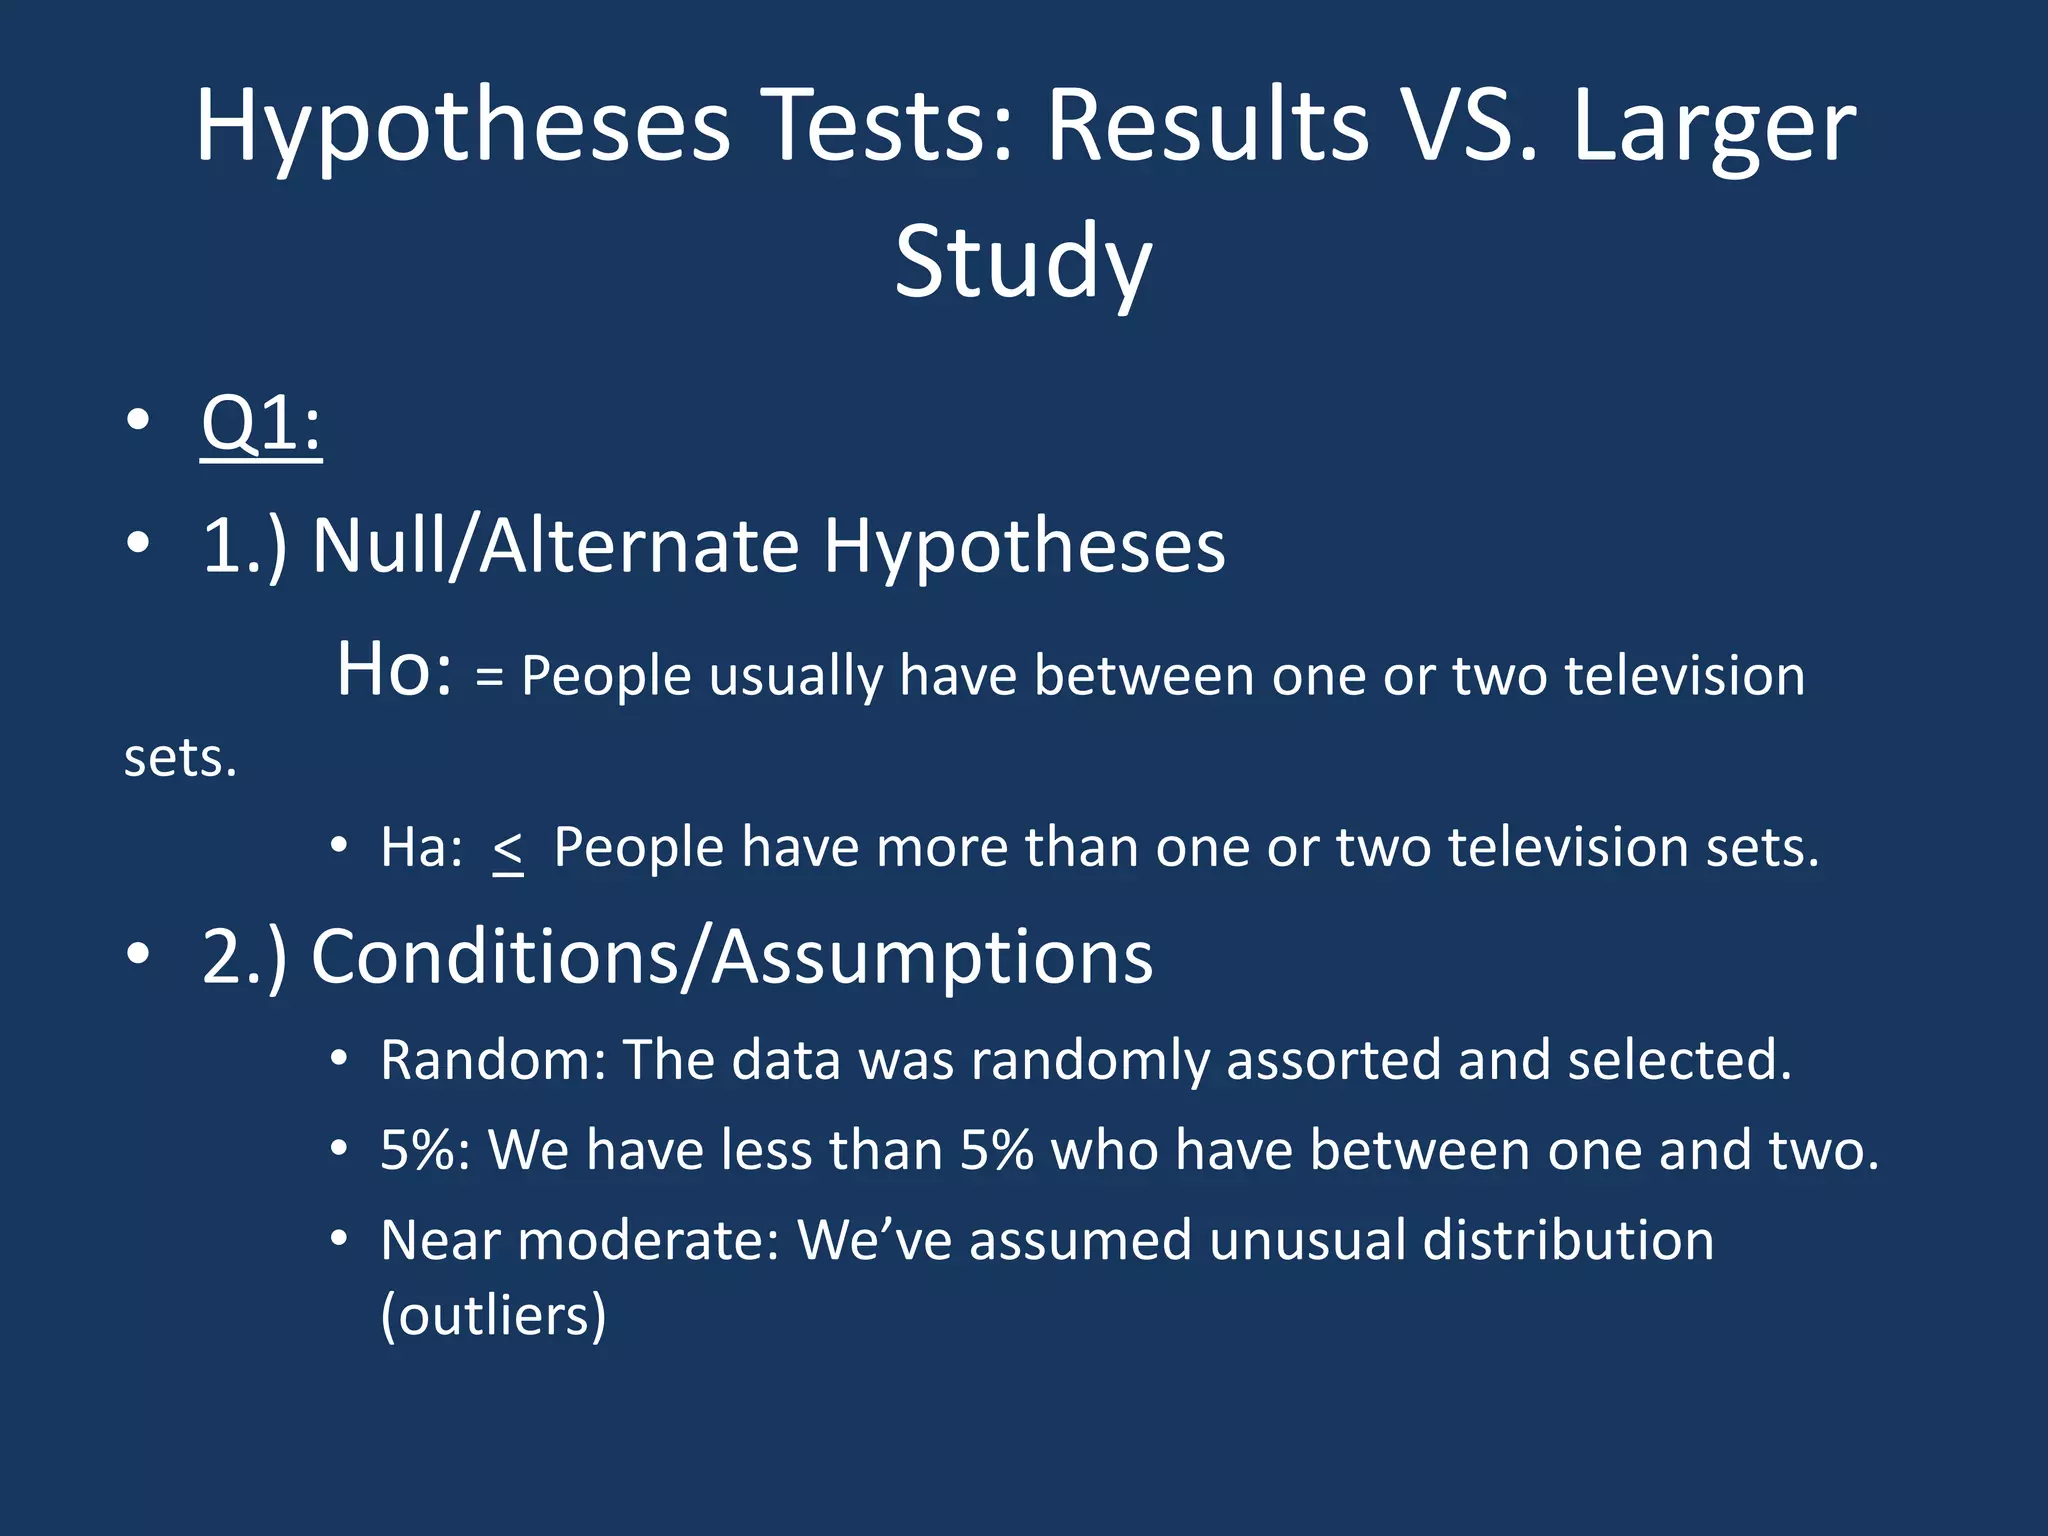
AP Stats Survey ProjectGabino SandovalSergio Ramirez Andrew MedinaAlvaro Corona
QuestionsQ1: How many television sets do you have at your residence?Q2: How many restrooms do you at your living residence?Q3: How many people live at your home?Q4: How many pets do you have?Q5: Do you litter?Q6: If your friend were to punch you, would you retaliate?Q7: Would you rather be nice than honest?Q8: Do you prefer money over love?Q9: Would you seek to destroy someone who has assassinated a loved one of yours?Q10: If your found $20 on the floor but you see someone 2ft. Away from them and you assume its theirs, would you try to tell them they dropped their $20 bill?Q11: You’re driving down a road and you have a frontal collision with another driver, you obviously  make eye contact after the crash and you notice that you do not have your permit or license, would you leave?
Confidence Intervals (?’s)Equation:Q1: (3.065,3.9532)          (+) We are 95% sure of having televisions is between the above interval.Q2: (1.6135,2.2046)            (+) We are 95%  confident that people have restrooms between the interval above.Q3:  (4.4952,7.2866)       (+) We are 95% confident that  the amount of people living in their homes is between the interval above.Q4: (3.0786,4.3759)             (+) We are 95% confident that amount of pets are between the intervals  above.Q5: (1.3195,2.935)              (+) We are 90% confident that people do and don’t litter  between the intervals above.
Confidence Intervals (?’s)Q6: (1.0185,2.7454)           (+) We are 95% confident that people who get punched will retaliate between the intervals above.Q7: (1.4283,1.6989)            (+) We are 95% confident that the true proportion would take being nice over honesty in the above intervalQ8: (1.1364,1.9583)            (+) We are 95% confident that people would prefer money over love between the intervals above. Q9: (1.2324,1.4949)            (+) We are 95% confident that people would seek revenge between the intervals above.Q10: (1.6778,4.103)             (+) We are 95% confident that people would decide between giving the 20$ bill  between the intervals  above. Q11: (1.4283,1.6989)             (+) We are  95% confident that the true proportion of  students in collision would flee/stay between the intervals above.
Hypotheses Tests: Results VS. Larger StudyQ1:1.) Null/Alternate Hypotheses          Ho: = People usually have between one or two television sets.Ha:  <  People have more than one or two television sets.2.) Conditions/AssumptionsRandom: The data was randomly assorted and selected.5%: We have less than 5% who have between one and two.Near moderate: We’ve assumed unusual distribution (outliers)
Hypotheses tests: results vs. larger studyQ3:1) null/ alternative hypothesesHo= an average of 4-5 people liver per householdHa: In our studies an average of 5 people live per household2) condition/ assumptionsRandom: the data was randomly assorted and selected10% : we have about less than 10% who have more than 5 people living in there residencyno outliers
Hypotheses Tests: Results VS. Larger StudyQ4:1) null/ alternative hypothesesHo= an average of 3 pets are held per householdHa: in our studies an average of 2 pets are held per household 2) condition/ assumptionsrandom: the data was randomly assorted and selected60%: about 60% percent didn’t have 3 petsWe had a outlier
Hypotheses tests: results vs. larger studyQ5:1) Null/ alternate hypothesesHo: 100% of Americans litterHa: 65% said that they DON’T litter and 34% said they DO litter2) condition/ assumptionRandom: the data was randomly and assorted65%: 65% said they didn’t litter in our studies, and in professional studies states that 100% of Americans litter
Hypotheses Tests: Results VS. Larger StudyQ7:1) null/alternative hypothesesHo: 66% of people would rather be nice than honestHa: 44% of people would rather be nice than honest in our studies2) condition/ assumptionsRandom: the data was randomly and assorted55%: 55% of people would rather be honest than nice
Q5: Do you Liter?ObservedExpectedYes               NoYes               NoFreshmanSophomoreJuniorSenior
Q7: Would you rather be nice than honestObservedExpectedYes            NoYes         NoFreshmanSophomoreJuniorSenior
THANK YOU FOR ALL YOU’VE DONE FOR US EASTVEDT!

Ap stats survey project

  • 1.
    AP Stats SurveyProjectGabino SandovalSergio Ramirez Andrew MedinaAlvaro Corona
  • 2.
    QuestionsQ1: How manytelevision sets do you have at your residence?Q2: How many restrooms do you at your living residence?Q3: How many people live at your home?Q4: How many pets do you have?Q5: Do you litter?Q6: If your friend were to punch you, would you retaliate?Q7: Would you rather be nice than honest?Q8: Do you prefer money over love?Q9: Would you seek to destroy someone who has assassinated a loved one of yours?Q10: If your found $20 on the floor but you see someone 2ft. Away from them and you assume its theirs, would you try to tell them they dropped their $20 bill?Q11: You’re driving down a road and you have a frontal collision with another driver, you obviously make eye contact after the crash and you notice that you do not have your permit or license, would you leave?
  • 3.
    Confidence Intervals (?’s)Equation:Q1:(3.065,3.9532) (+) We are 95% sure of having televisions is between the above interval.Q2: (1.6135,2.2046) (+) We are 95% confident that people have restrooms between the interval above.Q3: (4.4952,7.2866) (+) We are 95% confident that the amount of people living in their homes is between the interval above.Q4: (3.0786,4.3759) (+) We are 95% confident that amount of pets are between the intervals above.Q5: (1.3195,2.935) (+) We are 90% confident that people do and don’t litter between the intervals above.
  • 4.
    Confidence Intervals (?’s)Q6:(1.0185,2.7454) (+) We are 95% confident that people who get punched will retaliate between the intervals above.Q7: (1.4283,1.6989) (+) We are 95% confident that the true proportion would take being nice over honesty in the above intervalQ8: (1.1364,1.9583) (+) We are 95% confident that people would prefer money over love between the intervals above. Q9: (1.2324,1.4949) (+) We are 95% confident that people would seek revenge between the intervals above.Q10: (1.6778,4.103) (+) We are 95% confident that people would decide between giving the 20$ bill between the intervals above. Q11: (1.4283,1.6989) (+) We are 95% confident that the true proportion of students in collision would flee/stay between the intervals above.
  • 5.
    Hypotheses Tests: ResultsVS. Larger StudyQ1:1.) Null/Alternate Hypotheses Ho: = People usually have between one or two television sets.Ha: < People have more than one or two television sets.2.) Conditions/AssumptionsRandom: The data was randomly assorted and selected.5%: We have less than 5% who have between one and two.Near moderate: We’ve assumed unusual distribution (outliers)
  • 6.
    Hypotheses tests: resultsvs. larger studyQ3:1) null/ alternative hypothesesHo= an average of 4-5 people liver per householdHa: In our studies an average of 5 people live per household2) condition/ assumptionsRandom: the data was randomly assorted and selected10% : we have about less than 10% who have more than 5 people living in there residencyno outliers
  • 7.
    Hypotheses Tests: ResultsVS. Larger StudyQ4:1) null/ alternative hypothesesHo= an average of 3 pets are held per householdHa: in our studies an average of 2 pets are held per household 2) condition/ assumptionsrandom: the data was randomly assorted and selected60%: about 60% percent didn’t have 3 petsWe had a outlier
  • 8.
    Hypotheses tests: resultsvs. larger studyQ5:1) Null/ alternate hypothesesHo: 100% of Americans litterHa: 65% said that they DON’T litter and 34% said they DO litter2) condition/ assumptionRandom: the data was randomly and assorted65%: 65% said they didn’t litter in our studies, and in professional studies states that 100% of Americans litter
  • 9.
    Hypotheses Tests: ResultsVS. Larger StudyQ7:1) null/alternative hypothesesHo: 66% of people would rather be nice than honestHa: 44% of people would rather be nice than honest in our studies2) condition/ assumptionsRandom: the data was randomly and assorted55%: 55% of people would rather be honest than nice
  • 10.
    Q5: Do youLiter?ObservedExpectedYes NoYes NoFreshmanSophomoreJuniorSenior
  • 11.
    Q7: Would yourather be nice than honestObservedExpectedYes NoYes NoFreshmanSophomoreJuniorSenior
  • 12.
    THANK YOU FORALL YOU’VE DONE FOR US EASTVEDT!