
Recommended
Recommended
More Related Content
Similar to Anthropometry.ppt
Similar to Anthropometry.ppt (20)
More from NehaChaudhary770095
More from NehaChaudhary770095 (10)
Recently uploaded
Recently uploaded (20)
Anthropometry.ppt
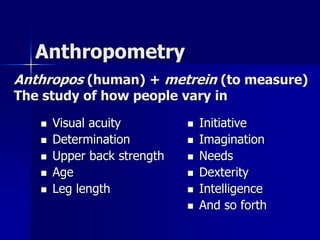
- 1. Anthropometry Initiative Imagination Needs Dexterity Intelligence And so forth Visual acuity Determination Upper back strength Age Leg length Anthropos (human) + metrein (to measure) The study of how people vary in
- 2. Engineering Anthropometry Physical body size – Static Two dimensional Three dimensional – Functional Strength – Isometric – Dynamic – isotonic, iso- kinetic, iso-inertial etc. – MVC joint torques Biomechanical / inertial properties – Segment mass – Segment center of gravity locations – Muscle attachment sites and lever arms – Failure stresses of ligaments, tendons, bones etc.
- 3. Selection vs. Job Modification Two basic strategies: – Selection—fit the person to the job. – Job modification—fit the job to the person Follow the second strategy: the key to progress has been to challenge the environment.
- 4. Exclude as Few as Possible Minimizes the number of people excluded, which tends to make the job easier for everyone Balance seriousness of exclusion with cost of inclusion
- 5. Excluded Percentile May be: – Upper (a door tall people can’t fit under) – Lower (a task requiring manual dexterity) – Both (intelligence test for factory job) Designing for the mean may exclude half the population.
- 6. Population Dimensions Define the user population. Consider the source of population dimensions – Male/female – Military/civilian – Age – Ethnicity – Occupation
- 7. Body Position Descriptions Planes – Saggital – divides the body into left and right half (medial/lateral) – Coronal – divides the body into front and back half (anterior/posterior) – Transverse – divides the body into top and bottom half (superior/inferior) Limbs – Proximal: close to torso – Distal: further from torso
- 8. Wrist/Hand Motions Flexion – closes the joint angle from neutral position. Extension – opens the joint angle from neutral position. Adduction/ abduction – opens and closes laterally
- 9. Wrist/Hand Motions Radial deviation/ulnar deviation
- 11. Body Dimensions Sample 95th percentile dimensions (cm) of nude U.S. adult civilians. Female Male Stature (height) 173.73 186.65 Eye height 162.13 174.29 Thigh height (sitting) 18.02 18.99 Forward reach 79.67 86.70 Hip breadth (sitting) 43.22 41.16 Weight (kg) 84.8 99.3
- 12. Variations in body dimensions Most body dimensions do not correlate well with stature, coefficient of determination R2 is less than 50%. So be careful when predicting other dimensions from stature. Individual segment weights are calculated from total body weight. In absence of data female may be estimated as 93% of male if no data available
- 13. Variations in Strength Females average 63% isometric strength of males. Strength of specific muscle groups varies depending on – Limb: Leg approx. 3 times strength of arm – Direction exerted: Strength may decrease by 50% – Preferred hand/arm/leg: Strength may vary by 40– 50% Left and right leg strengths do not differ appreciably.
- 14. Other Characteristics Age Personal space
- 15. Age of Workforce Birth rate is declining. Additional workers must come from immigration Longer work hours Delayed retirement Older workers must be considered.
- 16. Personal Space Intimate (0 – 18 in.) Personal (18 – 48 in.) Social (4 – 12 ft) Public (> 12 ft) Boundaries vary with gender, familiarity, and culture.
- 17. Statistical Calculations Normal distribution provides a close approximation. Mean (average) is 50th percentile. Normal distribution is symmetrical. Absolute variability given by standard deviation. Relative variability given by coefficient of variation.
- 19. Distribution Calculations To Find Percentile – Find difference from the mean (subtract). – Convert to standard units (divide by standard deviation). – Use table to find percentile.
- 20. Distribution Calculations To Find Dimension – Use table to find number of standard units from mean. – Convert to dimension measure (multiply by standard deviation). – Add or subtract mean.