Download to read offline


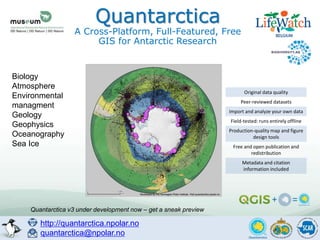


The document discusses various tools and resources available for researching Antarctic biodiversity, including the Antarctic Biodiversity Portal and R packages like atlasr and biotaxa. It highlights collaborative efforts among multiple national programs and contributors for analyzing tracking data of Antarctic species. Additionally, it introduces Quantarctica, a GIS for Antarctic research, and emphasizes the importance of data quality and metadata for scientific work.


