
Recommended
Recommended
More Related Content
Viewers also liked
Viewers also liked (15)
Similar to Analysis on Market Size and Structure of Chinese Bankcard Industry
Similar to Analysis on Market Size and Structure of Chinese Bankcard Industry (20)
Recently uploaded
Recently uploaded (20)
Analysis on Market Size and Structure of Chinese Bankcard Industry
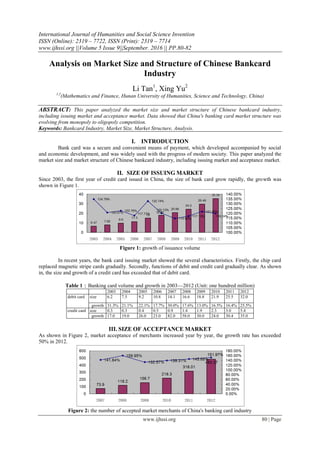
- 1. International Journal of Humanities and Social Science Invention ISSN (Online): 2319 – 7722, ISSN (Print): 2319 – 7714 www.ijhssi.org ||Volume 5 Issue 9||September. 2016 || PP.80-82 www.ijhssi.org 80 | Page Analysis on Market Size and Structure of Chinese Bankcard Industry Li Tan1 , Xing Yu2 1,2 (Mathematics and Finance, Hunan University of Humanities, Science and Technology, China) ABSTRACT: This paper analyzed the market size and market structure of Chinese bankcard industry, including issuing market and acceptance market. Data showed that China's banking card market structure was evolving from monopoly to oligopoly competition. Keywords: Bankcard Industry, Market Size, Market Structure, Analysis. I. INTRODUCTION Bank card was a secure and convenient means of payment, which developed accompanied by social and economic development, and was widely used with the progress of modern society. This paper analyzed the market size and market structure of Chinese bankcard industry, including issuing market and acceptance market. II. SIZE OF ISSUING MARKET Since 2003, the first year of credit card issued in China, the size of bank card grow rapidly, the growth was shown in Figure 1. Figure 1: growth of issuance volume In recent years, the bank card issuing market showed the several characteristics. Firstly, the chip card replaced magnetic stripe cards gradually. Secondly, functions of debit and credit card gradually clear. As shown in, the size and growth of a credit card has exceeded that of debit card. Table 1:Banking card volume and growth in 2003—2012 (Unit: one hundred million) 2003 2004 2005 2006 2007 2008 2009 2010 2011 2012 debit card size 6.2 7.5 9.2 10.8 14.1 16.6 18.8 21.9 25.5 32.0 growth 31.3% 21.1% 22.1% 17.7% 30.0% 17.6% 13.0% 16.5% 16.4% 25.5% credit card size 0.3 0.3 0.4 0.5 0.9 1.4 1.9 2.3 3.0 5.4 growth 17.0 19.0 26.0 23.0 82.0 58.0 30.0 24.0 30.4 35.0 III. SIZE OF ACCEPTANCE MARKET As shown in Figure 2, market acceptance of merchants increased year by year, the growth rate has exceeded 50% in 2012. Figure 2: the number of accepted market merchants of China's banking card industry
- 2. Analysis on Market Size and Structure of Chinese Bankcard Industry www.ijhssi.org 81 | Page As shown in Figure 3, the number of ATM terminals has increased, but the growth rate declined, which is affected by the substitution of bank cards for cash. Figure 3: the number of ATM terminals As shown in Figure 4, the number of POS terminals has increased, and contrast with Figure 2, the growth rate of POS machines is similar to that of merchants. Figure 4: the number of POS terminals Since 2007, merchants, ATM and POS all have a highly growth. Because of the improvement of people's living standards, demand of quick payment promoted a change of payment. IV. STRUCTURE OF ISSUING MARKET Bain’s classification of concentration as shown in Table 2 Table 2 Classification of Market Structure type Type of Market Structure CR4(%) CR8(%) Oligopoly Ⅰ 75 ≤ CR4 ---- Oligopoly Ⅱ 65 ≤ CR4 < 75 85 ≤ CR4 Oligopoly Ⅲ 50 ≤ CR4 < 65 75 ≤ CR4 < 85 Oligopoly Ⅳ 35 ≤ CR4 < 50 45 ≤ CR4 < 75 Oligopoly Ⅴ 30 ≤ CR4 < 35 40 ≤ CR4 < 45 China's banking card concentration of issuing market in 2003-2012 was shown in Table 3. Table 3: concentration of issuing market Index 2003 2004 2005 2006 2007 2008 2009 2010 2011 2012 CR1 Card volume 0.2310 0.2108 0.2281 0.1957 0.2113 0.2083 0.1757 0.1714 0.1690 0.1854 Turnover 0.3980 0.4130 0.3699 0.3808 0.3562 --- 0.3126 0.2951 0.2499 0.2525 CR4 Card volume 0.6894 0.6613 0.6677 0.6598 0.6672 0.6477 0.6227 0.6154 0.6056 0.5896 Turnover 0.8524 0.8106 0.8520 0.7994 0.7579 --- 0.6503 0.6508 0.6179 0.5983 CR8 Card volume 0.8852 0.8695 0.8579 0.8598 0.8400 0.8229 0.7959 0.7859 0.7643 0.6672 Turnover 0.9482 0.9294 0.9401 0.8832 0.8695 --- 0.7642 0.7781 0.7578 0.7312 The CR4 and CR8 all showed a downward trend, especially the market concentration of card volume, decreased from 88.52% to 66.72%, shows that issuing market of China's banking card industry had an oligopoly market structure. In recent years, with the issuing market monopoly gradually reduced, more and more issuers occupied a place in the market, and the overall structure of the market is gradually transformed by the oligopoly towards competitive.
- 3. Analysis on Market Size and Structure of Chinese Bankcard Industry www.ijhssi.org 82 | Page V. STRUCTURE OF ACCEPTANCE MARKET The CRn of acceptance market were shown in Table 4. Overall, index continued to decline, the market's concentration is decreasing, and the market structure of oligopoly is being break in. Table 4: CRn of acceptance market 2003 2004 2005 2006 2007 2008 2009 2010 2011 2012 CR1 MA 0.2425 0.2245 0.2048 0.1857 0.1607 0.1595 0.1498 0.1439 0.1264 0.1136 ATM 0.2283 0.2052 0.2219 0.2009 0.1835 0.1692 0.1587 0.1562 0.1412 0.1309 POS 0.2217 0.2386 0.2458 0.2619 0.2821 0.2913 0.2845 0.2784 0.2591 0.2483 CR4 MA 0. 8017 0.7738 0.7495 0.7313 0.6929 0.6753 0.6310 0.6015 0.5094 0.4538 ATM 0.6781 0.6646 0.6386 0.6166 0.5982 0.5803 0.5812 0.5681 0.5546 0.5432 POS 0.7368 0.7424 0.7301 0.7186 0.7004 0.6788 0.6593 0.6374 0.6108 0.6043 CR8 MA 0.9284 0.9324 0.9372 0.9283 0.9021 0.8799 0.8468 0.8124 0.7930 0.7692 ATM 0.8706 0.8533 0.8173 0.8095 0.7928 0.7840 0.7780 0.7693 0.7618 0.7317 POS 0.9368 0.9204 0.9199 0.9033 0.8928 0.8771 0.8542 0.8390 0.8215 0.8043 Table captions appear centered above the table in upper and lower case letters. When referring to a table in the text, no abbreviation is used and "Table" is capitalized. (10) VI. CONCLUSION Throughout China's banking card market, CR4 and CR8 of the issuing market all showed a downward trend, market structure evolved from oligopoly I to oligopoly III. The acceptance market had a same situation, means that China's banking card market structure was evolving from monopoly to oligopoly competition. REFERENCES [1] Guisun Chen. Wujun Kong. Lingzhu Wan, New developments in theory of foreign bank card industry. Industrial Economics Research, 2007(1), 2007,71-79. [2] Liangchun Yu, Yuan Ju. Monopoly and competition: China's banking reform and development . Economic Research Journal, 1999(8), 1999, 48-57. [3] Jinpu Jiao. Analysis of the competition of Chinese banking market . Macroeconomics, 2001(6), 2001, 41-46. [4] Guohong Wang. Restructuring of Chinese banking market commentary, Productivity Research, 2004(2), 2004, 8-10+13. [5] Qiong Zhou, Yumin Zhuang. Study of the market structure and pricing conduct of Chinese bank card industry. Modern Economic Science, 2005(7), 2005, 53-58+111. [6] Xiaomin Jiang. Market structure of China's banking card industry . Shanghai Finance, 2011(4), 2011, 81-85. [7] Bain, Industrial Organization (New York, John Wiley, 1959). [8] National Bureau of Statistics, China Statistical Yearbook 2002-2008( Beijing, Machinery Industry Press).