
Recommended
More Related Content
More from karolay barros Rodriguez
More from karolay barros Rodriguez (20)
Recently uploaded
Recently uploaded (20)
Analisis estadistico de octavo grado
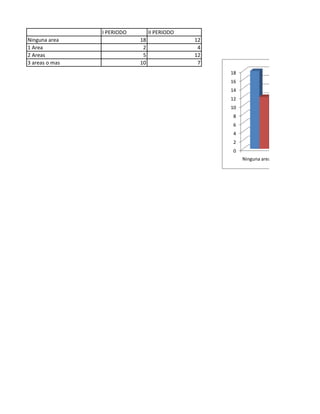
- 1. I PERIODO II PERIODO Ninguna area 18 12 1 Area 2 4 2 Areas 5 12 3 areas o mas 10 7 18 16 14 12 10 8 6 4 2 0 Ninguna area
- 2. I PERIODO II PERIODO Ninguna area 1 Area 2 Areas 3 areas o mas
- 3. I PERIODO II PERIODO ESPAÑOL 5 8 8 MATEMATICA 2 6 7 INFORMATICA 1 3 6 INGLES 8 2 5 SOCIALES 3 2 4 NATURALEZ 5 1 3 EDUCACION FISICA 3 5 2 RELIGION 6 7 1 ARTISTICA 2 1 0