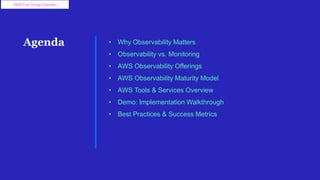
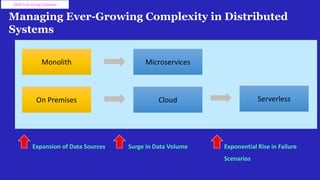
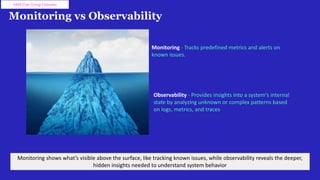
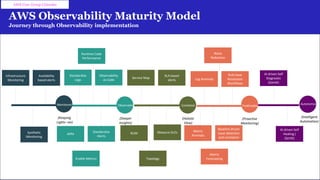
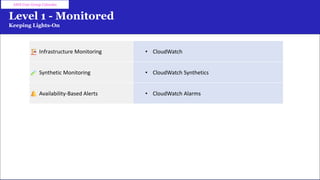
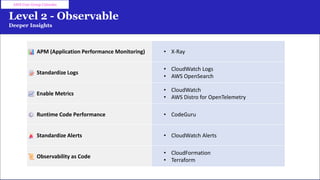
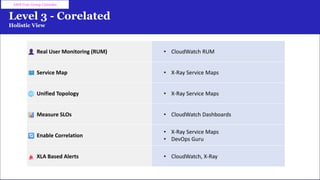
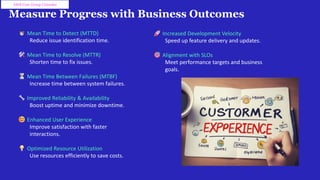
24%of organizations have
breached a contractual service level
agreement in the last 12 months
66%of organizations use
between 2-5 monitoring or
observability tools.
Catchpoint SRE Report 2024
AWS User Group Colombo
Amplifying Reliability with
AWS
Observability Implementation
Guide and Best practices
Indika Wimalasuriya
AWS User Group Colombo
Agenda • Why Observability Matters
• Observability vs. Monitoring
• AWS Observability Offerings
• AWS Observability Maturity Model
• AWS Tools & Services Overview
• Demo: Implementation Walkthrough
• Best Practices & Success Metrics
AWS User Group Colombo
Quick Intro about myself
• Reliability Engineering Advocate, Solution Architect (specializing in SRE,
Observability, AIOps, & GenAI)
• Senior Systems Engineering Manager at Virtusa, overseeing technical
delivery, capability development and offering.
• Passionate Technical Trainer.
• Energetic Technical Blogger.
• AWS Community Builder - Cloud Operations.
• Ambassador at DevOps Institute (PeopleCert).
AWS User Group Colombo
Managing Ever-Growing Complexity in Distributed
Systems
Monolith Microservices
On Premises Cloud Serverless
Expansion of Data Sources Surge in Data Volume Exponential Rise in Failure
Scenarios
AWS User Group Colombo
Reliability: The Backbone of Modern Technology
Why consistent performance matters more than ever.
AWS User Group Colombo
Monitoring vs Observability
AWS User Group Colombo
Monitoring shows what’s visible above the surface, like tracking known issues, while observability reveals the deeper,
hidden insights needed to understand system behavior
Monitoring - Tracks predefined metrics and alerts on
known issues.
Observability - Provides insights into a system's internal
state by analyzing unknown or complex patterns based
on logs, metrics, and traces
Understanding Observability
AWS User Group Colombo
• Exactly “how” can the internal state of a system be known?
• Examples of Signals
• Data emitted and collected from these signals
With proper applications in place, forms of communication called signals are emitted that provide quality
information to monitor the internal state of the system known as Observability
• Metrics
• Events
• Logs
• Traces
• Telemetry
Metrics, Events, Logs and Tracers (MELT)
AWS User Group Colombo
Metrics are the values pertaining to
a system/application at a certain
point in time
Events are specific sequences of
occurrences that take place within a
system being monitored
Logs are the original data type; in their
most fundamental form, logs are
essentially lines of text a system or
application produces when certain code
blocks are executed
Traces, or more precisely, “distributed
traces”, are samples of causal chains
of events or transactions between
different components in a
microservices ecosystem
Performance Impact Business Outcomes
Observability Enables Detecting Slowness
AWS User Group Colombo
“SLOW is the new DOWN”
Walmart found that for every 1 second improvement in page load time, conversions
increased by 2%
COOK increased conversions by 7% by reducing page load time by 0.85 seconds
Mobify found that each 100ms improvement in their homepage's load time resulted in a
1.11% increase in conversion
AWS User Group Colombo
The observability market is
valued at approximately $12
billion USD, making it a
highly competitive space
with numerous major
players
AWS User Group Colombo
AWS Observability Native Offerings
AWS CloudWatch
Digital Experience
Monitoring
Insights & Analytics
Visualizations
Foundations
Instrumentation & Collection
Synthetics RUM
Application Signals
Container Insights Lambda Insights Log Insights
Application Insights EC2 Health Live Trail
Dashboards Metric Explore SLOs
Metrics Logs Tracers
CloudWatch Agent AWS Distro for OpenTelmetry
Not Having a Plan is the
Biggest Observability
Anti-Pattern!
AWS Observability Maturity Model
Journey through Observability implementation
AWS User Group Colombo
APM
Standardize
Alerts
Infrastructure
Monitoring
Availability
based alerts
RUM
Metric
Anomaly
Baseline driven
issue detection
and corelation
AI driven Self
Diagnostic
(GenAI)
Enable Metrics
Measure SLOs
Metric
Forecasting
Standardize
Logs
Observability
as Code
Service Map
XLA based
alerts Log Anomaly
Rule base
Resolution
Workflows
AI driven Self
Healing (
GenAI)
Synthetic
Monitoring
Topology
Noise
Reduction
Runtime Code
Performance
Monitored
(Keeping
Lights –on)
Observable
(Deeper
Insights)
Corelated
(Holistic
View)
Predictable
(Proactive
Monitoring)
Autonomous
(Intelligent
Automation)
Level 1 - Monitored
Keeping Lights-On
AWS User Group Colombo
Infrastructure Monitoring • CloudWatch
Synthetic Monitoring • CloudWatch Synthetics
Availability-Based Alerts • CloudWatch Alarms
Level 2 - Observable
Deeper Insights
AWS User Group Colombo
APM (Application Performance Monitoring) • X-Ray
Standardize Logs
• CloudWatch Logs
• AWS OpenSearch
Enable Metrics
• CloudWatch
• AWS Distro for OpenTelemetry
Runtime Code Performance • CodeGuru
Standardize Alerts • CloudWatch Alerts
Observability as Code
• CloudFormation
• Terraform
Level 3 - Corelated
Holistic View
AWS User Group Colombo
Real User Monitoring (RUM) • CloudWatch RUM
Service Map • X-Ray Service Maps
Unified Topology • X-Ray Service Maps
Measure SLOs • CloudWatch Dashboards
Enable Correlation
• X-Ray Service Maps
• DevOps Guru
XLA Based Alerts • CloudWatch, X-Ray
Level 4 - Predictable
Pre-emptive Monitoring
AWS User Group Colombo
Metric Anomaly Detection • CloudWatch Anomaly Detection
Log Anomaly Detection • CloudWatch Log Anomalies
Metric Forecasting • AWS Forecast
Noise Reduction • CloudWatch Events
Baseline-Driven Issue Detection • DevOps Guru
Rule-Based Resolution Workflows
• Lambda
• AWS Systems Manager
Level 5 - Autonomous
Intelligent Automation
AWS User Group Colombo
AI-Driven Self-Diagnosis
• Amazon Lookout for Metrics
• GenAI
AI-Driven Self-Healing
• GenAI
• AIOps workflows via Systems Manager and Lambda
Demo
AWS User Group Colombo
Best practices
Standardize Logging & Monitoring
Use CloudWatch Logs & Metrics; ensure consistent log formats.
Instrumentation with X-Ray
Implement distributed tracing with X-Ray for visibility.
Automated Alerting & Response
Set CloudWatch Alarms; automate responses with Lambda/SNS.
Continuous Performance Optimization
Use Compute Optimizer for resource analysis and recommendations.
Integration with Managed Services
Leverage RDS, DynamoDB, Lambda with built-in CloudWatch
monitoring.
AWS User Group Colombo
Measure Progress with Business Outcomes
Mean Time to Detect (MTTD)
Reduce issue identification time.
Mean Time to Resolve (MTTR)
Shorten time to fix issues.
Mean Time Between Failures (MTBF)
Increase time between system failures.
Improved Reliability & Availability
Boost uptime and minimize downtime.
Enhanced User Experience
Improve satisfaction with faster
interactions.
Optimized Resource Utilization
Use resources efficiently to save costs.
AWS User Group Colombo
Increased Development Velocity
Speed up feature delivery and updates.
Alignment with SLOs
Meet performance targets and business
goals.
Stay Connected for the Latest on AWS Observability,
SRE & AIOps
AWS User Group Colombo
Connect with me on LinkedIn
– Indika Wimalasuriya
https://www.linkedin.com/in/indika-
wimalasuriya/
Follow my insights on Dev.to https://dev.to/indika_wimalasuriya
Thank you.

Amplifying Reliability with AWS Observability

  • 1.
    24%of organizations have breacheda contractual service level agreement in the last 12 months 66%of organizations use between 2-5 monitoring or observability tools. Catchpoint SRE Report 2024 AWS User Group Colombo
  • 2.
    Amplifying Reliability with AWS ObservabilityImplementation Guide and Best practices Indika Wimalasuriya AWS User Group Colombo AWS User Group Colombo
  • 3.
    Agenda • WhyObservability Matters • Observability vs. Monitoring • AWS Observability Offerings • AWS Observability Maturity Model • AWS Tools & Services Overview • Demo: Implementation Walkthrough • Best Practices & Success Metrics AWS User Group Colombo
  • 4.
    Quick Intro aboutmyself • Reliability Engineering Advocate, Solution Architect (specializing in SRE, Observability, AIOps, & GenAI) • Senior Systems Engineering Manager at Virtusa, overseeing technical delivery, capability development and offering. • Passionate Technical Trainer. • Energetic Technical Blogger. • AWS Community Builder - Cloud Operations. • Ambassador at DevOps Institute (PeopleCert). AWS User Group Colombo
  • 5.
    Managing Ever-Growing Complexityin Distributed Systems Monolith Microservices On Premises Cloud Serverless Expansion of Data Sources Surge in Data Volume Exponential Rise in Failure Scenarios AWS User Group Colombo
  • 6.
    Reliability: The Backboneof Modern Technology Why consistent performance matters more than ever. AWS User Group Colombo
  • 7.
    Monitoring vs Observability AWSUser Group Colombo Monitoring shows what’s visible above the surface, like tracking known issues, while observability reveals the deeper, hidden insights needed to understand system behavior Monitoring - Tracks predefined metrics and alerts on known issues. Observability - Provides insights into a system's internal state by analyzing unknown or complex patterns based on logs, metrics, and traces
  • 8.
    Understanding Observability AWS UserGroup Colombo • Exactly “how” can the internal state of a system be known? • Examples of Signals • Data emitted and collected from these signals With proper applications in place, forms of communication called signals are emitted that provide quality information to monitor the internal state of the system known as Observability • Metrics • Events • Logs • Traces • Telemetry
  • 9.
    Metrics, Events, Logsand Tracers (MELT) AWS User Group Colombo Metrics are the values pertaining to a system/application at a certain point in time Events are specific sequences of occurrences that take place within a system being monitored Logs are the original data type; in their most fundamental form, logs are essentially lines of text a system or application produces when certain code blocks are executed Traces, or more precisely, “distributed traces”, are samples of causal chains of events or transactions between different components in a microservices ecosystem
  • 10.
    Performance Impact BusinessOutcomes Observability Enables Detecting Slowness AWS User Group Colombo “SLOW is the new DOWN” Walmart found that for every 1 second improvement in page load time, conversions increased by 2% COOK increased conversions by 7% by reducing page load time by 0.85 seconds Mobify found that each 100ms improvement in their homepage's load time resulted in a 1.11% increase in conversion
  • 11.
    AWS User GroupColombo The observability market is valued at approximately $12 billion USD, making it a highly competitive space with numerous major players
  • 12.
    AWS User GroupColombo AWS Observability Native Offerings AWS CloudWatch Digital Experience Monitoring Insights & Analytics Visualizations Foundations Instrumentation & Collection Synthetics RUM Application Signals Container Insights Lambda Insights Log Insights Application Insights EC2 Health Live Trail Dashboards Metric Explore SLOs Metrics Logs Tracers CloudWatch Agent AWS Distro for OpenTelmetry
  • 13.
    Not Having aPlan is the Biggest Observability Anti-Pattern!
  • 14.
    AWS Observability MaturityModel Journey through Observability implementation AWS User Group Colombo APM Standardize Alerts Infrastructure Monitoring Availability based alerts RUM Metric Anomaly Baseline driven issue detection and corelation AI driven Self Diagnostic (GenAI) Enable Metrics Measure SLOs Metric Forecasting Standardize Logs Observability as Code Service Map XLA based alerts Log Anomaly Rule base Resolution Workflows AI driven Self Healing ( GenAI) Synthetic Monitoring Topology Noise Reduction Runtime Code Performance Monitored (Keeping Lights –on) Observable (Deeper Insights) Corelated (Holistic View) Predictable (Proactive Monitoring) Autonomous (Intelligent Automation)
  • 15.
    Level 1 -Monitored Keeping Lights-On AWS User Group Colombo Infrastructure Monitoring • CloudWatch Synthetic Monitoring • CloudWatch Synthetics Availability-Based Alerts • CloudWatch Alarms
  • 16.
    Level 2 -Observable Deeper Insights AWS User Group Colombo APM (Application Performance Monitoring) • X-Ray Standardize Logs • CloudWatch Logs • AWS OpenSearch Enable Metrics • CloudWatch • AWS Distro for OpenTelemetry Runtime Code Performance • CodeGuru Standardize Alerts • CloudWatch Alerts Observability as Code • CloudFormation • Terraform
  • 17.
    Level 3 -Corelated Holistic View AWS User Group Colombo Real User Monitoring (RUM) • CloudWatch RUM Service Map • X-Ray Service Maps Unified Topology • X-Ray Service Maps Measure SLOs • CloudWatch Dashboards Enable Correlation • X-Ray Service Maps • DevOps Guru XLA Based Alerts • CloudWatch, X-Ray
  • 18.
    Level 4 -Predictable Pre-emptive Monitoring AWS User Group Colombo Metric Anomaly Detection • CloudWatch Anomaly Detection Log Anomaly Detection • CloudWatch Log Anomalies Metric Forecasting • AWS Forecast Noise Reduction • CloudWatch Events Baseline-Driven Issue Detection • DevOps Guru Rule-Based Resolution Workflows • Lambda • AWS Systems Manager
  • 19.
    Level 5 -Autonomous Intelligent Automation AWS User Group Colombo AI-Driven Self-Diagnosis • Amazon Lookout for Metrics • GenAI AI-Driven Self-Healing • GenAI • AIOps workflows via Systems Manager and Lambda
  • 20.
  • 21.
    Best practices Standardize Logging& Monitoring Use CloudWatch Logs & Metrics; ensure consistent log formats. Instrumentation with X-Ray Implement distributed tracing with X-Ray for visibility. Automated Alerting & Response Set CloudWatch Alarms; automate responses with Lambda/SNS. Continuous Performance Optimization Use Compute Optimizer for resource analysis and recommendations. Integration with Managed Services Leverage RDS, DynamoDB, Lambda with built-in CloudWatch monitoring. AWS User Group Colombo
  • 22.
    Measure Progress withBusiness Outcomes Mean Time to Detect (MTTD) Reduce issue identification time. Mean Time to Resolve (MTTR) Shorten time to fix issues. Mean Time Between Failures (MTBF) Increase time between system failures. Improved Reliability & Availability Boost uptime and minimize downtime. Enhanced User Experience Improve satisfaction with faster interactions. Optimized Resource Utilization Use resources efficiently to save costs. AWS User Group Colombo Increased Development Velocity Speed up feature delivery and updates. Alignment with SLOs Meet performance targets and business goals.
  • 23.
    Stay Connected forthe Latest on AWS Observability, SRE & AIOps AWS User Group Colombo Connect with me on LinkedIn – Indika Wimalasuriya https://www.linkedin.com/in/indika- wimalasuriya/ Follow my insights on Dev.to https://dev.to/indika_wimalasuriya
  • 24.